Covid is spreading faster than holiday cheer.
I don't care because Moderna (get 'em) had great lab results against Omicron and I was lucky enough to have 3 Moderna (MRNA) shots this year. We sold 5 MRNA 2024 $200 puts for $25 in our Long-Term Portfolio (LTP), putting us in 500 shares for net $175 and, at $37.75 on Thursday, I pointed out that it was still good for a new trade. MRNA pulled back to the $250 line but, as Fundamental Investors, we don't worry about the PRICE of a stock – we only care about the VALUE of a stock and those are, strangely, two very different things. Learning to take advantage of those differences is what PSW is all about!
I was going to review our last 4 Member Portfolios over the weekend but the markets are down another 1% this morning as more and more countries go back to lockdowns over the weekend (and right before Christmas). Things are so bad that Ireland has closed the bars (short Guinness). Oil (/CL) is back down to $67.50, which can be played for a bounce into Wednesday's EIA Inventory Report (tight stops below). Oil demand is at 99Mb/d, which is 2Mb/d below the pre-pandemic levels and oil traders tend to watch very short-term charts and don't realize holiday travel plans are not that likely to be cancelled in the US – as we're still in that denial phase (see Friday's useful sentiment chart).
 Oh and, once again, we did not pass the infrastructure bill – and that was supposed to improve demand as well. Lack of stimulus in the US is making investors around the World nervous that other Governments can't afford to keep propping up the economy and GDP forecasts are coming down. We're not terribly worried until we see more red on our bounce chart, which we've been using all month:
- Dow 36,000 to 34,200 has bounce lines of 34,560 (weak) and 34,920 (strong)
- S&P 4,700 to 4,465 has bounce lines of 4,512 (weak) and 4,559 (strong)
- Nasdaq 16,500 to 15,675 has bounce lines of 15,840 (weak) and 16,005 (strong)
- Russell 2,400 to 2,080 has bounce lines of 2,144 (weak) and 2,208 (strong)
See, not so bad, is it? We never hit 4,465 on /ES – it's just our projected 5% drop that hasn't happened yet. Anything below 4,500 is a cause for concern as those charts like to form "M" and "W" patterns and if the right side of the "M" breaks 4,500, then perhaps the bigger M is in play for another 5% correction – all the way to 4,230. Even if that happens though, it's still only a 10% correction and nothing to panic about. So we're a long way from panic and ultra-light holiday trading isn't going to tell us anything for the next two weeks. If you have your hedges in place (we do!), then this is an excellent time to take a nice two-week vacation and we'll see where things are on Janary 3rd.
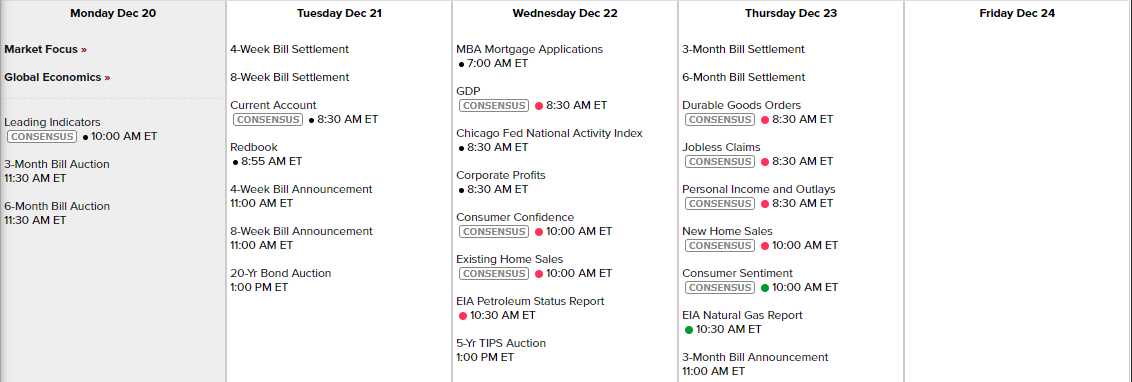
There's no Fed speak this week and Friday is a holiday (the next Friday too), so only 8 market days until the 3rd. We have Leading Indicators this morning, GDP on Wednesday is just the 3rd revision of Q3 , Chicago Fed and Consumer Confidence will be more interesting and then Thursday hits us with a lot of data we'll pay attention to:

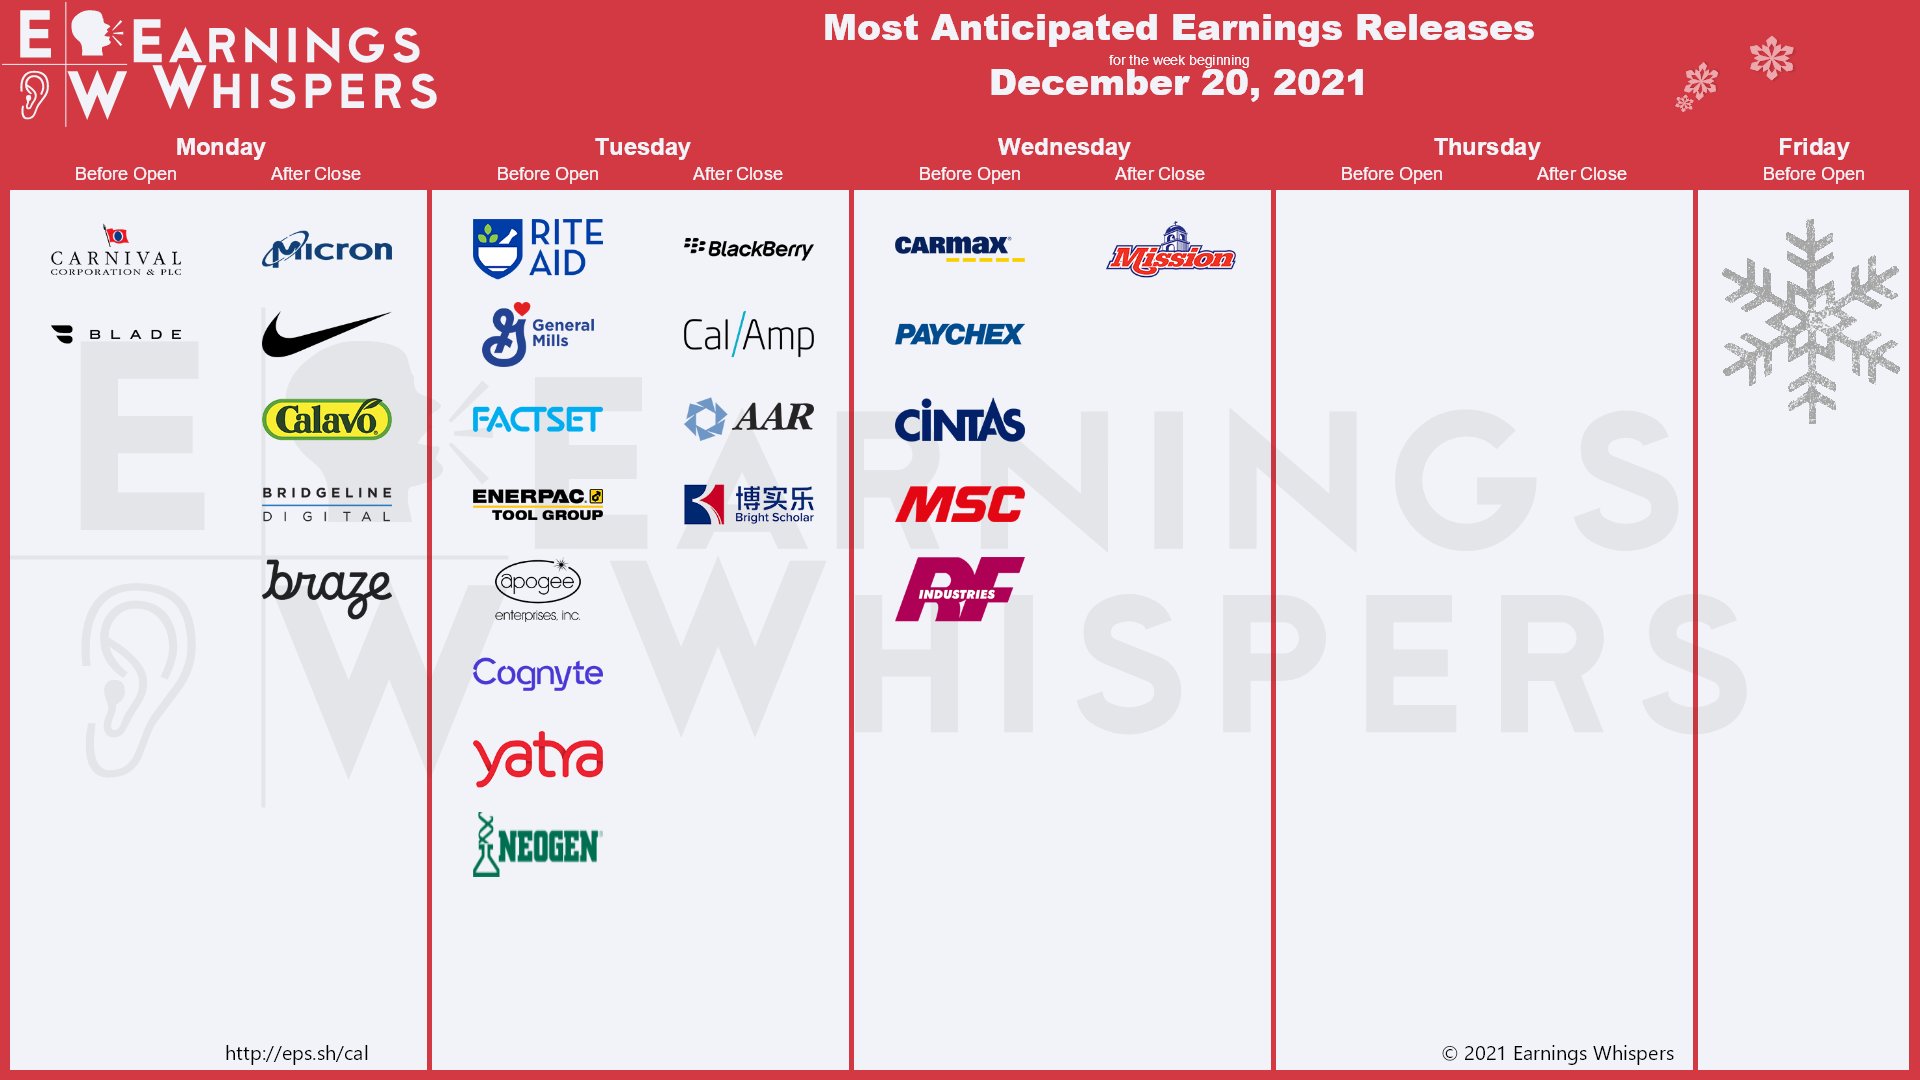
Earnings reports are still trickling in and, before we know it – it will be time for Q4 earnings reports.

Looking forward to a happy holiday season!


