It Really is More Volatile
Courtesy of Michael Batnick
We’ve been talking a lot on the podcast about market volatility. A listener emailed us with an interesting take:
“I am inclined to think that we all went through quite a volatile period in our personal lives over the last few years and are now projecting that onto our views of the market without any concrete evidence.”
If you’re not watching the market between the hours of 9:30-4, it might not seem like the market is acting all that unusual. The S&P 500 is down 1% this week. What’s abnormal about that? Nothing. Nothing at all. You won’t feel an earthquake if you’re in an airplane, but that doesn’t mean the ground didn’t tremble.
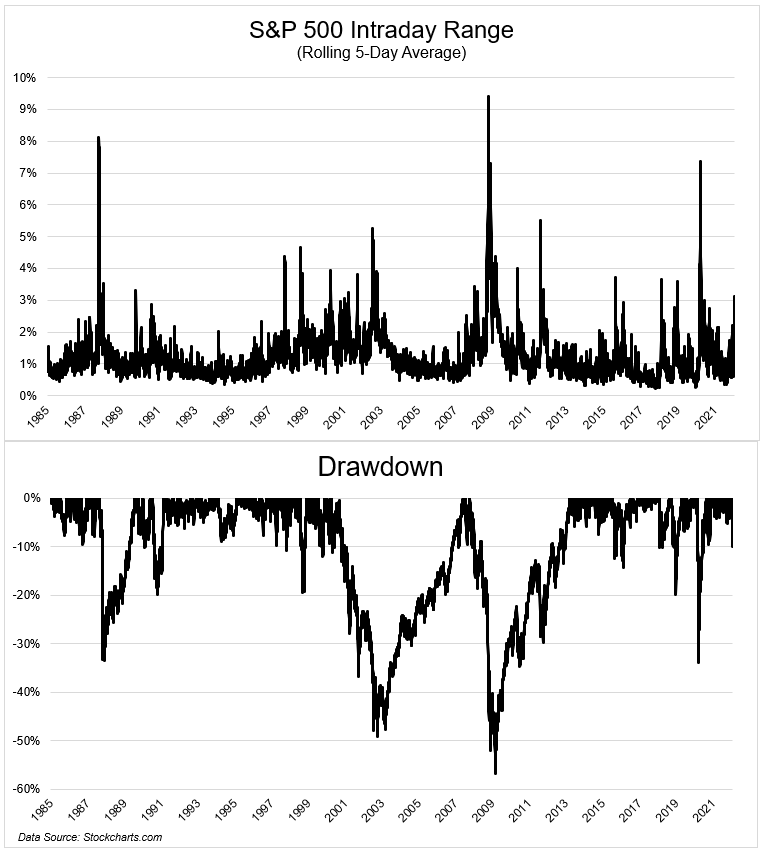
Here’s a good data point to demonstrate the odd dynamics playing out in the market today. If we measure the intraday high to low, and average that over a 5-day period, you can see a spike in the most recent period. Again, nothing off the charts here. But the fact that it’s happening outside of a full-blown bear market is very unusual. When the 5-day average high-to-low is >3%, the market is in a 32% drawdown, on average. Right now, we’re just 10% below the highs.
We’re not projecting. The market is acting super volatile. The good news is that volatility is one of the most mean-reverting data series in financial markets. This back and forth should work itself out sooner than later. The bad news is it might work itself out to the downside.
But if you’ll allow me to take the other side, Michael, there’s already blood in the streets, which has historically been a good time to buy stocks. Sometimes.


