Down we go again!

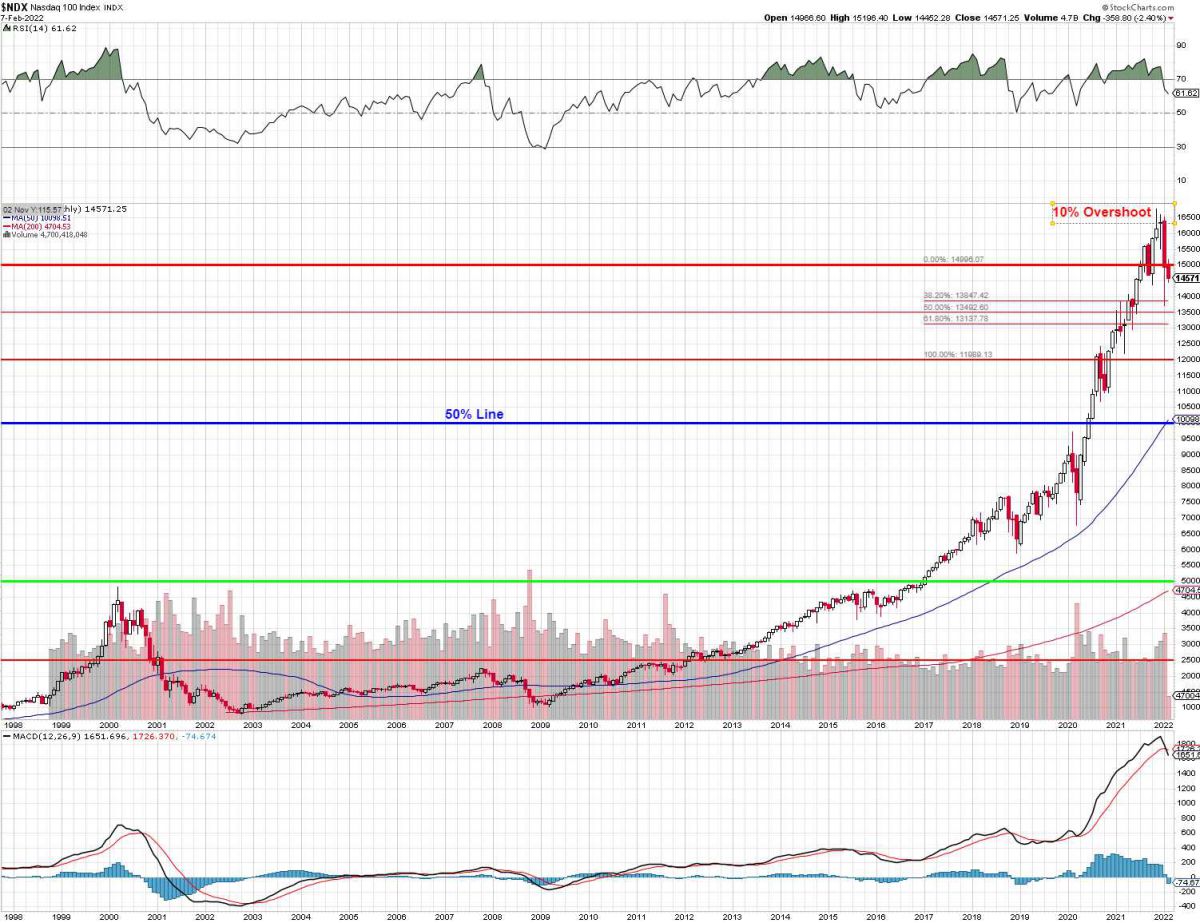
It's important to have some perspective when contemplating the future so here is the Nasdaq's chart for the 21st Century, so far. I'm sure it's not how you remember it because of something called a recency bias and it's hard to imagine, after going up from 2,500 to 16,500 (560%) in the past 10 years, that the Nasdaq has done anything else in the past 20 years but, other than another silly 400% run we had from 1997 to 2000, we were essentially flat for the first 10 years.

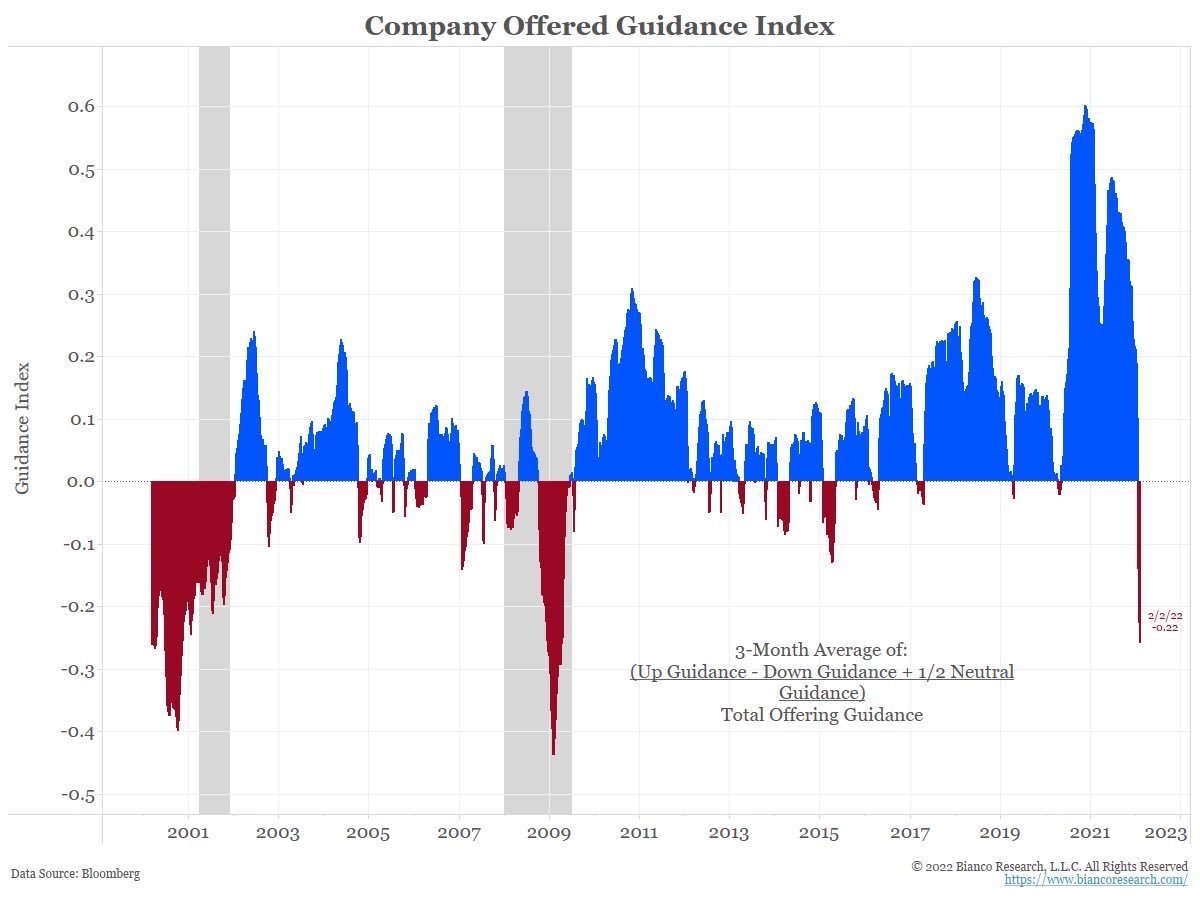
Guidance, as you can see, is also a big problem, with Corporate Guidance now coming in at the worst since warning signs were flashing in 2008, ahead of a 66.6% correction. As you have been seeing this season, notably with FaceBook – investors seem to have little tolerance for any company that is misstepping in either earnings or guidance – not at these lofty levels…
So, please turn your attention to the MACD line at the base of the Nasdaq chart. This is a very common technical signal and it utilizes moving averages, which is the one TA thing I actually believe in. Notice on the monthly chart, that we have only just begun to cross under the red line and even the relatively mild pullback of 2018/19 was 20%, which would take the Nasdaq from 16,500 to 13,200 – which is what we do expect to happen this month.

I don't know how many times the Fed can tell us that is exactly what they intend to do and how many times traders are going to ignore it – probably until after it happens and then they will wonder why no one saw it coming – as usual…

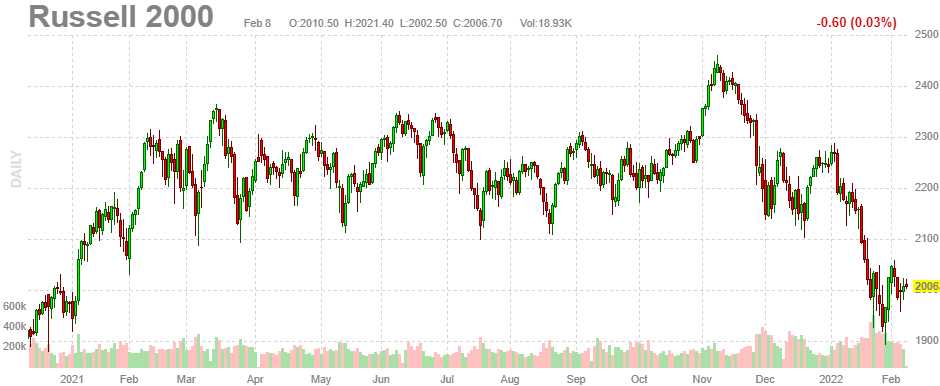
The Russell 2000 has already fallen 20%, from 2,400 to 1,920 is exactly 20% and that's 480 points but we'll call it 500 at 1,900 and call the bounces 100 points which makes 2,000 the weak bounce line and 2,100 the strong bounce line. This morning, as we have for two weeks, we are flirting with that 2,000 line but I fear we're consolidating for a move down – not a recovery:

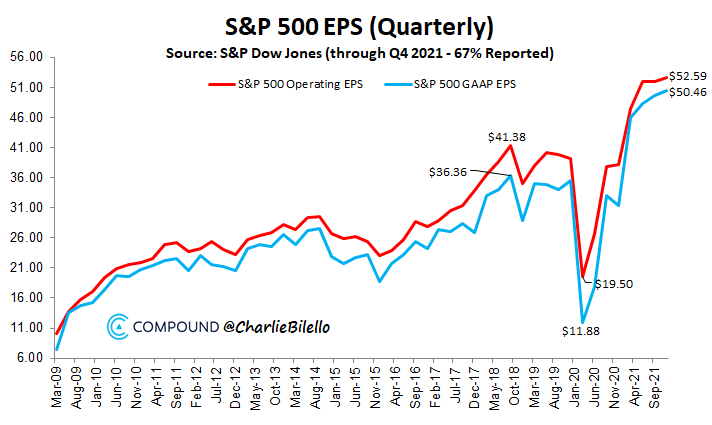
If the Russell can't recover from its 20% drop, don't expect the other indexes to do any better. Since the net trend of earnings has been punishing for companies so far, with 1/3 left to report we can assume another 1/3 lower on the indexes until they finally stop telling people how badly things are going. THEN it will be time for the Fed to hike. See – fun days ahead!

That's why the Fed's initial estimate of Q1 2022 GDP is way down at 0.25%, several miles below that of leading Economorons, who have yet to get around to revising their stimulus-expecting forecasts from last year and are still looking for 2.75% growth. We won't even get our 2nd estimate of Q4's GDP from the Government until Thursday the 24th so it will be April before we officially put a stake in the heart of Q1 estimates but the smart money is already getting out – as it takes a very long time to unwind bullish positions in a low-volume market – keep that in mind!
With the Nasdaq back below 4,700, we are back to watching our 20% correction bounce chart. These bottoms are our estimates – we haven't hit them – yet:
- Dow 36,000 to 28,800 would be a 7,200-point drop with 1,440 bounces to 30,240 (weak) and 31,680 (strong).
- S&P 4,800 is 20% above 4,000 and that makes it an 800-point drop with 160-point bounces so 4,160 (weak) and 4,320 (strong).
- Nasdaq is using 13,500 as the base and we bottomed at 13,706. 14,100 is the weak bounce and 14,700 is strong.
- Russell 1,600, would be about an 800-point drop with 160-point bounces to 1,780 (weak) and 1,960 (strong).


