By VisualCapitalist. Originally published at ValueWalk.

Amidst supply chain issues and inflated shipping costs, global trade continued to grow last year, reaching an estimated $28 trillion in 2021—a 23% increase compared to the year prior.
Q4 2021 hedge fund letters, conferences and more
Which countries are the central nodes of the global trade network? While China is currently the world’s largest trading partner, this hasn’t always been the case.
This series of graphics by Anders Sundell outlines the history of the world’s biggest trade hubs, showing how the landscape has evolved since 1960. Using netgraphs, each visual connects countries to their primary trading partner, using data that includes both imports and exports.
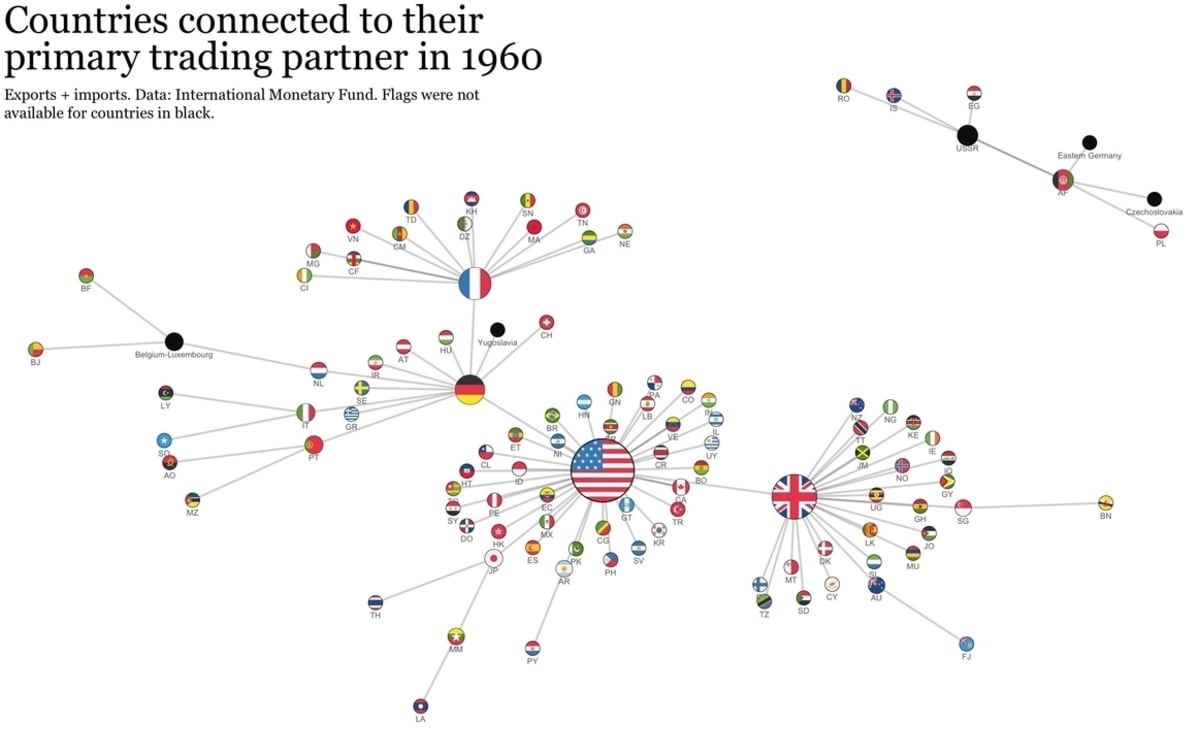
1960: A Period of U.S. Trade Dominance
International trade has existed for millennia, and had previously been accomplished through famous trade routes like the Silk Road, which transported luxury goods from China to Europe since the first century BCE.
However, our story begins in the 1960s—just before containerization spread from the United States around the world, transforming global trade forever.
View the full-size infographic
In the 1960s, the U.S. was experiencing its post-war economic boom. Consumer spending was driving swift economic growth, and a rising middle class led to increased demand for luxury goods like TVs and cars. In response to this rising demand, U.S. factories that had been essential to the war effort swooped in quickly, and domestic production began to thrive.
Around the same time, legislation that encouraged international trade was being passed through Congress. In 1962, President John F. Kennedy signed the Trade Expansion Act into law, allowing the American government to negotiate massive tariff cuts with other countries. This ultimately led to the Kennedy Round two years later, which was a series of trade negotiations that resulted in lower tariffs and reduced barriers on exports for developing countries.
Across the pond, Europe was going through its own series of changes in the 1960s. While Britain was the most important player in trade in Europe at the time, the country was also struggling to recover from the financial burden of the two world wars.
Simultaneously, European countries were also banding together in an attempt to balance power and eliminate hegemony within Europe. In 1960, the European Free Trade Association (EFTA) was created, creating free trade agreements between Austria, Denmark, Norway, Portugal, Sweden, Switzerland, and the United Kingdom.
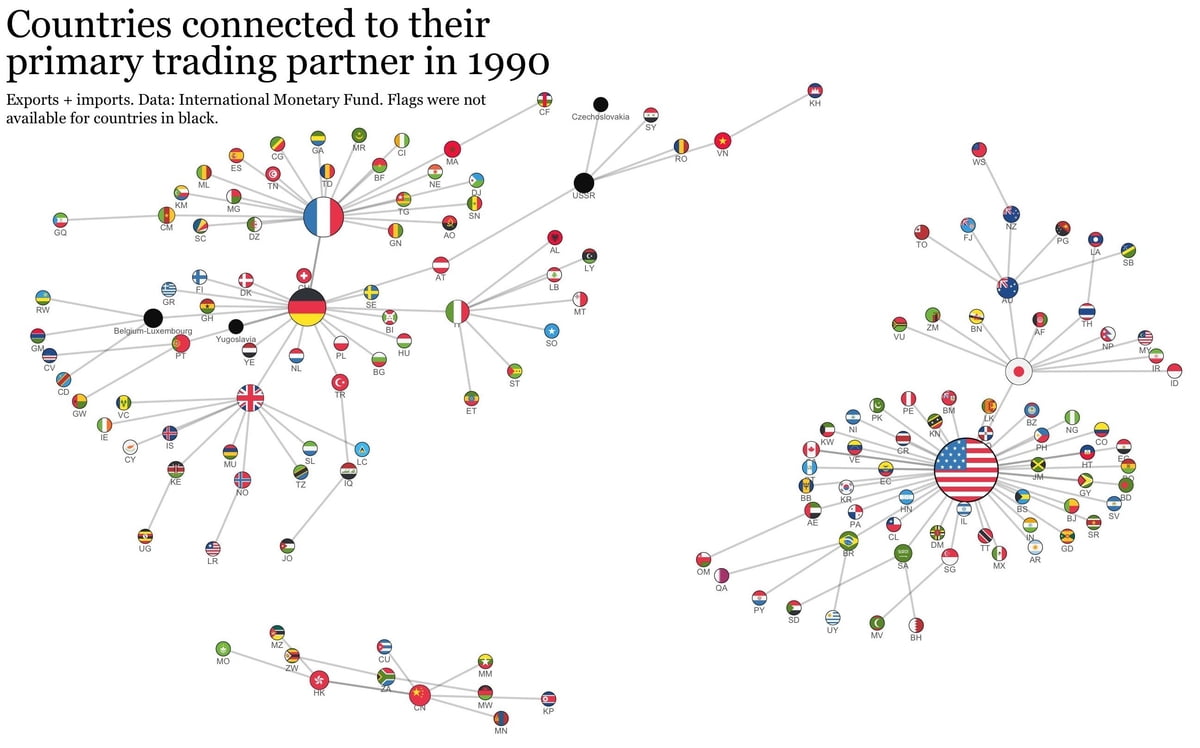
1990: The Emergence of China
By 1990, the world’s international trade landscape was on the cusp of dramatic change.
View the full-size infographic
For starters, Britain’s global trade dominance had dwindled further, and a newly united Germany had stepped up to pick up the slack. Germany’s automobile industry started to expand rapidly around this time. In 1990, Germany exported 2.6 million cars worldwide, which was fewer than Japan shipped that year, but still enough to make Germany one of the most important trade hubs at the time.
1990 was also around the same time that China was starting to emerge as a global leader. The country’s economy had been picking up steam over the previous decade, thanks to a series of reforms brought on by then-leader Deng Xiaoping that were created to encourage foreign investment and boost international trade.
This new focus on economic growth in China spurred the rapid expansion of free trade zones in the country, which granted certain areas special liberties on importing and exporting goods.
Throughout the 1990s, China’s economic prosperity continued, and its role in international trade became increasingly significant. Finally, at the end of the decade, China became a member of the World Trade Organization, giving the country an unparalleled opportunity to establish itself further as a major global trading partner.
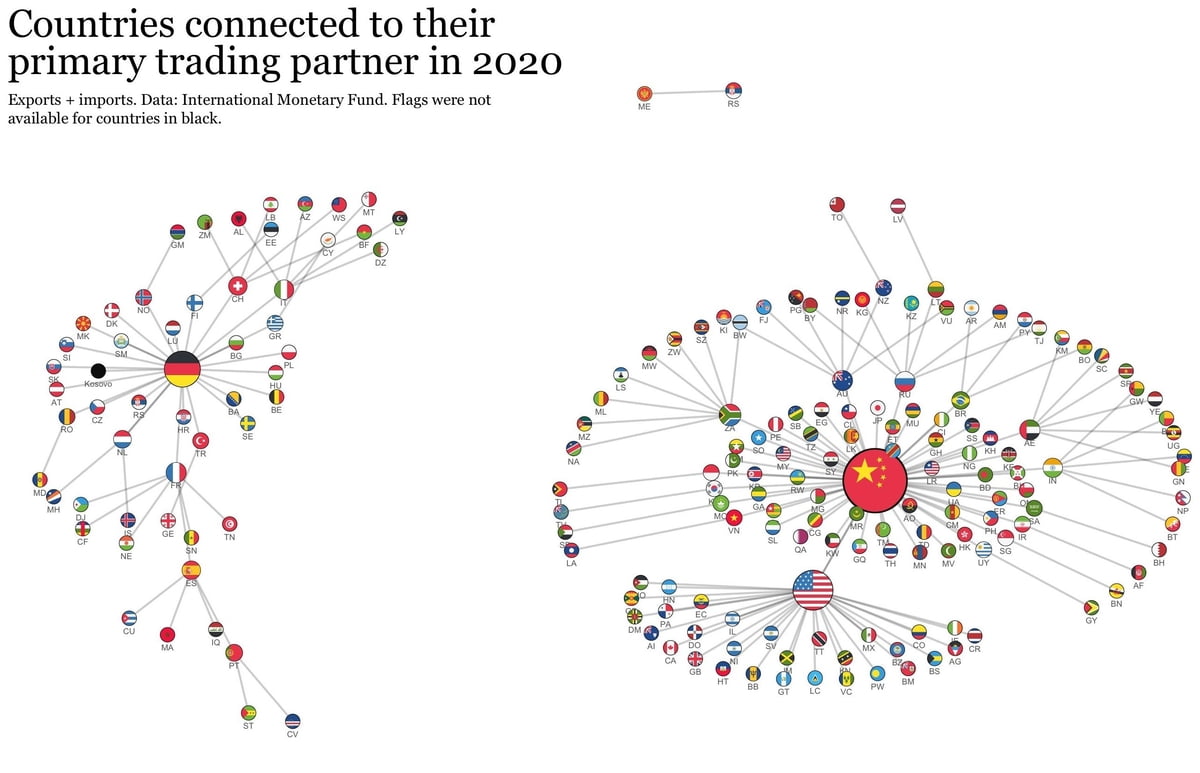
2020: A New World Order
By 2020, China had overtaken the U.S. as the world’s biggest trade partner. But as the country’s influence grew, so did tensions between the U.S. and China.
View the full-size infographic
In 2018, the Trump administration set tariffs on more than $360 billion in goods, in an effort to encourage Americans to purchase domestic products. In response, China set its own tariffs on more than $110 billion worth of U.S. goods.
The conflict is still ongoing, and so far, there’s no clear winner in sight. The tariffs and trade barriers have hurt both countries, and with bilateral trade sputtering, many are left wondering if the peak of globalization is well behind us.
Article by Visual Capitalist
Updated on
Sign up for ValueWalk’s free newsletter here.


