Courtesy of Chris Kimble
It’s been a crazy past couple of years for the 10-year US treasury bond yields and interest rates.
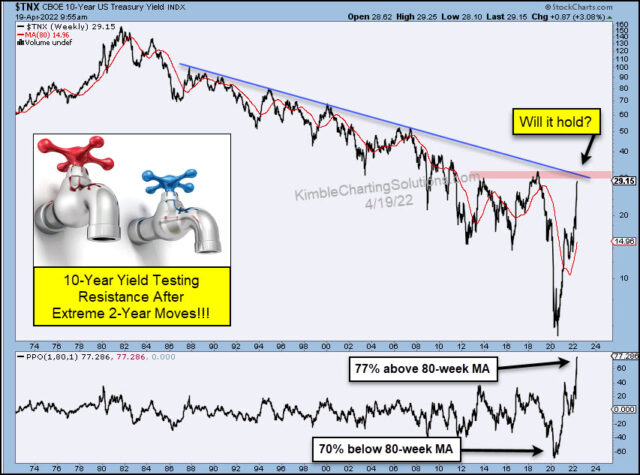
The crazy extremes have seen rates fall to near zero and his back up near 3 percent.
We can see this in today’s long-term chart of the 10-Year US treasury bond yield.
As you can see in the lower panel, interest rates went from 70% below 80-week moving average to the current 77% above the 80-week moving average. Talk about extremes!!
The recent extreme move higher has interest rates testing long-term trend line resistance.
Will it hold? It better, or interest rates could spike a great deal higher! Stay tuned!
This article was first written for See It Markets.com. To see the original post CLICK HERE.
To become a member of Kimble Charting Solutions, click here.


