By Fintel. Originally published at ValueWalk.

Haverty Furniture Companies, Inc. (NYSE:HVT) is an American specialty retailer of furniture and accessories. The company was founded in Atlanta in 1885 and now has over 100 locations across 16 states.
On Tuesday, Haverty Furniture increased its quarterly dividend by 12% to 28 cents per share, from 25 cents prior. The new annualized dividend yield will be 3.90% on the stock. The dividend yield has significantly risen over the past year as the stock has fallen -by 37%. This year alone, HVT’s share price has lost -6.4%, but we think it is starting to look cheap on a PE ratio of 5.8x.
Q1 2022 hedge fund letters, conferences and more
We first noticed this stock on the United States Dividend leaderboard, where Haverty Furniture holds the 4th highest dividend score with 97.29. HVT has a two-year Fintel dividend growth rate of 2.75%. The Dividend Yield and Quality Leaderboard for the United States uses an advanced quantitative model to determine companies with the best income-generating opportunities across our database of global securities. We use a combination of current dividend yield and dividend growth to generate a score that ranks companies from 0 to 100, with 100 being the most desirable.
HVT has also paid a few special dividends over the last few years, including a $2.00 dividend in November 2020 and another $2.00 in November 2021. Could we see more special dividends in the future?
Ha < UNK> recently reported first-quarter results on the 2nd of May with an EPS growth of 6.7% over the year to $1.11 per share. Group revenue grew by $2.4 million over the year to $238.9 million, with same-store sales growing by 0.2%.
Chairman and CEO Clarence Smith provided commentary on the result that highlighted a return of increased demand around special shopping holiday events but saw declines in in-store traffic in March. Smith noted on the result, “We believe discretionary consumer spending has been adversely impacted by rising inflation, including fuel costs, market volatility, and geopolitical concerns.” Looking ahead, Smith remains confident in meeting near-term challenges and progressing on the company’s long-term goals.
Haverty has been a beneficiary of increased spend over the pandemic as a function of lower interest rates and higher government stimulus measures.
When researching further on the Fintel platform, we noticed HVT has a Short Squeeze Score of 84.28, which places it in the top 8% of 5,500 included companies. The Short Squeeze Score results from a sophisticated, multi-factor quantitative model that identifies companies with the highest risk of experiencing a short squeeze. The scoring model uses a combination of short interest, float, short borrow fee rates, and other metrics. The number ranges from 0 to 100, with higher numbers indicating a higher risk of a short squeeze relative to its peers and 50 being the average.
Analyst Commentary
We note coverage from Sidoti & Co that currently has a ‘buy’ rating on the stock with a bullish target price of $25.75. Analyst Anthony Lebiedzinski expects the firm’s free cash flow to remain in great shape but marginally reduced 2022/23 estimates on the back of the inflationary commentary. Lebiedzinski expects a significant free cash flow step-up in 2023 that could be used to increase regular dividends, pay more special dividends or for more share buybacks.
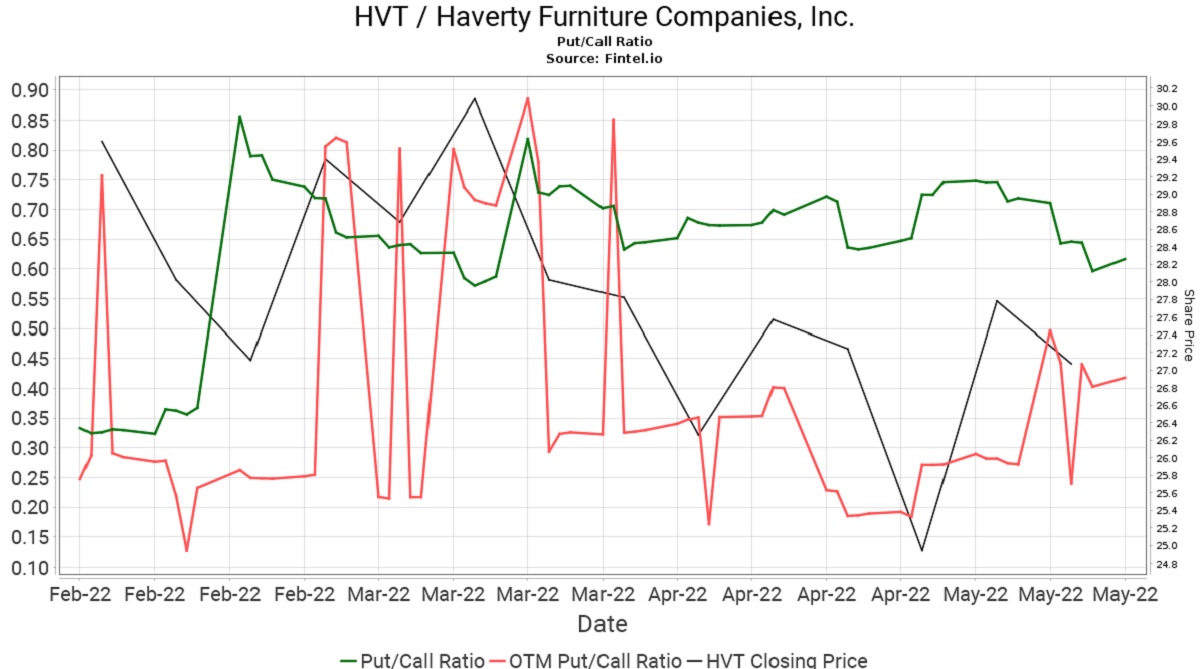
We had a look at the put/call ratio for HVT to determine market sentiment from options data at these levels. The stock has a score of 0.62, indicating there is underlying bullish sentiment for the stock in the options market. The Put/Call Ratio shows the total number of disclosed open put option positions divided by the number of open call options. Since puts are generally a bearish bet and calls are a bullish bet, put/call ratios greater than 1 indicate a bearish sentiment, and ratios less than one indicate a bullish sentiment. We a chart of this ratio and how it has behaved over the last three months:
More On Dividend Leaderboard
The primary ranking factors are dividend yield and dividend growth. Since dividends are paid out of incoming cash, we provide the Cash from Operations (CFOP) Payout Ratio, simply the portion of cash from operations used to pay the dividends ( dividends paid / cash from operations). Companies with a negative CFOP Payout Ratio or a CFOP Payout Ratio greater than one did not make enough cash from their operations in the trailing twelve months to pay the declared dividend, which could indicate that the company’s ability to pay future dividends is at risk, so we filter these companies from this list.
Article by Ben Ward, Fintel
Updated on
Sign up for ValueWalk’s free newsletter here.


