 Nasdaq 12,000.
If you recall, Nasdaq 5,000 was a big deal in 1999 and then we crashed and didn't get back there until late 2016, when Trump was elected and tax-free fever was sweeping the land. Our National Debt was $18.15Tn at the time but 4 years later, the debt was up to $27.75Tn and the Nasdaq was at 11,500 in the fall of 2020 – as we waved goodbye to President Trump (well, more like dragged him out in January). Losing Trump didn't stop the Nasdaq, it kept climbing all the way to 16,600 in December of 2021 – up another 6,100 points in just a year.
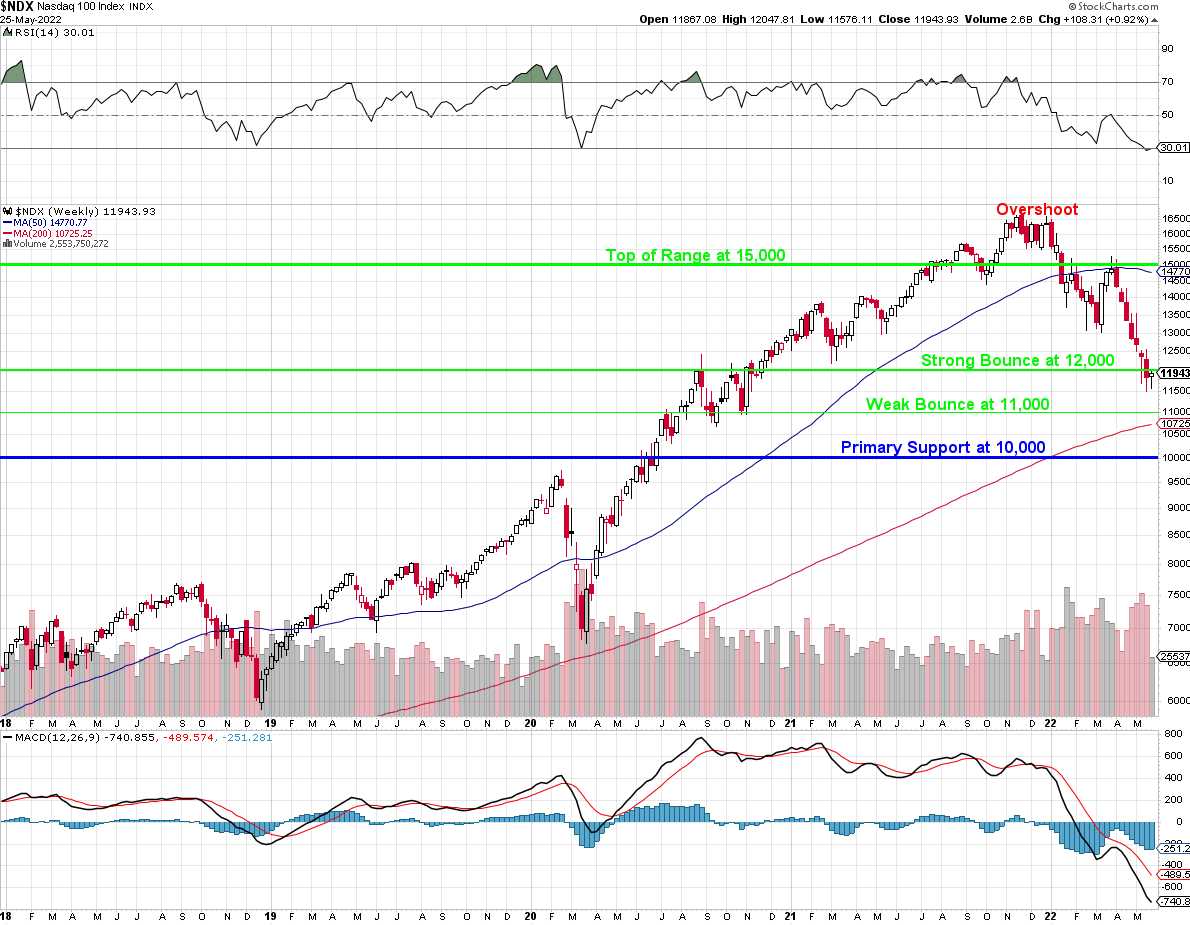
Yet, somehow, people didn't think that was riduculous and unsustainable. What could those companies have done to justify a 50% pop in valuation in 24 months, let along the 120% pop of the previous 4 years? Noting is the correct answer, as it turns out and now we are back to 12,000, which is still 20% above 10,000 – which is the next real support line.
 Were the companies in the Nasdaq 100 making 100% more than they were in 2016? That's how we would have justified 10,000. At 15,000, they would have had to make 200% more than they did in 2016 but noooooooooooo!, they were making the same or LESS for the most part and only the earnings multiples had changed. That's why there's this massive general collapse of the index – it has nothing to do with whether or not the companies are hitting their earnings but what multiple people are willing to apply to those earnings and that's based on forward expectations and those have been dropping off considerably.
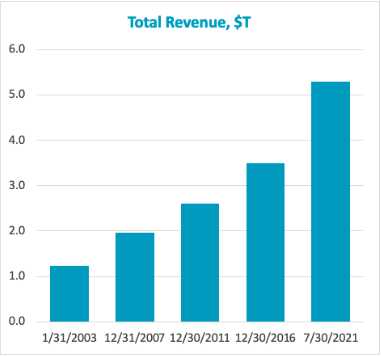
The chart on the left is for the entire Nasdaq Composite, not just the 100 but it includes them and, as you can see, Revenues were up about 50% since 2016 so profits certainly were not up 200% – MAYBE 100% and there was no realistic way we were going to get to 200% – even without Covid, Deficits, Global Warming, Supply Chain Disruptions, Labor Shortages, Commoditiy Shortages, Inflation and War.
Once investors started to recoginize these things were not "transitory", they began to factor them into their forward earnings expection and PRESTO! – the market crashes as everything is re-valuated. This is not the type of thing we bounce back from – 15,000 was a MISTAKE – next time, we have to earn it!
 We HOPE (not a valid investing strategy) that the Nasdaq manages to stay in the top of it's range, above the strong bounce line at 12,000 but it's being rejected so far and every day it spends below 12,000, it pulls that 50-week moving average 60 points lower, which is a very sharp decline. That is going to make the technical people nervous and, since over 90% of traders are technical traders (because fundamentals are hard work), we will be screwed.
If you are going to insist on playing with charts, at least take the time to understand WHY they are drawn – as opposed to wondering WHAT they mean. They don't mean anything other than a visual representation of things that already happened. Drawing a stock chart is no different than drawing a chart of a bird flying – there's almost zero chance you can predict it's short-term movements but, over a very long time, you can begin to see certain predictable patterns emerge.
More importantly, however, is understanding WHY a chart is drawn the way it is because, if you understand the effect the market has on how the chart WILL be drawn – you will have leapfrogged ahead of 90% of your fellow traders. In the case of the Nasdaq, very simply, we are now 3,000 points below the 50-week moving average at 14,770. That means, each week we are below 12,000, the 50 wma gets dragged down 12,000/50 = 60 points.
When the 50 wma was going up, the Nasdaq was about 2,000 points above it so 3,000 points below it – if this persists – means the angle at which the 50 wma will drop will be 50% sharper than the angle at which it rose and THAT will make a very ugly chart. HOWEVER, the 200 wma is way down at 10,725 so we're still raising that bar at a rate of 1,250/200 = 6.25 points per week. This is where we use that 2 train math from 7th grade – If the 200 wma is rising at 6.25 per week and the 50 wma is falling at a rate of 60 points per week and they are 4,000 points apart – when will they intersect?
 The answer is July 25th, 2023 if the Nasdaq stays this low and they will cross at 11,100 so, as long as the Nasdaq stays over 1,200, the rate of descent for the 50 wma will slow down towards the end – hopefully enough that it will bounce off the 200 dma and avoid the death crosss but, for that to happen, the Nasdaq needs to stay over 12,000 – othewise we're screwed next August.
See how easy that is. Now we know what's going to happen through next Summer!
That's what our Strong and Weak Bounce Lines keep track of – it helps us differentiate a recovery from "just a bounce" so we can manage our hedges accordingly. As I told our Members, as long as we're over the Strong Bounce Line at 12,000, we're going to lean a little bullish and hope (not a valid strategy) that the Nasdaq finds support and can get back into the upper end of the 10,000-15,000 range but it was bad news from NVDA last night as they lowered their forward guidance – we can't keep having those…
On the brigther side, DLTR and DG did well, as we expected but so did M (old favorite) and WSM and LULU and, BIDU pulled out nice earnings as well – so hope is not lost.
8:30 Update: All hope is lost as Q1 GDP came in at -1.5%, down from -1.4% in the first estimate and going the opposite way of the -1.3% expected by our leading Economorons. On top of that, Q1 Corporate Profits fell $66.4Bn to $3.2Tn – that's a 2% drop as reported in Q1 vs Q4 but up 12% from last year, when the Nasdaq was at 13,000 and the S&P was 4,000.
So again, we HOPE the Nasdaq is a little low and the S&P is bottoming at 4K. We NEED to see that index hold 4,000 to be comfortably bullish, as well as Russell 1,800 and Dow 32,250. All looks good this morning EXCEPT the Nasdaq – we'll see what the day brings.


