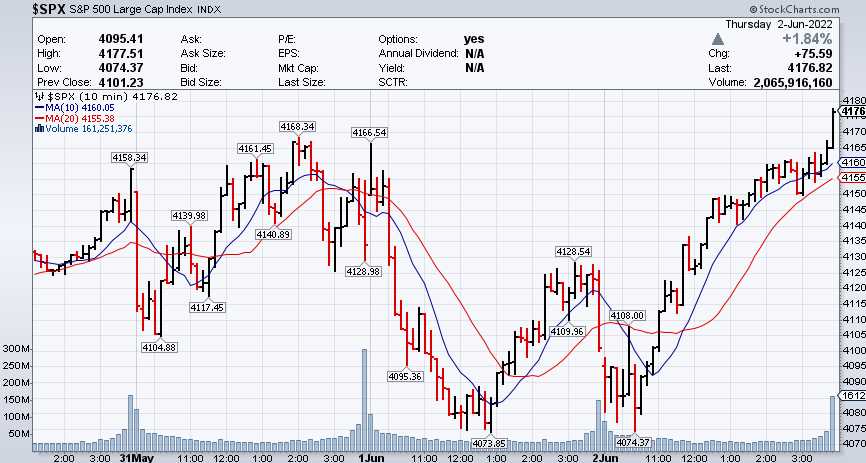
 4,132.
That's where we started the week so all we have to do is not drop 40 points on the S&P today and, AT LEAST, we can claim a positive week – short and low-volume though it may have been. 4,160 is, of course, our weak bounce line for the S&P and failing to hold that for the week will be BAD – but I'd settle for a week that's not down at this point.
It's a wild-card as we have Non-Farm Payroll at 8:30 this morning and other reports we've seen indicates the Economy is slowing so probably less jobs are being created. It was 428,000 last time and slowing from that pace would actually be good but below 200,000 might be scary – 300,000 would be the sweet spot. From the Productivity Report yesterday, it seems labor costs are rising fast and, if NFP confirms that – it could spook people out of stocks ahead of the inevitable margin squeeze that comes from rising labor costs.

Even as I write this (7:30 am), the S&P is back at 4,147 – dangerously below the Weak Bounce line (see yesterday's chart). In fact, as a refresher, it's been a while since we posted the Bounce Chart so let's remind ourselves how dire our situation has been this past month:
- Dow 36,000 to 28,800 would be a 7,200-point drop with 1,440 bounces to 30,240 (weak) and 31,680 (strong).
- S&P 4,800 is 20% above 4,000 and that makes it an 800-point drop with 160-point bounces so 4,160 (weak) and 4,320 (strong).
- Nasdaq is using 13,500 as the base. 14,100 is the weak bounce and 14,700 is strong.
- Russell 1,600, would be about an 800-point drop with 160-point bounces to 1,760 (weak) and 1,920 (strong)
That's a lot of red and the Dow doesn't count for much as it's an idiotic, price-weighted index and, keep in mind, these are our 20% retracement lines – except the Russell, which is a 33% retracement – as it blew through 20% (1,920) early on, so we lowered our expectations (and we expected small caps to be more adversely affected by the macro conditions).
   
|
Notice the Russell held up right about 1,760 and that was a good bottoming sign – as long as it goes on to retake 1,920 and hold that, which still remains to be seen. Like the S&P, the Russell is being rejected right at the Bounce Line and the Nasdaq is languishing below the 20% line – there's no recovery at all if we can't take 13,500 back over there.
11,500 on the Nasdaq was a 30% drop from 16,500 and THAT is going to give you 1,000-point bounces to 12,500 and 13,500 so now 13,500 is the -20% base AND the strong bounce line for the overall correction – that's going to be VERY SIGNIFICANT – if we can actually get back to it. My overriding premise is that all this is a CORRECTION, not a pullback, and that means that these levels are about where we'll stay for the rest of the year.
That's why the bulk of our adjustments are to improve our strike positions – as we don't expect the stocks to get back to their old valuations – which we always considered extreme. Just yesterday, in our Live Member Chat Room, we adjusted Facebook (FB), Target (TGT) and Netflix (NFLX) in our Long-Term Portfolio (LTP) to reflect more aggressive positions from what we hope is a firm bottom.
 Still, we only used 10% of our CASH!!! and our LTP is 75% CASH!!! and very, very well-hedged as we still don't see the kind of strength we'd like in this "recovery." And that's what our Bounce Charts are all about – they remind us of what a real recovery SHOULD be and that keeps us from throwing money away chasing a bounce.
8:30 Update: 390,000 is still running too hot on jobs so, what sounds like good news is not as it means the Fed still has a lot of rate-raising work to do in order to cool off the economy. Wage inflation – from the Fed's point of view – is the worst kind of inflation and we are seriously running out of workers in this economy.
That forces employers to offer higher wages to fill jobs (we saw that yesterday in the Productivity Report) and then those costs get passed on and then the workers demand higher wages so they can afford the costs that are being passed on, etc. Once this cycle starts feeding on itself – it can take years to burn out…
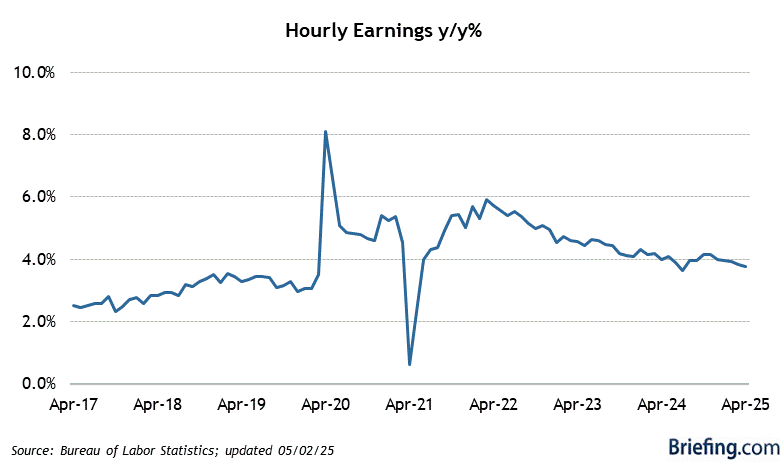
At the moment, year/year wage gains are 5.4%, down from a peak 6.1% in January so perhaps some progress is being made as the Productivity Report was from Q1 and here we are in the last month of Q2 and 5.4% is from the 2nd month of Q2 so MAYBE Fed policy is working or maybe it's just a fluctuation – we'll have to wait and see.
Have a great weekend,
– Phil


