 Told you so!
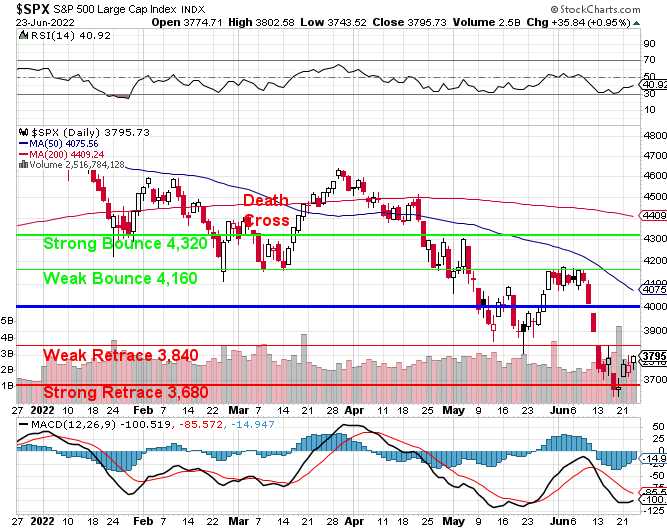
Last Friday we told you there would be a 2% bounce – back to 3,780 on the S&P 500 and we closed yesterday at 3,790 so mission accomplished and now we're testing our also-foretold 3,840 Line and, as I noted yesterday, that's going to be our stop on the way to 4,000 next week.
Once again, this is not a recovery though, 4,000 is the middle of our expected range on the S&P 500 and we HOPE (not a valid investing strategy) that we stay in the top of that range, up towards the Strong Bounce line at 4,320 – because only that is going to prevent the 50-day moving average (now 4,087) from falling below 4,000 about a month from now. Once that happens, you will WISH (also not a valid strategy) that we can get back to 4,000.

We have a nice tailwind next week from that rising MACD line so let's not waste it. It's going to be a low-volume, pre-holiday week and, if all goes as expected, we'll probably be adding more hedges next Friday but I think our portfolio balance is good going into the weekend with both the Long-Term and Short-Term Portfolio already ahead of our June 15th review.
Knowing what the market is going to do next let us buy with confidence in the past two weeks and it's been very, very busy for our Members as we added GOOGL, LOVE, IBM, CIM, LEVI, F, TROX and BBY to our Top Trade Alerts this month alone. In our Live Member Chat Room, we added many more longs to our portfolios – taking advantage of the opportunities that presented themselves – and that's why we're going to want more hedges next week – we have a lot more to protect!
Also, just like we expected the 3,680 line to hold on the S&P, we expect the 4,000 line to be rejected – at least on the first attempt and that's why we keep our hedges in the Short-Term Portfolio – where we can take advantage of these short-term moves. It's also nice that our 5% Rule™ lets us see what's coming so far in advance – it helps a lot with our planning. And remember: The 5% Rule™ is not TA, it's just math!
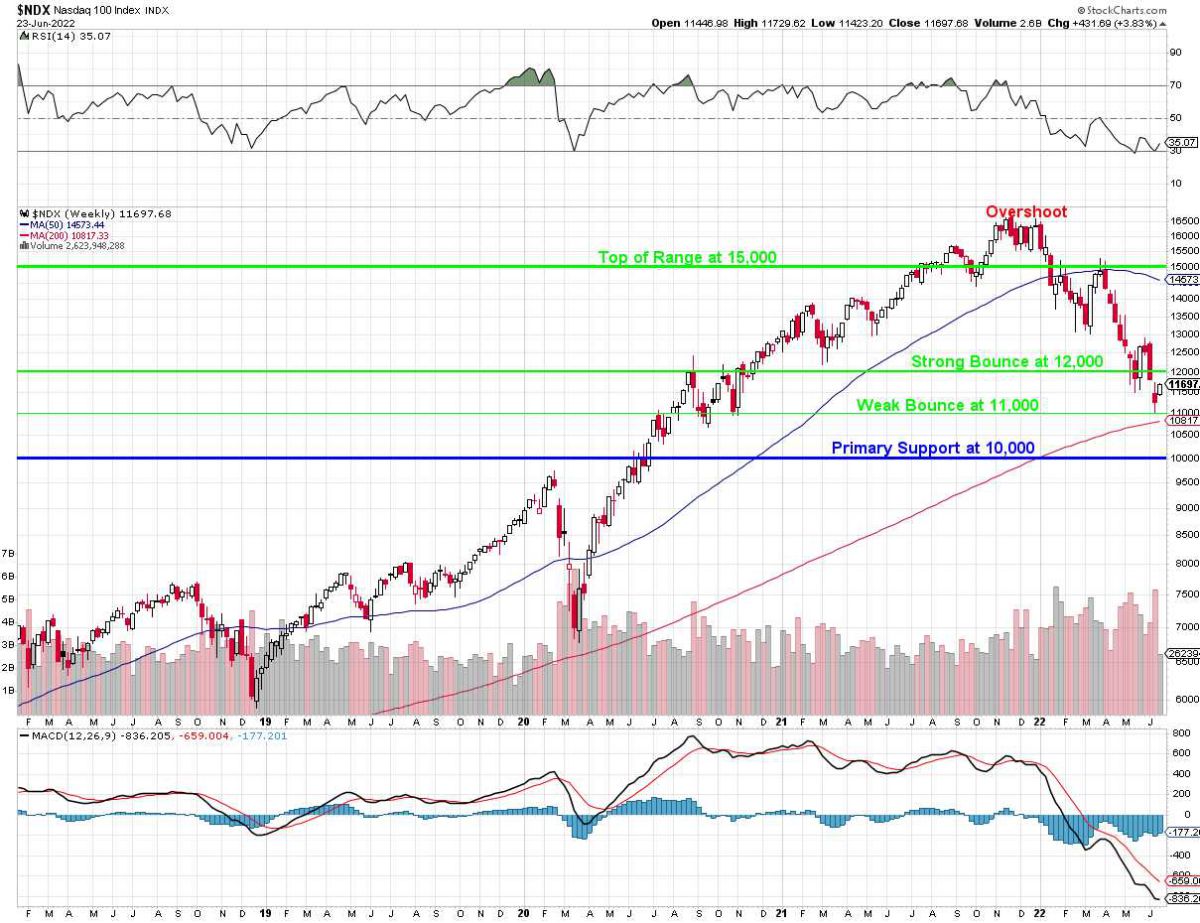
That's how, on May 20th at 1:18 pm, I was able to draw this Nasdaq Chart and say to our Members:
Looks like 11,200 should be good support but we may have to wait for the 50-MONTH moving average to catch up before we can make any meaningful gains.

And here's where we are on the weekly (not monthly) Nasdaq Chart today:

As you can see we did, in fact, bottom out right about 11,200 in the 2nd week of June and that signaled us to get more bullish in the Short-Term Portfolio and now it's up $300,000 (33%) since the dip began – more than covering the losses in the Long-Term Portfolio, which we happened to also review on May 20th. Back then the LTP was over 100% CASH!!! – because why not when we knew the market was still heading lower but, as noted above, we've put about 20% of that cash to work, buying new positions and improving our existing ones.
I went over the macro situation in Phil’s Stock World’s Live Weekly Webinar, you can share that with your friends and family, who will be very sorry they asked the question "What do you think is going on with the economy and the markets?" after 2 hours of listening!
Hopefully nothing gets worse over the weekend (but really, how could it?) and we drift up to our target next week, which will be low-volume into the July 4th weekend but then no more 3-day weekends until the end of August – that makes me sad….
One thing that got better is the Senate actually passed a Gun Control bill, with over a dozen Republicans voting with the Democrats. This is the first gun law that's passed in decades – hopefully it won't be the last.
Have a great weekend,
– Phil


