 Are we making a small or big “W”?
Charts love to form “W” patterns, which are merely the results of bounce patterns testing various levels over time but let’s not get all technical about it and pretend that the chart itself has meaning. For those of you who confuse causality with correlation – thinking the lines on a chart tell you about the underlying market forces that form them is like thinking the lines on a map tell you all there is to know about Techtonics.
Nonetheless, people love charts so here’s the S&P 500 chart with our 5% Rule™ applied and PLEASE, remember, the 5% Rule™ is not TA – it’s just math!

These lines were determined a year ago for the movement we expected for the market in 2022. That was when the S&P was at 4,800 – we were that bearish at the time. No one listened to us then and no one listened to us for the past month as we’ve been saying we’re oversold but now we have the FACTS of Earnings Season to add to our Fundamentals and we’ll see if they are good enough to get us back to our baseline of 4,000 – or if we are condemned to spend the rest of the year in the Retrace Zone.
First of all, the drop from 4,320 (our Strong Bounce Line) to 3,680 (our Strong Retrace Line) is 640 points. We ignore the spike below the line as it didn’t really stick and we’re giving it a pass also because the Dollar was very strong and pushed things lower at the same time the Fed (and all the other talking heads) were scaring the crap out of investors. Frankly, if that’s all they’ve got – we’re in good shape.
 So a 640-point drop gives us 128-point bounces off the 3,680 line (and it also determines that 3,552 is the 20% overshoot line) so a weak bounce off this drop would be 3,808 – which happens to be EXACTLY where the middle of the “W” formed in early October (and kudos to the caterpillar for executing a perfect Spitting Cobra pattern!).
It’s possible we once again fail at the Weak Bounce line (or lower) and that will be a sign that we may be breaking lower and we’ll have to draw a very depressing chart for 2023 (and probably cash out for the duration) but, hopefully, we can break over that line and head another 128 points higher to the short-term Strong Bounce line at 3,936, which would be (Ta Da!) the bigger “W” that began as we broke down EXACTLY there in mid-September.
That would also take us back over the 50 dma and begin to repair the Technicals but nothing will save us from a Death Cross by Christmas so cashing out appears to be in our future either way.
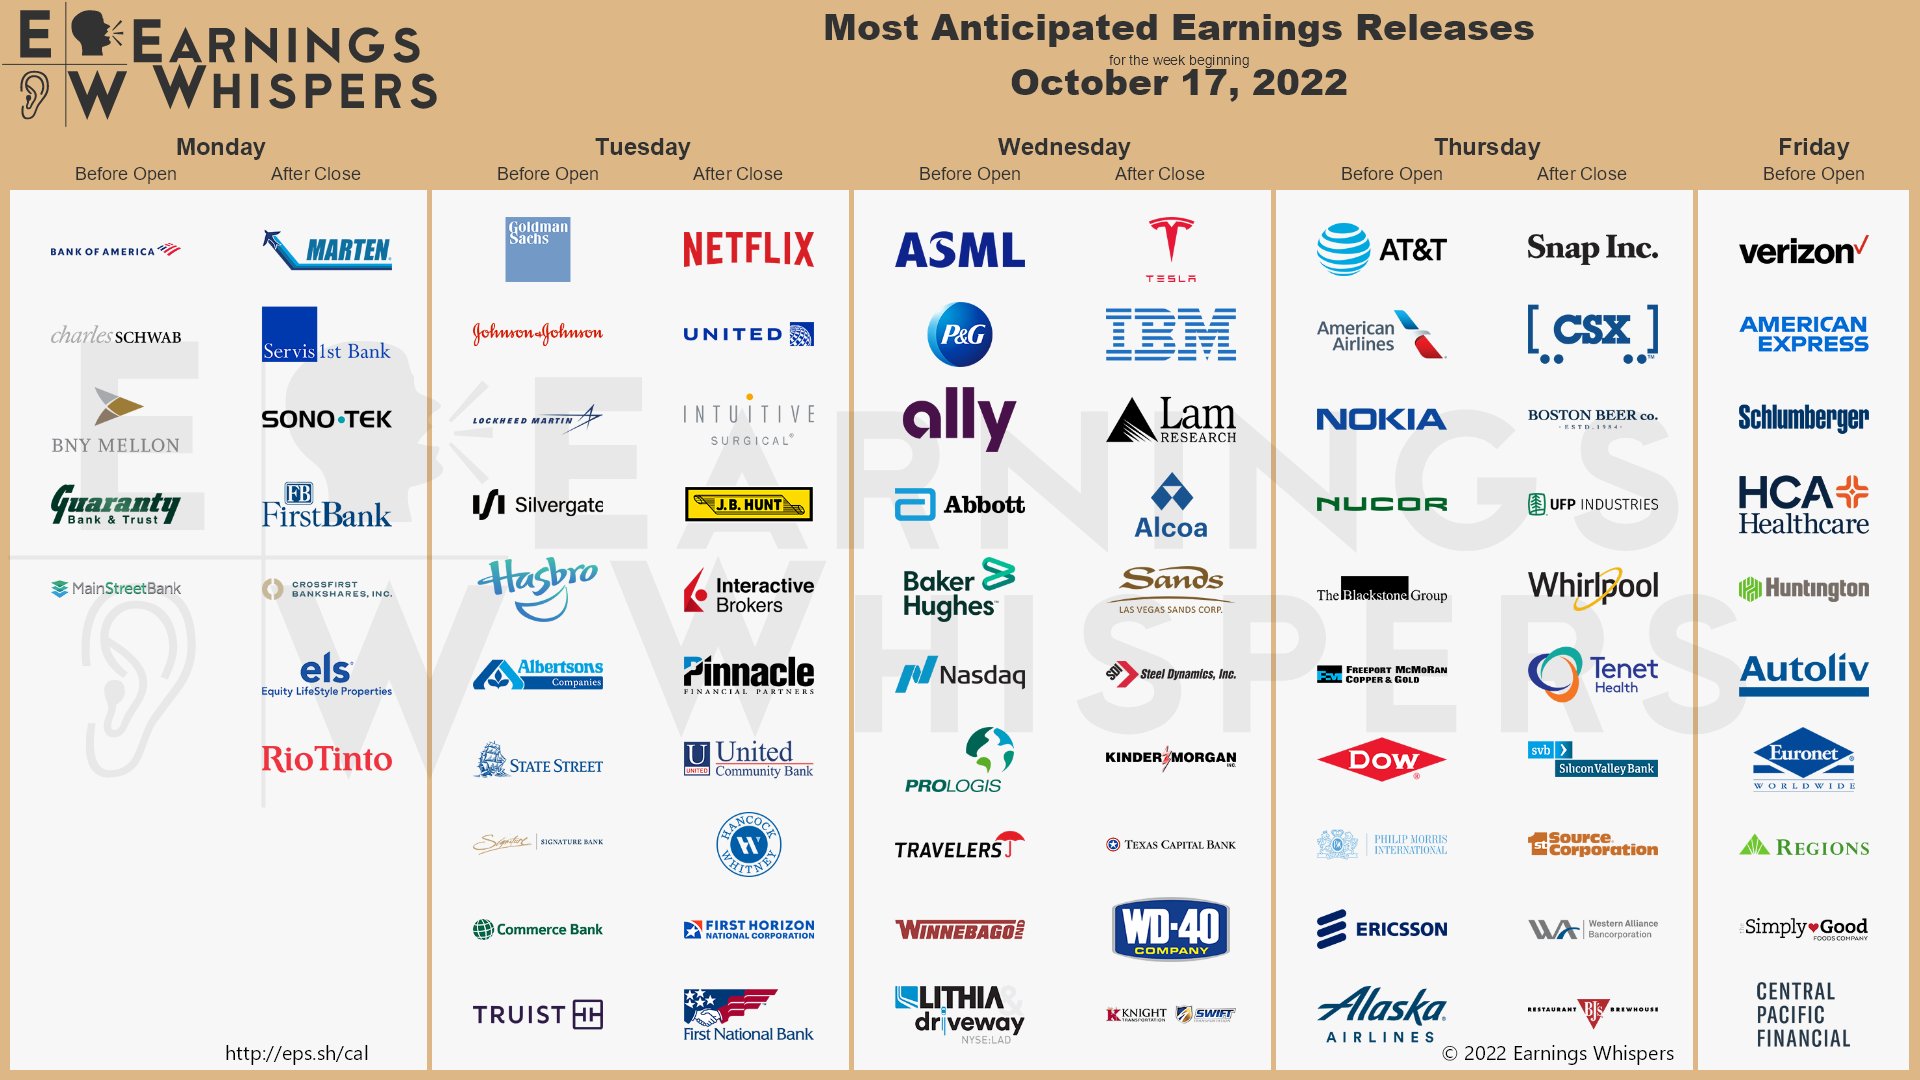
Still, for us to have to drop our True Valuation line (S&P 4,000), we’d have to see more evidence of a Recession and we went over why that’s not happening yet the other day. Right now, the market is pulling back in fear of earnings and we have some heavy hitters reporting:
Let’s talk about a few:
-
- P&G – Anyone getting a lot of revenue from overseas is getting it in weak currencies that exchange unfavorably with Dollars so Revenues may look lower priced in Dollars (impacting Earnings as well). Still, PG is priced fairly and should be able to weather the storm.
- BHI – How could they not be having a great time?
- TRV – Depends how much hurricane, etc damage they had to pay off but they don’t do life insurance (expectancy dropped 5% during Covid), so I like them.
- WGO – We have THO and they have supply chain issues but they are improving and should be for WGO as well.
No currency issues for the above companies.
-
- TSLA – Only about 40 times current earnings now is a relative bargain. Now that they are actually making money, you have to assume the growth will continue so I wouldn’t bet against them but it’s not a stock I want.
- IBM – Our Stock of the Year was bought last November at $115 and now it’s $122 but we played it to hold $115 and made a fortune (cashed out some early at $140 but have new positions too). With options, stocks don’t have to go up to pay you well and we were very sure $115 would hold. A lot of International Revenues is a currency concern.
-
- AA – Here’s where we could have currency issues.
- LVS – Macau still barely open so probably a loss this Q and no way they can project when it will end.
My oh my – not an uptrending channel in sight…
That’s the thing though – a house of horrors is already priced in for October and it won’t take much to pop these suckers right over resistance. There is almost nothing but negative news and we have been reviewing our portfolios and we’re VERY happy with our longs – BUT – if people begin to panic, they will take our good stocks down along with the bad and we’re too worried to make a profit with our portfolios treading water this quarter so, if Earnings can’t improve Sentiment – we may have to cash in and wait for Q1 to start buying again.
Be careful out there!


