And we’re back:

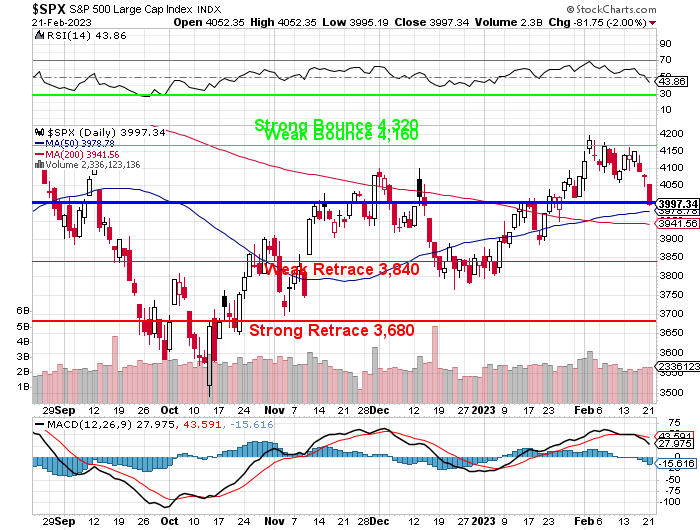
We first crossed the 4,000 line on the S&P 500 in March of 2021, on the heels of Trillions of Dollars in Stimulation. We topped out at 4,818 to start off 2022 and we failed 4,000 that May for the first time. Now we’re testing it from above and we SHOULD get a bounce which, coming from 4,200, should be 40 points (20% of the drop) for a weak bounce at 4,040 and a strong bounce at 4,080. Failing the weak bounce line indicates we’re consolidating for a move below the 4,000 line.
The 5% Rule™ is not TA, it’s just math and, once we do that math, we move back to Fundamentals like – will the newsflow exert a positive or negative influence on the index over the next few days? As noted yesterday, we have the PMI this morning at 9:45 but that’s a survey, not data. We get Existing Home Sales at 10 and we know they’ll be weak.
Tomorrow we have Mortgage Applications, Investor Confidence and then, at 2pm, the Fed Minutes from the last meeting – not the best combination as it’s starting to hit people that the Fed isn’t really as doveish as they thought.
Thursday gets more interesting with GDP, the Chicago and KC Fed Reports and Oil Inventories and Friday lays it on thick with Personal Income and Outlays, New Home Sales and Consumer Sentiment. That set of data is so scary, they had to schedule Mester (dove) to speak at 10:15 to spin it into the weekend.

As you can see, earnings are improving a bit with more than half beating yesterday but one day does not a trend make and 21 lowered guidences does not inspire a load of confidence. Meanwhile, New Zealand just raised their rates 0.5%, to 4.25% and aiming for 5.5%, which is now what is expected of the Fed as well (currently 4.75%). It’s not much (NZ being a small currency) but it nudged the Dollar lower and gave the indexes a chance to catch their breath this morning.
The headline in MarketWatch this morning is: “Financial markets wake up to outside risk of almost 6% fed-funds rate by July.” That’s right – it’s my exact target with my exact timing – from a year ago (see November’s: “Federally F’d Thursday – Thanks A Lot Jerry!“, for example).
While it would be nice to pull back 10% and test the Strong Retrace line again, we’re not counting on it and we have been looking for some new buying opportunities – just in case the market holds up better than we thought against probably 3 more rate hikes to at least 5.5% over the next few months.
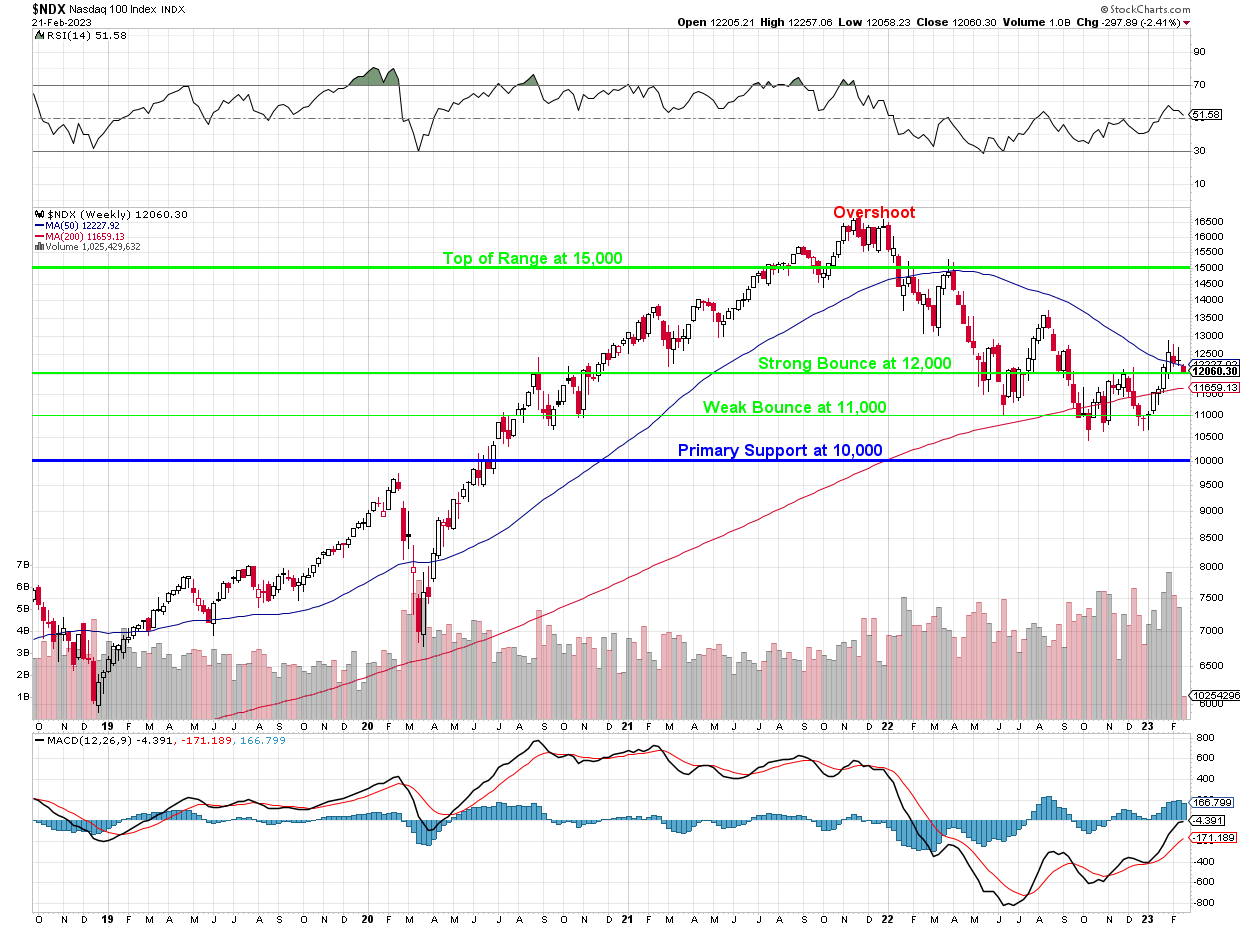
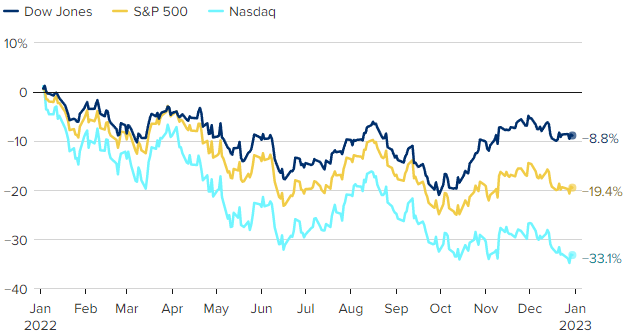
5.5% is dangerous to the markets because the S&P fell 19.4% in 2022 and the Nasdaq fell 33.1% while the Dow was the hero at -8.8%. This year we’re up 100 points from 3,850 (3.8%) but if we don’t do better than this and the bond market starts paying 6% – who can blame money if it starts moving out of indexes and back into bonds?

Let’s imagine you start with $100,000 and make market returns 9 out of 10 years of 8% and have one year that’s down 20% – in year 7, how would that look year by year?
Year 1: $108,000, 2: $116,640, 3: $125,971, 4: $136,045, 5: $146,914, 6: $158,635, 7: $126,908, 8: $137,074, 9: $148,201, Year 10: $160,380. Now, I’m not going to write it all out but, if you simply make 6% EVERY year for 10 years, that comes out to $179,113 – over 10% more. THAT is why this rate range is so critical – the average investor (not us!) is better off just putting their money in a 10-year bond!
This is why I love to hedge. The trick is not to lose money because one single mistake can ruin 9 victories. This is why our Butterfly Portfolio tends to outperform in most years – we sell so much premium we almost never lose and, over time, it’s a winning formula.
And that is why, despite having 100 names on our Watch List, we are still being cautious. We have great positions in well-balanced portfolios already – it doesn’t make any sense to start taking chances until we get a clear picture of where the market is going to settle down.
Be careful out there!
And, for the time-crunched, here’ is OpenAI’s summary of the above:
“The article discusses the current state of the S&P 500, noting that it first crossed the 4,000 line in March 2021 and hit a high of 4,818 in early 2022 before dropping below 4,000 in May 2022. The author believes that the index should see a bounce if it tests the 4,000 line from above, but failing to reach the weak bounce line at 4,040 would indicate consolidation before a further drop.
“The article then discusses upcoming economic data releases and notes that earnings are improving slightly, although there are still lowered guidances. The author mentions that New Zealand recently raised its interest rates, which may impact the US markets, and points out that a rate hike to 5.5% (the expected target of the Fed) could be dangerous for the markets.
“Finally, the author provides a comparison of investment returns over 10 years, with a hypothetical scenario of 9 years of 8% returns and one year of a 20% drop versus a consistent 6% return every year. The latter scenario results in higher returns, highlighting the importance of interest rates. The author concludes by discussing the benefits of hedging and being cautious in the current market.“
This is, by far, the most exciting piece of tech since the iPhone!


