140 (28%) of the S&P 500 Report this week.
Another 98 the first week of May and all downhill from there with the rest dribbling in (and about 100 have already reported). So this is it – put on your analysts hats and pay attention as we’re going to have to determine where we’ll be putting our money for the second half of 2023 (already).
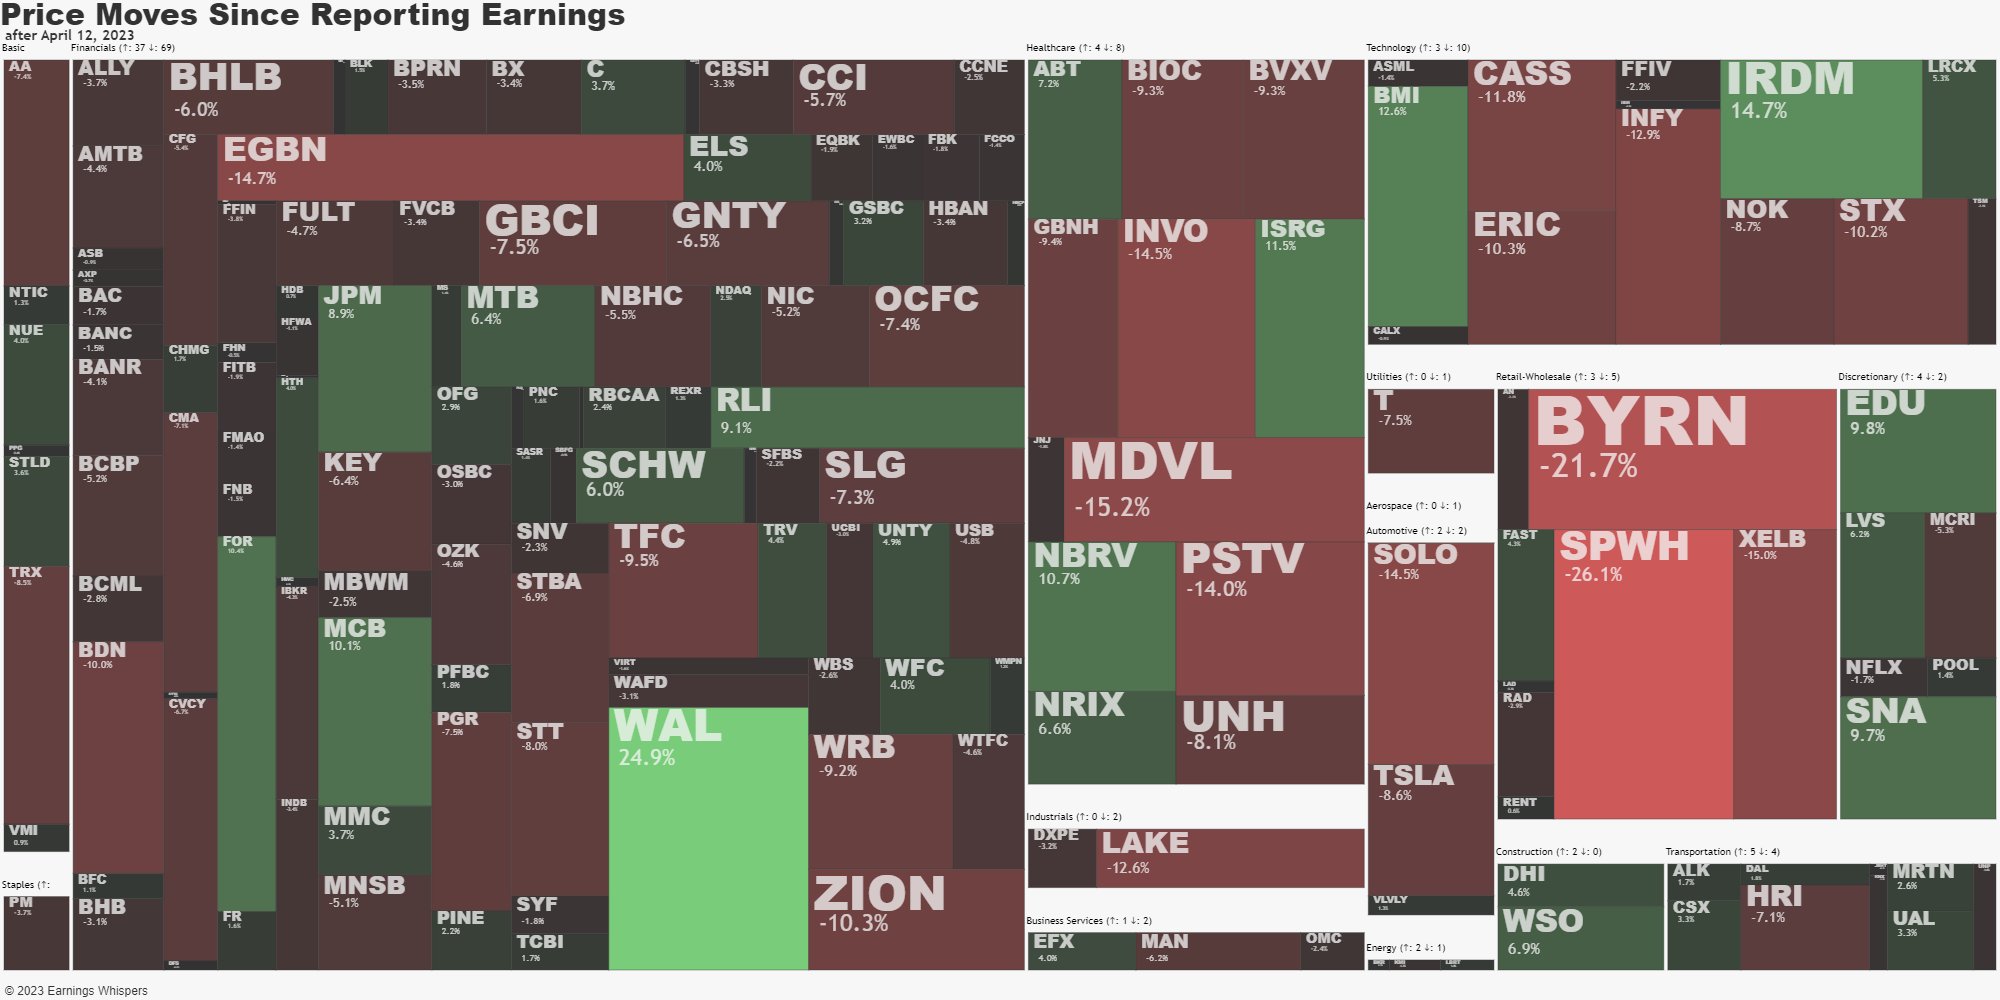
Above is a map of how companies have performed since their recent earnings reports and generally the answer is “badly.” That’s what we call a “trend” and it’s one of the reasons we decided to move to the sidelines this week. We’re certainly not missing anything – look at all the stuff that’s going on sale… We bought JPM, C and ISRG before they popped and we certainly didn’t miss anything exciting – nor do we find the large number of stocks that are on sale particularly exciting – so we wait – patiently.
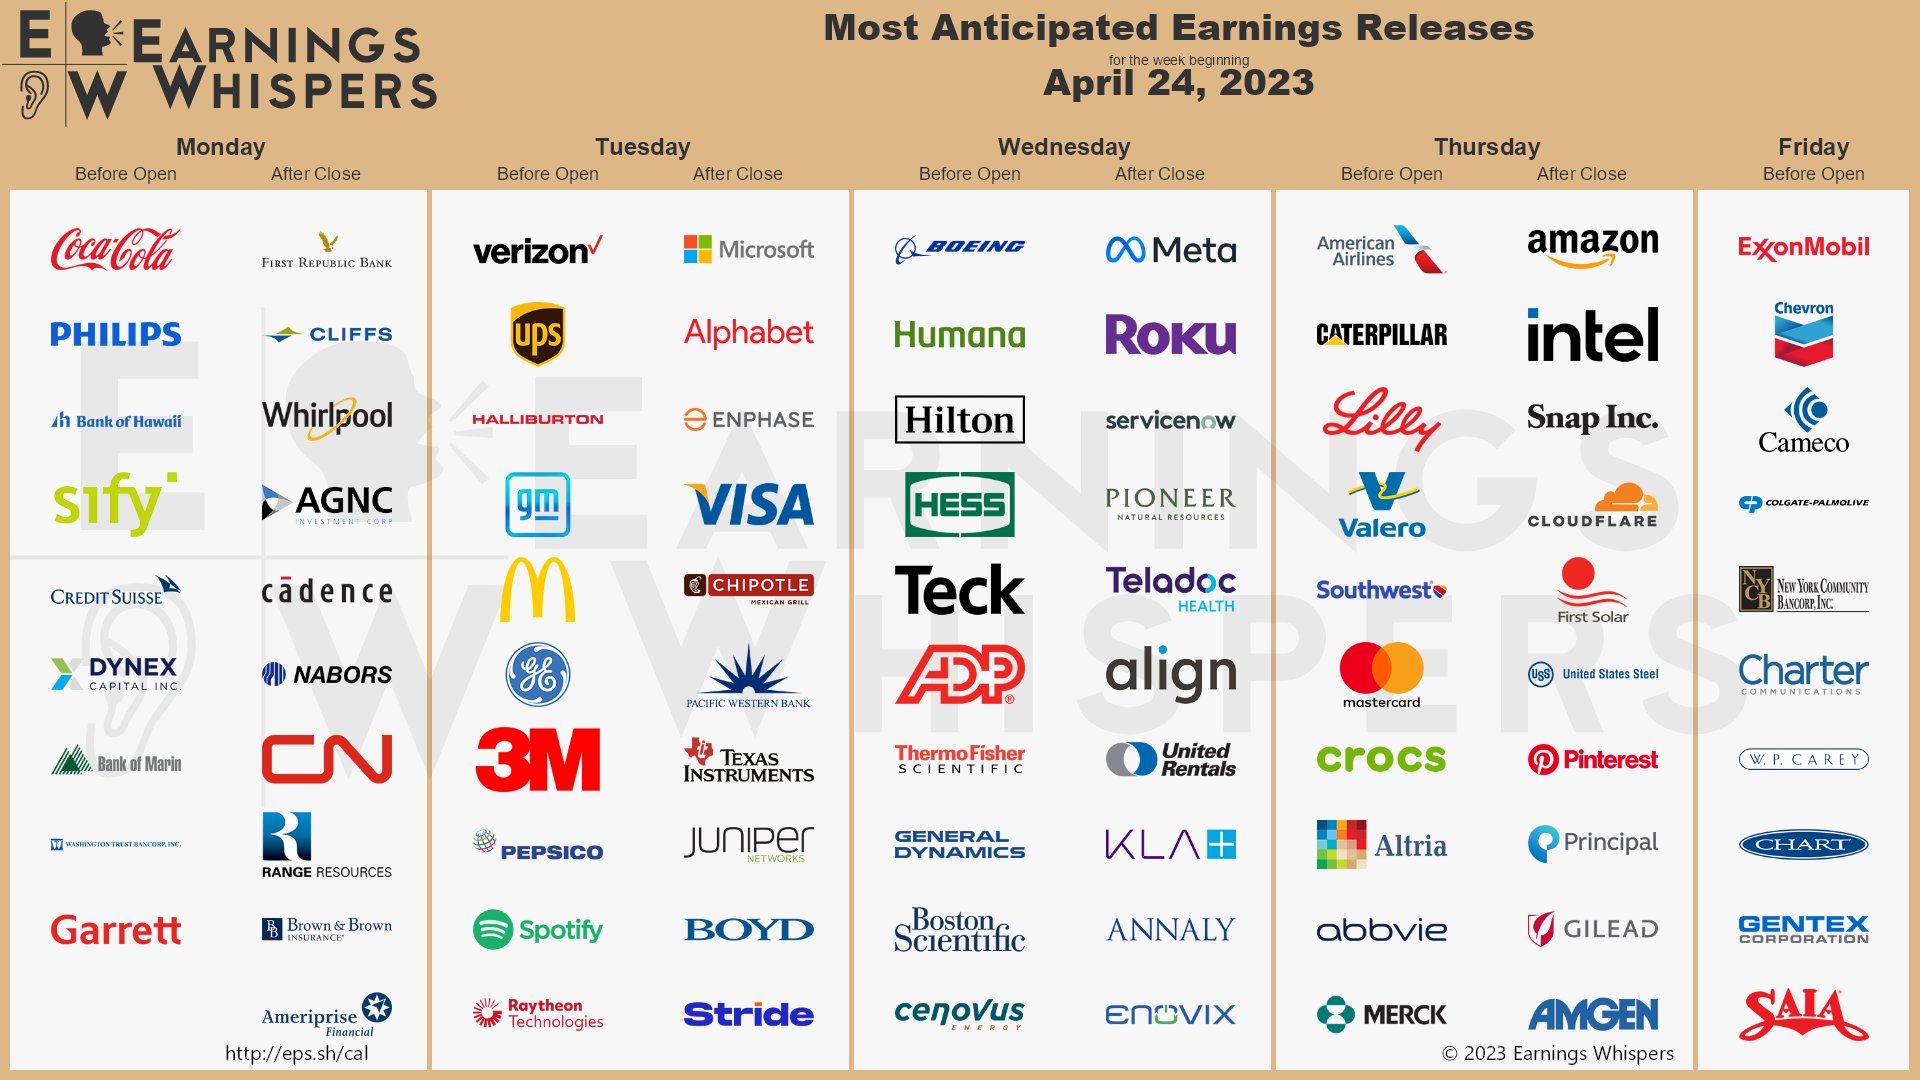
This week we have all kinds of great companies we’d love to own at lower prices – as long as we don’t feel we agree with why others may be selling them off – which happens so often we have an entire Member’s Portfolio dedicated to it:
You know how a picture is worth 1,000 words? Well here’s why Coke (KO) is a great stock to own in troubled times:
What else do you generally expect to have at your fingertips ANYWHERE on the planet Earth? That’s because KO doesn’t sell snacks or even merchandise – they sell drinks and they sell them everywhere to everyone. I interviewed KO’s ex-CEO Muhtar Kent back in 2010 and I don’t know James Quincey but not too much has changed in a dozen years.
The company has divested a lot of its bottling operations to concentrate more on the core concentrate production and brand-building. They’ve acquired all or part of Costa Coffee, Honest Tea, ZICO Coconut Water, Fairlife Milk, Topo Chico Hard Seltzer, and BodyArmor and launched Coca-Cola Energy, Coca-Cola Plus Coffee, Powerade Ultra and Powerade Power Water.
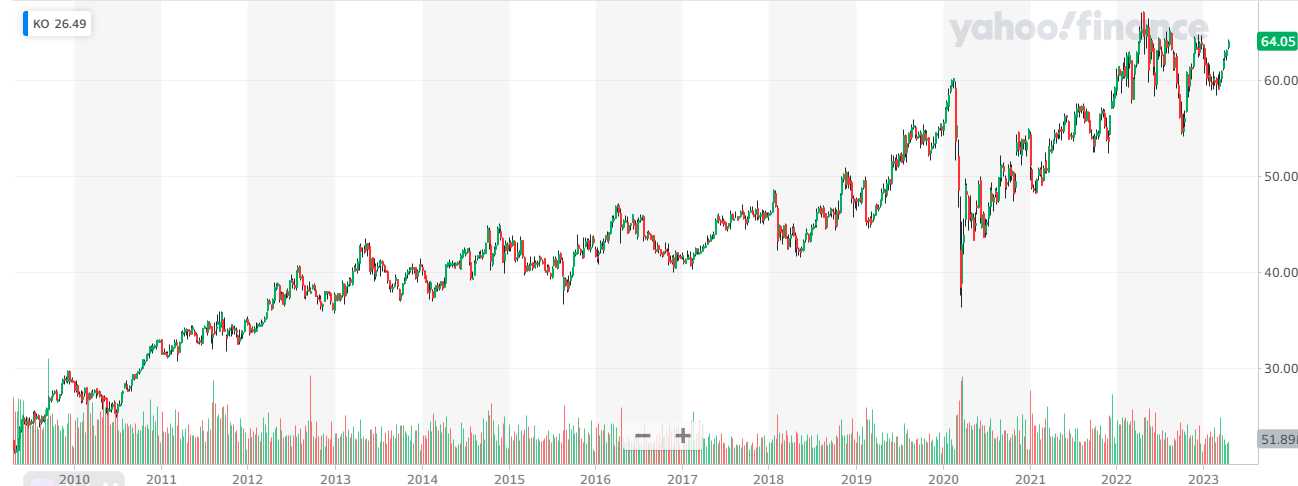
As you can see, the stock is up over 100% from $30 (there was a split in 2012) when I did that interview and in 2035 it will very likely be at $130 but the nice thing is it will be Despacito (slowly) and that makes it a fantastic stock for our Income Portfolio, which seeks to generate a 2% quarterly income from our holdings while still growing the principle.
KO pays a $1.84 dividend, which is about 3% of $64 but we can do better by NOT buying the stock and taking the following spread:
-
- Sell 5 KO 2025 $60 puts for $3.75 ($1,875)
- Buy 15 KO 2025 $60 calls for $9 ($13,500)
- Sell 10 KO 2025 $72.50 calls for $2.80 ($2,800)
- Sell 10 KO July $65 calls for $1.45 ($1,450)
That net $7,375 on the $18,750 spread that’s $6,000 in the money to start. The upside potential is $11,375 (154%) at $72.50 or higher and, if KO doesn’t leap higher (not likely) then we can collect $1,450 per quarter for 6 quarters while we wait and that’s $8,700 – more than we paid for the spread!
More importantly, it’s 19.66% back on our $7,375, which is miles over our 2% goal in a very conservative trade with a low chance of failure. The 5 short puts obligate us to buy 500 shares of KO at $60 ($30,000) but that only uses $3,746.43 of Portfolio Margin – so not worth worrying about. In an IRA account, simply don’t sell the short puts and pay $1,875 more for the spread – it still works out great.
Those are the kinds of trades we’ll be adding to our Income Portfolio. While we will have Portfolio Margin in that account we’ll still consider a trade like that to be using a $15,000 allocation, roughly 10% of our $150,000 total. So let’s say we have 10 of those positions and we’re netting $7,000 per quarter from our various activities. That’s going to be almost 20% per year in options sales alone. If, 2 years from now, KO is up 20% at $77, we will have doubled our money AND our quarterly returns should double as well.
You can see how quickly these things build up….
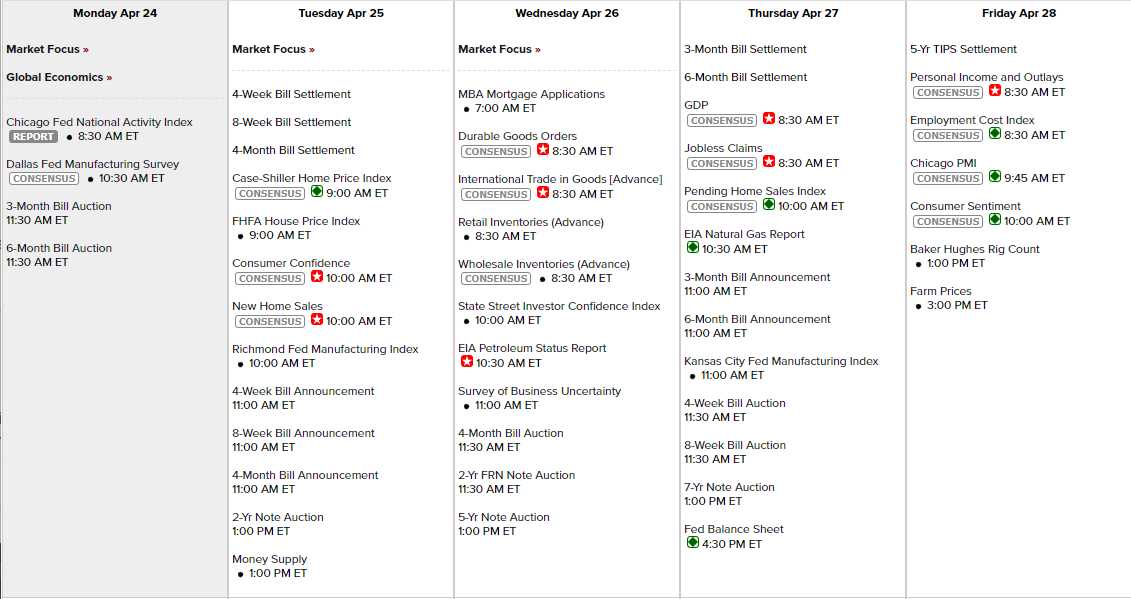
As long as the economy isn’t terrible, Blue-Chip stock investing is the way to go in these uncertain times. We’re still waiting to hear what the Fed has to say at their next meeting (May 3rd) and for now we’re watching the daily calendar, this week featuring the following Economic Data:
-
- ⊗April 25: Consumer confidence and new home sales are high-impact indicators that can reflect the strength or weakness of the economy and the housing market. Higher-than-expected readings can boost the market sentiment and vice versa. The FHFA and S&P home price indexes are low-impact indicators that can show the trends in home values across different regions. According to the data I have, consumer confidence is expected to decline slightly from 104.2 to 103.8, while new home sales are expected to increase from 640K to 645K. The FHFA home price index is expected to be unchanged at 0.2%, while the S&P home price index is expected to decline from 2.5% to -0.2%. These mixed signals may create some uncertainty and volatility in the market, especially for housing-related stocks.
- April 26: Durable goods orders are a low-impact indicator that can measure the demand for long-lasting goods such as machinery, vehicles, and appliances. A higher-than-expected reading can signal increased business investment and consumer spending. The advanced trade balance, retail inventories, and wholesale inventories are also low-impact indicators that can provide some insights into the trade activity and inventory levels in March. The EIA crude oil inventories are a high-impact indicator that can affect the oil prices and energy stocks. A lower-than-expected reading can indicate higher demand or lower supply of oil and vice versa. According to the data I have, durable goods orders are expected to rebound from -1.0% to 0.5%, while durable goods excluding transportation are expected to decline from 0.0% to -0.3%. The advanced trade balance, retail inventories, and wholesale inventories are not available yet. The EIA crude oil inventories are expected to decline by 4.58 million barrels. These indicators may suggest some improvement in the manufacturing sector and the energy market, but they may not have a significant impact on the overall market direction.
- April 27: GDP-Adv. and Chain Deflator-Adv. are high-impact indicators that can show the overall performance and inflation of the economy in the first quarter of 2021. Higher-than-expected readings for GDP can indicate faster recovery and growth and vice versa. Higher-than-expected readings for Chain Deflator can indicate higher inflation and vice versa. According to the data I have, GDP is expected to slow down from 2.6% to 2.3%, while Chain Deflator is expected to decline from 3.9% to 3.8%. These indicators may suggest some moderation in the economic activity and inflationary pressures, but they may not have a significant impact on the market direction. Initial Claims and Continuing Claims are high-impact indicators that can show the state of the labor market and the pace of layoffs. Lower-than-expected readings can indicate improved employment conditions and vice versa. According to the data I have, Initial Claims are expected to decline from 245K to 242K, while Continuing Claims are not available yet. These indicators may suggest some improvement in the labor market, but they may not be enough to offset the impact of the pandemic on the employment situation. Pending Home Sales are a medium-impact indicator that can show the number of homes under contract but not yet closed. A higher-than-expected reading can indicate increased demand for housing and vice versa. According to the data I have, Pending Home Sales are expected to increase from 0.8% to 1.5%. This indicator may suggest some strength in the housing market, but it may not have a significant impact on the overall market direction.
- April 28: Employment Cost Index is a high-impact indicator that can measure the changes in wages and benefits for workers. A higher-than-expected reading can indicate increased labor costs and inflationary pressures and vice versa. According to the data I have, Employment Cost Index is expected to be unchanged at 1.0%. This indicator may suggest some stability in the labor costs, but it may not have a significant impact on the market direction. Personal Income, Personal Spending, PCE Prices, and PCE Prices – Core are high-impact indicators that can show the changes in income, spending, and inflation for consumers. Higher-than-expected readings for income and spending can indicate stronger consumer confidence and demand and vice versa. Higher-than-expected readings for PCE Prices and PCE Prices – Core can indicate higher inflation and vice versa. According to the data I have, Personal Income is expected to increase from 0.3% to 0.4%, while Personal Spending is expected to decline from 0.2% to -0.3%. PCE Prices are expected to decline from 0.3% to 0.1%, while PCE Prices – Core are expected to be unchanged at 0.3%. These indicators may suggest some mixed signals for the consumer sector and inflation, which may create some uncertainty and volatility in the market, especially for consumer-related stocks. Chicago PMI is a low-impact indicator that can show the level of business activity in Chicago. A higher-than-expected reading can indicate expansion and growth and vice versa. According to the data I have, Chicago PMI is expected to increase from 43.8 to 44.1. This indicator may suggest some improvement in the manufacturing sector, but it may not have a significant impact on the overall market direction. Univ. of Michigan Consumer Sentiment – Final is a low-impact indicator that can measure the level of optimism or pessimism among consumers. A higher-than-expected reading can indicate increased consumer confidence and spending and vice versa. According to the data I have, Univ. of Michigan Consumer Sentiment – Final is expected to decline slightly from 63.5 to 63.3. This indicator may suggest some deterioration in the consumer sentiment, but it may not have a significant impact on the overall market direction.
Not that Monday’s matter but the Dollar is low (101.6) so we SHOULD get a boost in the indexes this morning. What matters is what sticks this week once we’re 2/3 through Earnings Season.


