By Mike Shedlock via MishTalk.com
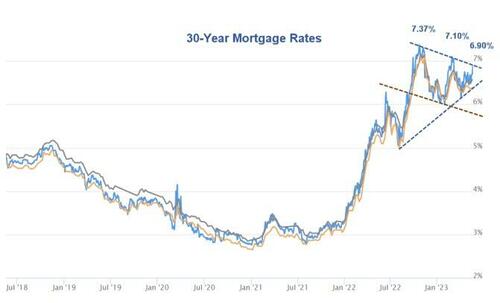
The 30-year mortgage rate is 6.90 percent. For now, expect continued housing weakness.
30-Year Mortgage Rates courtesy of Mortgage News Daily
Mortgage News Daily reports Mortgage Rates Now at 2 Month Highs by Matthey Graham.
It may not be a death by a thousand cuts, but mortgage rates are suffering a bit of blood loss from roughly 5 cuts. Specifically, the past 5 days have seen consecutive moves to higher levels. The whole affair has been fairly steady relative to the types of volatile swings that have been all too common for most of the past year and a half.
The average lender is now at their highest levels since early March, just before the Silicon Valley Bank failure kicked off a flight to safety that helped bonds/rates improve substantially.
Despite the unfriendly movement, we’re not necessarily facing a persistent threat. Unfortunately, it’s just as fair to say we’re not expecting any persistent drop in rates for any particular reason either. That juxtaposition speaks to the rate market’s recent indecision and the fact that we continue waiting on an unequivocal case to be made for or against inflation returning to lower targets.
Technical Pattern
The blue triangle-shaped pattern I outlined on the MND chart is either a symmetric continuation pattern (same slope) or a rising wedge, differing slopes.
If your crayon is fat enough, you can shift the blue lines to make a case either way.
The expected resolution of a symmetric triangle is higher, that of a rising wedge is lower.
There are alternate patterns one can draw such as a channel formed by the read and blue horizontal lines.
Clear as Mud
In short, the technical pattern outlook is the same as the “indecision” noted by Graham.
Actions by the Fed and the market’s view of the economy will determine what happens with rates.
Lower is not necessarily good if it is accompanied by a hard recession.
For now, rates are sufficiently high to weaken housing.
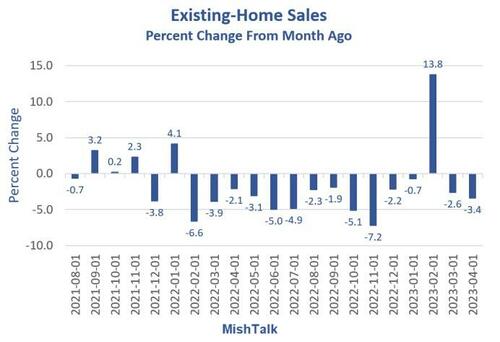
Existing Home Sales Decline for the 14th Time in 15 Months
Existing Home Sales courtesy of the National Association of Realtors via the St. Louis Fed
On May 18, I noted Existing Home Sales Decline for the 14th Time in 15 Months
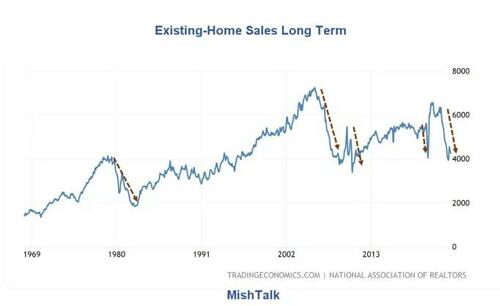
Existing Home Sales Long Term
Chart courtesy of Trading Economics, annotations by Mish
Transaction Crash
Existing home sales have crashed to a level seen in the mid 1990s. Prices have not crashed but transactions have.
Many people who want to move are effectively trapped in their houses because they do not want to trade a sub-3% mortgage for a 6.5% mortgage.
The bidding wars we do see are from people who are price insensitive. They make for amusing anecdotes but the above chart shows the real picture.
This crash is likely to last longer because intertest rates are likely to stay higher for longer because the Fed fears stoking more inflation.
Home sales mean appliance sales, new furniture, cabinets, new carpet, landscaping, etc. Who doesn’t spend a lot more money when they move into a new home?
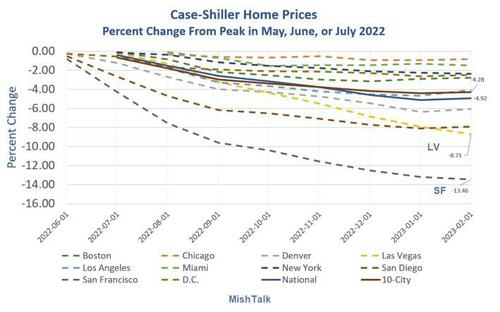
Percent Decline From Peak
Case-Shiller data from St. Louis Fed, chart and calculations by Mish
Case-Shiller Home Prices Unexpectedly Rise Adding Interest Rate Pressure on the Fed
On April 26, I commented Case-Shiller Home Prices Unexpectedly Rise Adding Interest Rate Pressure on the Fed
Case-Shiller Index Chart Notes
-
Home prices temporarily halted their slide in February
-
The 20-city seasonally-adjusted price rose 0.1 percent
-
The 20-city unadjusted price rose 0.2 percent
-
Year-over-year the 20-city unadjusted price rose 0.4 percent, down from 2.6 percent
Stalemate
For now we have a stalemate. There is little inventory because buyers want the price they could have gotten a year or two ago.
Sellers cannot afford homes because prices have not declined enough to make up for rising mortgage rates.
So here we are, with all eyes on a Fed that is largely responsible for the problem by holding rates too low too long again.
* * *


