 We’ve got high hopes.
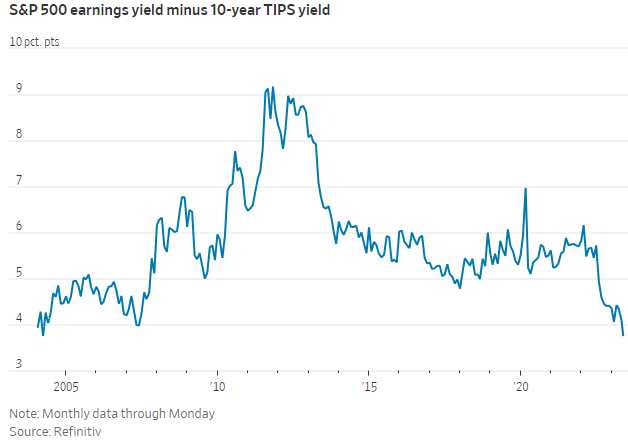
Markets are already pricing in an economy with lower but stable inflation, higher interest rates for an extended period, and continued growth. This optimism is reflected in rising stock prices, stable Treasury yields at relatively high levels, and decreasing risk premiums on junk bonds. These trends indicate a bullish outlook for the economy.
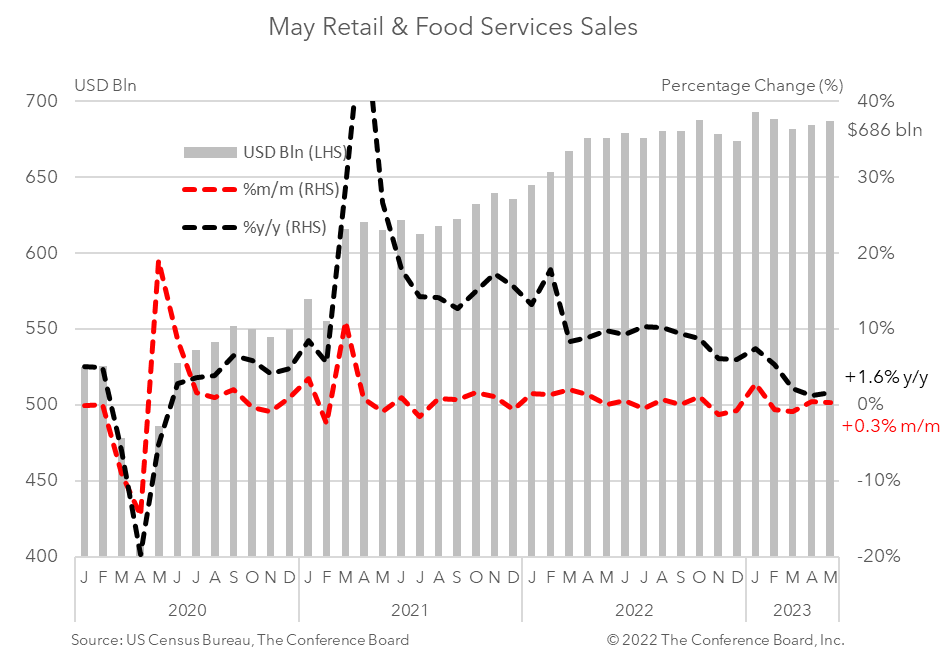
The Atlanta Fed’s GDPNow estimate suggests stronger growth than expected, consumer sentiment is up, inflation expectations are down, and even the home-construction market is showing signs of life. The Fear of Missing Out (FOMO) might continue to drive the rally in the markets for a while longer but the economic outlook is more uncertain than the current price action suggests. Investors need to focus on the bigger economic picture and not get distracted by short-term Fed decisions or what nonsense Powell says this morning.
 Why does anyone listen to Powell anyway? He’s not known for being honest or straightforward – the Fed often says one thing and does another and almost every move they make is a “surprise” – that’s BECAUSE you can’t go by ANYTHING that man has to say – yet what he says moves markets. Go figure…
Regardless of what Powell SAYS, the lagged effect of rate hikes could lead to increased defaults and delinquencies, the depletion of pandemic savings may reduce consumer spending, zombie banks could curtail lending, and certain economic indicators, such as Manufacturing Surveys, show signs of weakness. Labor Prices are still climbing and still driving core inflation and that is YEARS away from subsiding – ESPECIALLY if the economy stays “strong”.

Real Disposable Income is a FACT that the Fed is well aware of. Very simply, people have less money to spend than they did in 2020 though it’s more than Q1 and Q2 of last year – so the comps are favorable and we can delude ourselves that things are improving the way your parents may jump for joy when you hit a single after striking out 4 times – it’s an improvement but you are still batting .200.
The problem with Real Disposable Income is that it does not separate out the growing wage gap where the disposable income of the people who are not dropping $100/person for dinner every night without batting an eye and the bottom 99% – who have sticker shock every time the go to the supermarket.

The components that make up real disposable income as measured by the Fed include:
-
-
Wages and Salaries: This category includes the earnings from employment, including wages, salaries, bonuses, and other compensation received by individuals.
-
Proprietors’ Income: It represents the income earned by self-employed individuals, sole proprietors, and partnerships. It includes both the labor income and the income generated by the business.
-
Rental Income: This component captures the income received by individuals from renting out properties, such as residential real estate or commercial properties.
-
Dividend Income: It includes the income earned from owning stocks and receiving dividends paid by corporations to their shareholders.
-
Interest Income: This component represents the income earned from holding interest-bearing assets, such as bonds, certificates of deposit, or savings accounts.
-
Transfer Payments: This category includes government payments to individuals, such as Social Security benefits, unemployment benefits, welfare payments, and other forms of public assistance.
-
Other Sources: This component covers other sources of income, including royalties, estate or trust income, and any other miscellaneous income not captured in the above categories.
-
 Once these components are aggregated, the nominal income is adjusted for inflation using a price index, such as the Consumer Price Index (CPI), to derive the real disposable income figure. This adjustment is necessary to account for changes in the purchasing power of the income over time.
Perhaps I’m hyper-aware of this because I live in Delray Beach, Florida and we are a tourist destination for the global elite where $6,000/month is cheap for a winter rental ($10,000+ if you want to see water from your window) and the sushi bar down the street is $150 fixed price (but very good!) and they add 20% automatically – so you don’t have to worry about under-tipping.
How many people in that chart above can afford $300 + $60 + drinks (also not cheap) for dinner? Even for those people in the 95th percentile “only” make $300,000 per year and that’s maybe $200,000 take-home so how much disposable income do they really have?
Fortunately for Delray Beach, the Top 5%, whose incomes begin at $300,000/year encompasses 400M people on this planet and those people also don’t mind $1,000 air fares or $500/night hotels – so they come and they come in droves. That’s why Disney (up the road from us) can charge $200/day – not to mention $5 for a bottle of water.
 Companies are shifting their focus to serve a smaller, wealthier clientele rather than competing for market share with a strong trend towards gentrification and price increases in various industries, including Casinos, Theme Parks, Movie Theaters, and Consumer Goods. This trend is a strong departure from the postwar Middle-Class Consumer Society and reflects the growing divide between the rich and poor in the United States.
That’s because, as you can see from the chart, the class wars are over and the bottom 80% lost and the bottom 60% have been essentially eliminated from the competition all together. And you’ll notice something interesting about the Top 20-2% – they have MASSIVE debts because they too are losing the war and have been going TRILLIONS of Dollars into debt trying to keep up with the Top 1%, who have $40Tn compared to a $3Tn average for each percentile of the 2-20% club who are, in turn, 3x richer than the 40-21% group – so they can still afford to ski and have nice meals (once in a while).
You can’t call inflation “fixed” when lift tickets, baseball tickets, concert tickets… start at $100. We used to go to baseball games because it was a cheap way to spend a summer day but now it’s a rare tread for the family as you can end up spending well over $500 for four people to go out.
The kind of Inflation the Fed is fighting is WAGE Inflation and they Fed does not want the bottom 80% to catch up. The Fed is not there for the people – the Fed is there for the Top 1% and now that they have $40Tn the Fed’s job is to help them get to $60Tn and the 60-79%’ers only have $25Tn left between them so where is the next $20Tn going to come from?
Watch out “Rich People” – the Top 1% are coming for you next!


