
 The BOE raised rates 0.5% this morning.
They are still behind us at 5% and the ECB is at 3.75%, but that’s the highest rate the ECB has been at in 22 years (2001) as the recent inflation report was still showing 6.1% growth in May. Unlike the very optimistic Fed, the very realistic ECB believes inflation will persist around 5.4% into the end of 2023.
 Meanwhile, Japanese rates are still negative and the Yen is down close to 10% for the year, which is the pretty much the entire reason the Nikkei is up 25% for the year.
Japan, being a big exporter, gets paid in Dollars, for example and right now a Dollar is 141 Yen but in January, it was 106 Yen. So, if Toyota sent 2M cars in January to be sold for an average of 4.2M Yen ($40,000) in January – imagine how pleased their shareholders are to be getting 5.6M Yen ($40,000) for each car that is sold in the US. Clearly their costs did not change – they are simply getting 33% more than they expected per car.
That’s why the Japanese markets have been exploding higher as well as other countries that have gotten weaker against the Dollar this year. From a local currency perspective, their profits have gone way up in 2023 – as they get paid in stronger Dollars.
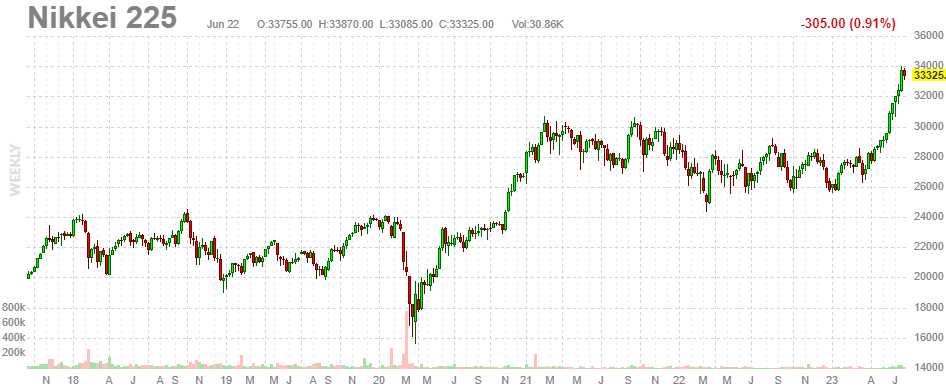
To hammer home this point, let’s look at the Nikkei 225, which is up 7,000 points (26%) since March of 2021:
But that’s priced in Yen. This is what happens when you price the Nikkei in gold:
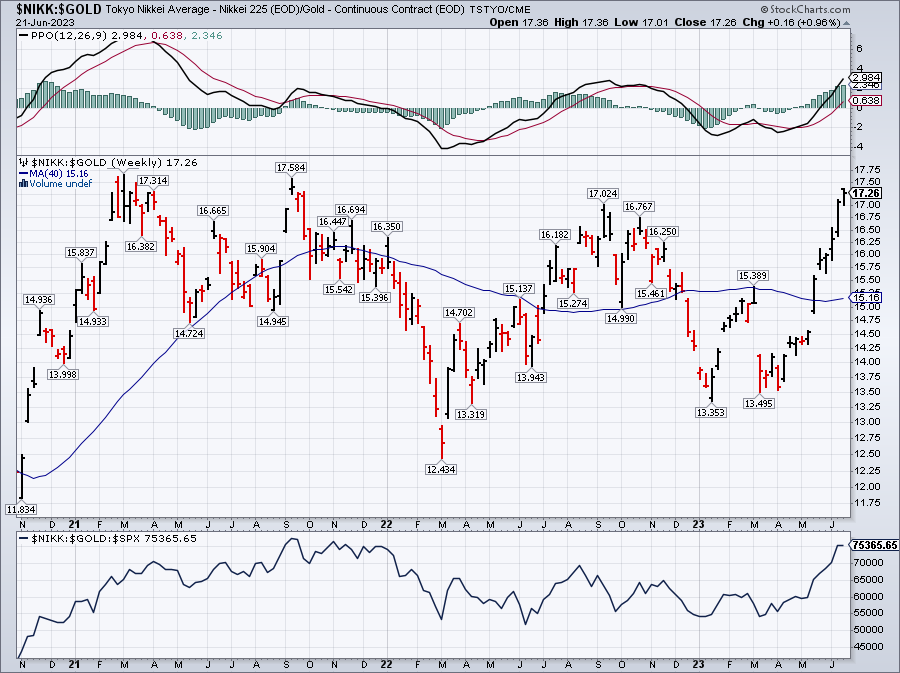
The Nikkei is not one bar of gold higher than it was in March 2021 – lower, in fact. Yet US and European markets go up because the Nikkei is going “up” and then they go up because we go up and you REALLY don’t want to know what our markets look like priced in Gold, do you? OK, you asked for it:
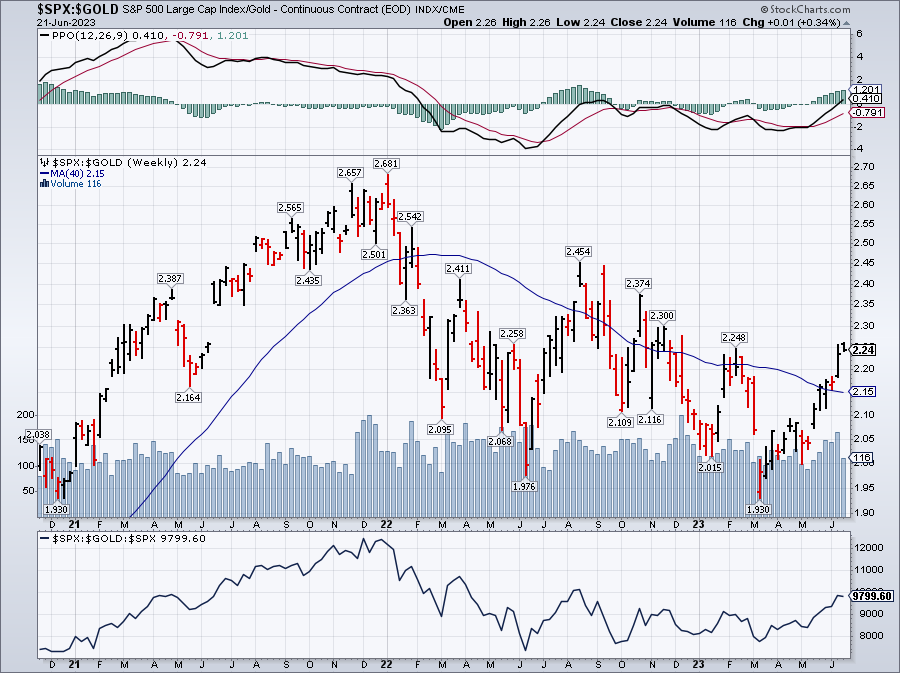
Oh dear, that’s not pretty!
 That’s why our Top Trade Alert on June 8th was GOLD – and it’s still playable. Meanwhile, as noted above, the S&P Futures (/ES) were rejected last week at 4,500 and now we’re failing 4,400 this morning and these are the September 30th Futures contracts while the current S&P 500 is at 4,350 so the extra 50 points is an indication of how high investors expect the index to go in the next 100 days (1.15% higher).
That is, as we say at the London School of Economics – flat. In either case, the run is from 4,000 to 4,400 and 4,500 is simply an overshoot or, more precisely 4,380 as our 5% Rule™ tells us that the resistance lines from 4,000 are 4,080 (weak bounce), 4,160 (strong bounce), 4,240 (strong retrace) and 4,320 (weak retrace) so this week and next we’ll be seeing if 4,320 holds – which would indicate that we are consolidating for a move over 4,400.
If not, then we’ll look to see if 4,240 can hold and, if that fails – sadly we’ll be likely on the way back to 4,000 before we see 4,400 again. We bailed on our old Member Portfolios when the S&P hit 4,200 in May as we thought that was a bit much but here we are at 4,350, trying to keep an open mind…
Powell is speaking again today but not likely to say anything new. In other news:
- Here Are the Key Takeaways From Powell’s Testimony Before US House
- Powell expects more Fed rate hikes ahead as inflation fight ‘has a long way to go’
- Powell Signals Higher Rates as Lawmakers Press Him on Bank Rules
- Hedge Funds Sell US Stocks For 9 Of The Past 10 Days, “Position For Downside Risk”: Goldman PB
- Economist who anticipated bank failures this spring says U.S. recession may be just around the corner
- China Begins Nationwide Push to Reveal Hidden Government Debt
- US Warns of China’s IP-Theft ‘Playbook’ for AI, Advanced Tech
- China Lashes Out at U.S. After Biden Calls Xi a Dictator
- Inside China’s spy war on American corporations
- Financial Hardship Surges As Cost-of-Living Crisis Squeezes Workers
- Home Listings Plummet as High Mortgage Rates Tie Owners Down
- Alcoa set for early slide as Morgan Stanley downgrades to Sell equivalent
- Copper climbs to highest since May as LME stockpiles plunge
- Darden Restaurants falls after same-restaurant sales trail estimates
- Google accuses Microsoft of unfair practices in Azure cloud unit
- Microsoft set to battle with FTC in court over $69B Activision deal
- Tesla’s stock suffers biggest one-day decline in months.
- Intel stock drops 6% as company updates chip manufacturing plans
- Intel to restructure manufacturing business
- Nvidia board member sells $51 million in stock, joining a pair of other long-timers in unloading shares
- Amazon allegedly duped people into subscribing to Prime and made it nearly impossible to cancel. Here’s how feds say they did it.
- Paramount studio assets ‘rare gem’ that could be worth $30B in a sale: Wells Fargo
- Aeglea BioTherapeutics acquires Spyre; microcap up 360%


