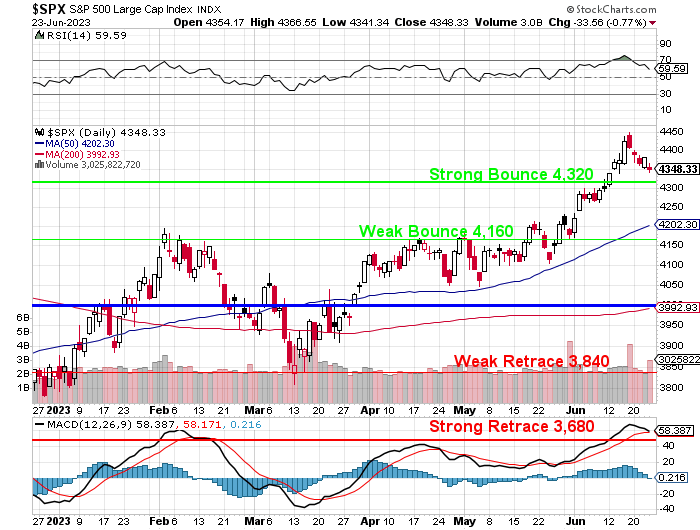
4,320.

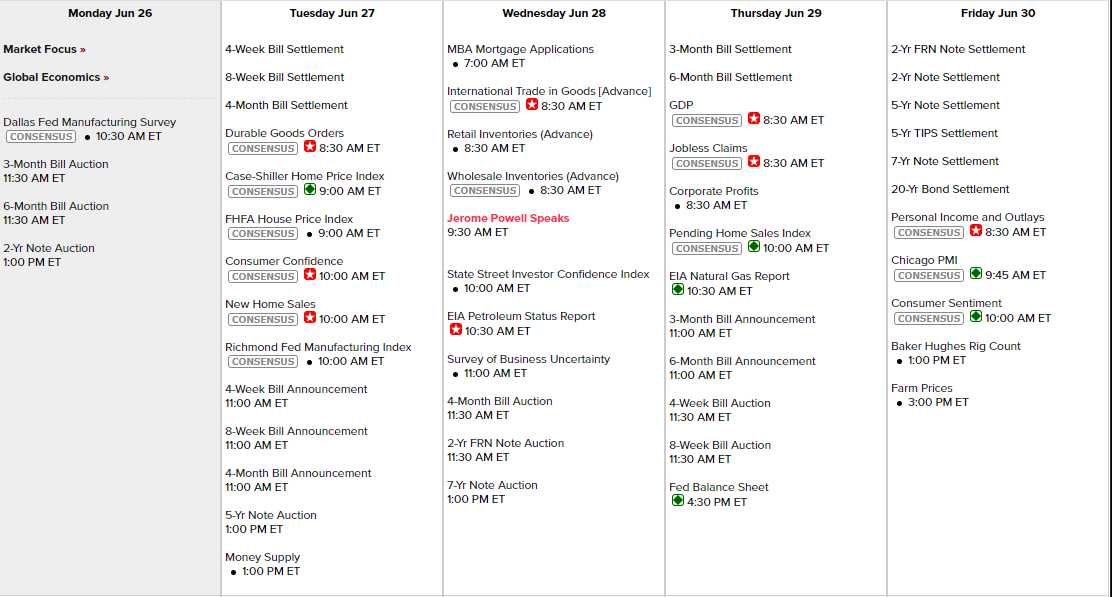
That is the line to watch this week on the S&P 500 as we head into the extra-long July 4th weekend because no one in America who can avoid it is going to work on Monday when Tuesday is a National Holiday Next week. So it’s going to be a low-volume affair for the next 10 days but THIS week has a lot of interesting data to watch:

Well, not today but the rest of the week is pretty exciting: Tuesday there are several significant economic indicators to watch. Durable Goods for May are expected to show a decline of 1%. Housing Prices are expected to keep going lower and Consumer Confidence for June is expected to improve with 104 expected. New Home Sales have been picking up. Wednesday we have Housing and Trade Data along with Powell speaking. Thursday is our 3rd revision to Q1 GDP, last seen at 1.3%. Friday we finish big with Personal Income & Outlays for May, PCE Prices, Consumer Sentiment and the Chicago PMI.
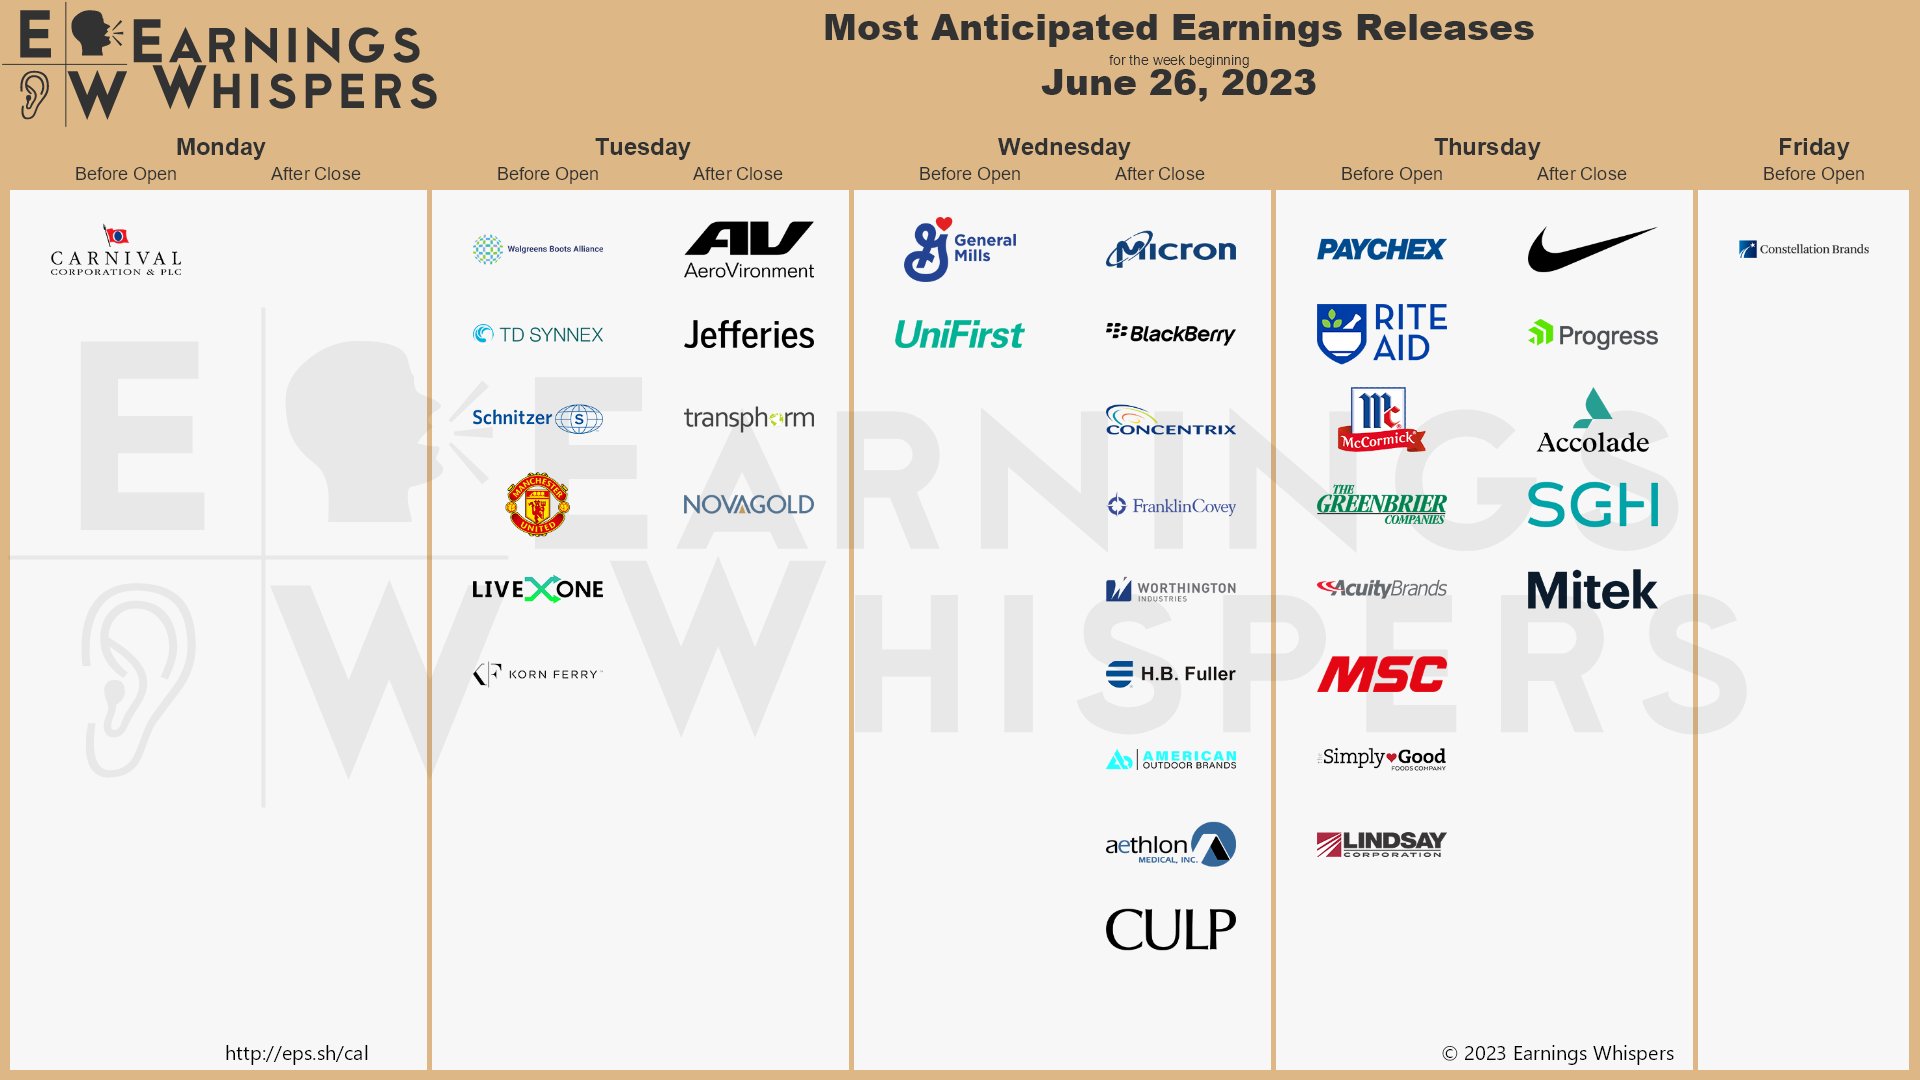
And there’s no lack of earnings as the early Q2 reports are starting while late Q1s are still trickling in as well:
It doesn’t matter if the reports are Q1 or Q2, they are going to give us a snapshot of where companies are now and what the environment is like through June so we should pay close attention to what companies like CCL, WBA, GIS, MU and NKE have to say. Q2 earnings officially kick off on July 14th, when the Big Banks start to report.
Russia had a mini-revolution over the weekend but it’s already over and, so far, it hasn’t even gotten oil back over $70, which is very sad for OPEC+ but it’s July 4th weekend so I would not bet against oil and, in fact, I’d play /CL long over the $70 line with tight stops below as I think $75 is very possible into the holiday.
 Natural gas, on the other hand, couldn’t be any hotter – blasting back over the $2.80 line from below $2.20 earlier this month. We added the Natural Gas ETF (UNG) 2025 $5/8 spread to our $700/month Portfolio back on April 4th at net 0.95 and we’re already up around $7.50 and the $5s are $3.85 and the $8s are $2.65 for net $1.20, which is up 33% and well on track for the full $2.05 (215%) gain. Aren’t options fun?
Not that the spread is still $1.20 on the $3 spread so there’s still $1.80 (150%) remaining to be gained – that’s not too bad considering we took a lot more risk on April 4th calling the bottom so feel free to join in if 150% upside potential in 18 months is good enough for you…
Energy Transfer (ET) is another way to profit from Natural Gas. This is a pipeline company that is not dependent on the price of the gas. Last year they made $4.7Bn but $12.50 for the stock is just $38.7Bn in valuation so trading at less than 10x prior earnings and it’s a fantastic dividend stock, paying $1.23 annually.
We bought ET around $8 last year so it pains me to pay $12.50 to get back in but, through the magic of options – we don’t have to pay retail for stocks (see “How to Buy Stocks for a 15-20% Discount“). For one thing, we can PROMISE to buy the stock by selling the 2025 $12 put for $1.75. The dividend is $1.23 so 18 months would pay us $1.845 but this way, we collect $1.75 up front without all that messy owning of the stock and our worst case is we get assigned the stock at $12, less our $1.75 is net $10.25, which is a nice 14.5% discount – not a bad worst case!
We already have ET in our Income Portfolio and that position looks like this:

So far, we are down on the position and we were aggressive with our put sale so our entry is net $10,344 for 1,200 shares so net $8.62/share is a tremendous discount but we do risk being assigned 800 more shares at $15 ($12,000), which would bring us up to $22,344 for 2,000 shares and that would be net $11.17 per share – so we’re still in good shape and, if we collect our anticipated 1,200 x $1.23 ($1,476) over 30 months ($3,690), then our net would be down to ($22,344-$3,690 = $18,654)/2000 = $9.327 per share and THAT is our worst-case scenario if the dividends keep coming and that’s pretty good!
You could modify this trade to sell the 2025 (not Dec) $12 puts for $1.75 and lower the net assignment price considerably but we feel there’s good growth ahead for the company and, of course, you can always roll the short puts and sell more calls to further lower the basis.
For example, the current (July) $15 puts are $2.50 and, as above, the 2025 $12 puts are $1.75 and the Dec 2025 $12 puts are $2.40 – close to an even roll. So, that’s 30 months out and we drop $3. If we do that every 30 months, we’ll be at 0 in 10 years so, as long at ET doesn’t go bankrupt, we should be in great shape – eventually.
Meanwhile, if the short puts keep having to be rolled, the short calls must be winning so if we’re selling short calls for $2 4 times in the next 10 years, that’s $8 more off the net price so we’ll actually hit net $0 in more like year 7 – and we’ll still be collecting those dividends.
This is the true key to building market wealth – it certainly doesn’t seem very exciting over the short run – in fact, we are down a bit at the moment. But, over the long run, the math is very much in our favor and we should get 100% of our money back every 6 or 7 years and then we can initiate another dividend stream and, in year 14, 4 streams with 8 streams in year 21 at which point our initial $10,344 investment should be paying us $11,808 per year in dividends and our retirement plan will be in very good shape along with well over $100,000 worth of stocks!
Hopefully it will be a nice, boring week as we roll into the long, holiday weekend…


