
 I’m not here – what are you doing here?
It’s a 4-day weekend – go enjoy yourself. Today is only a half-day anyway and the markets will still be here when you get back. I’ll be checking in a little since the markets are kind of open, but no one is in the mood to work today (I would avoid surgery!) though we can take a look at what lies ahead this week:
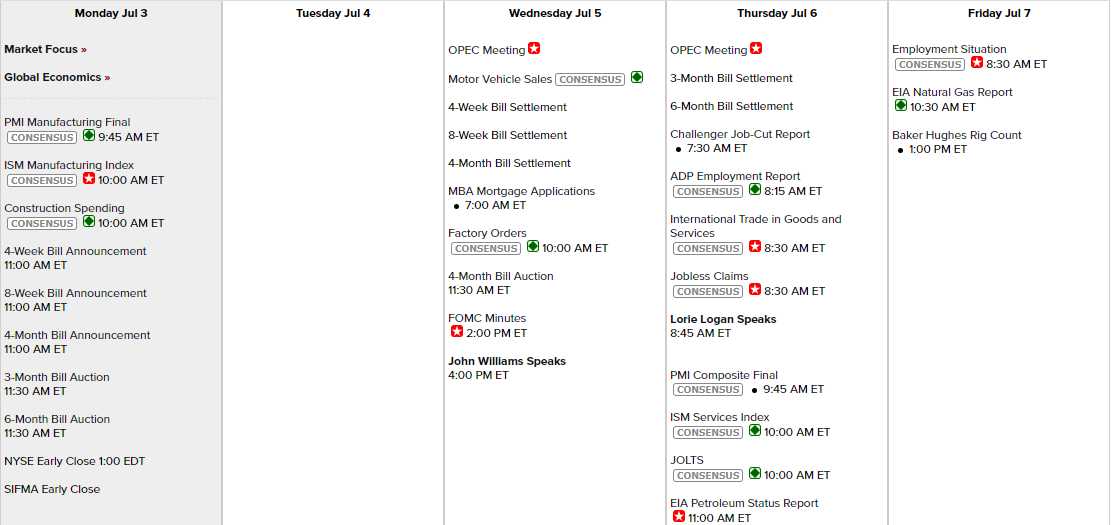
Well, we can’t ignore Non-Farm Payroll on Friday and PMI, ISM and Construction Spending this morning are important reports. Fed Minutes on Wednesday, an OPEC meeting on Thursday and Services for PMI & ISM so not nothing but nothing that’s likely to be market-moving either.
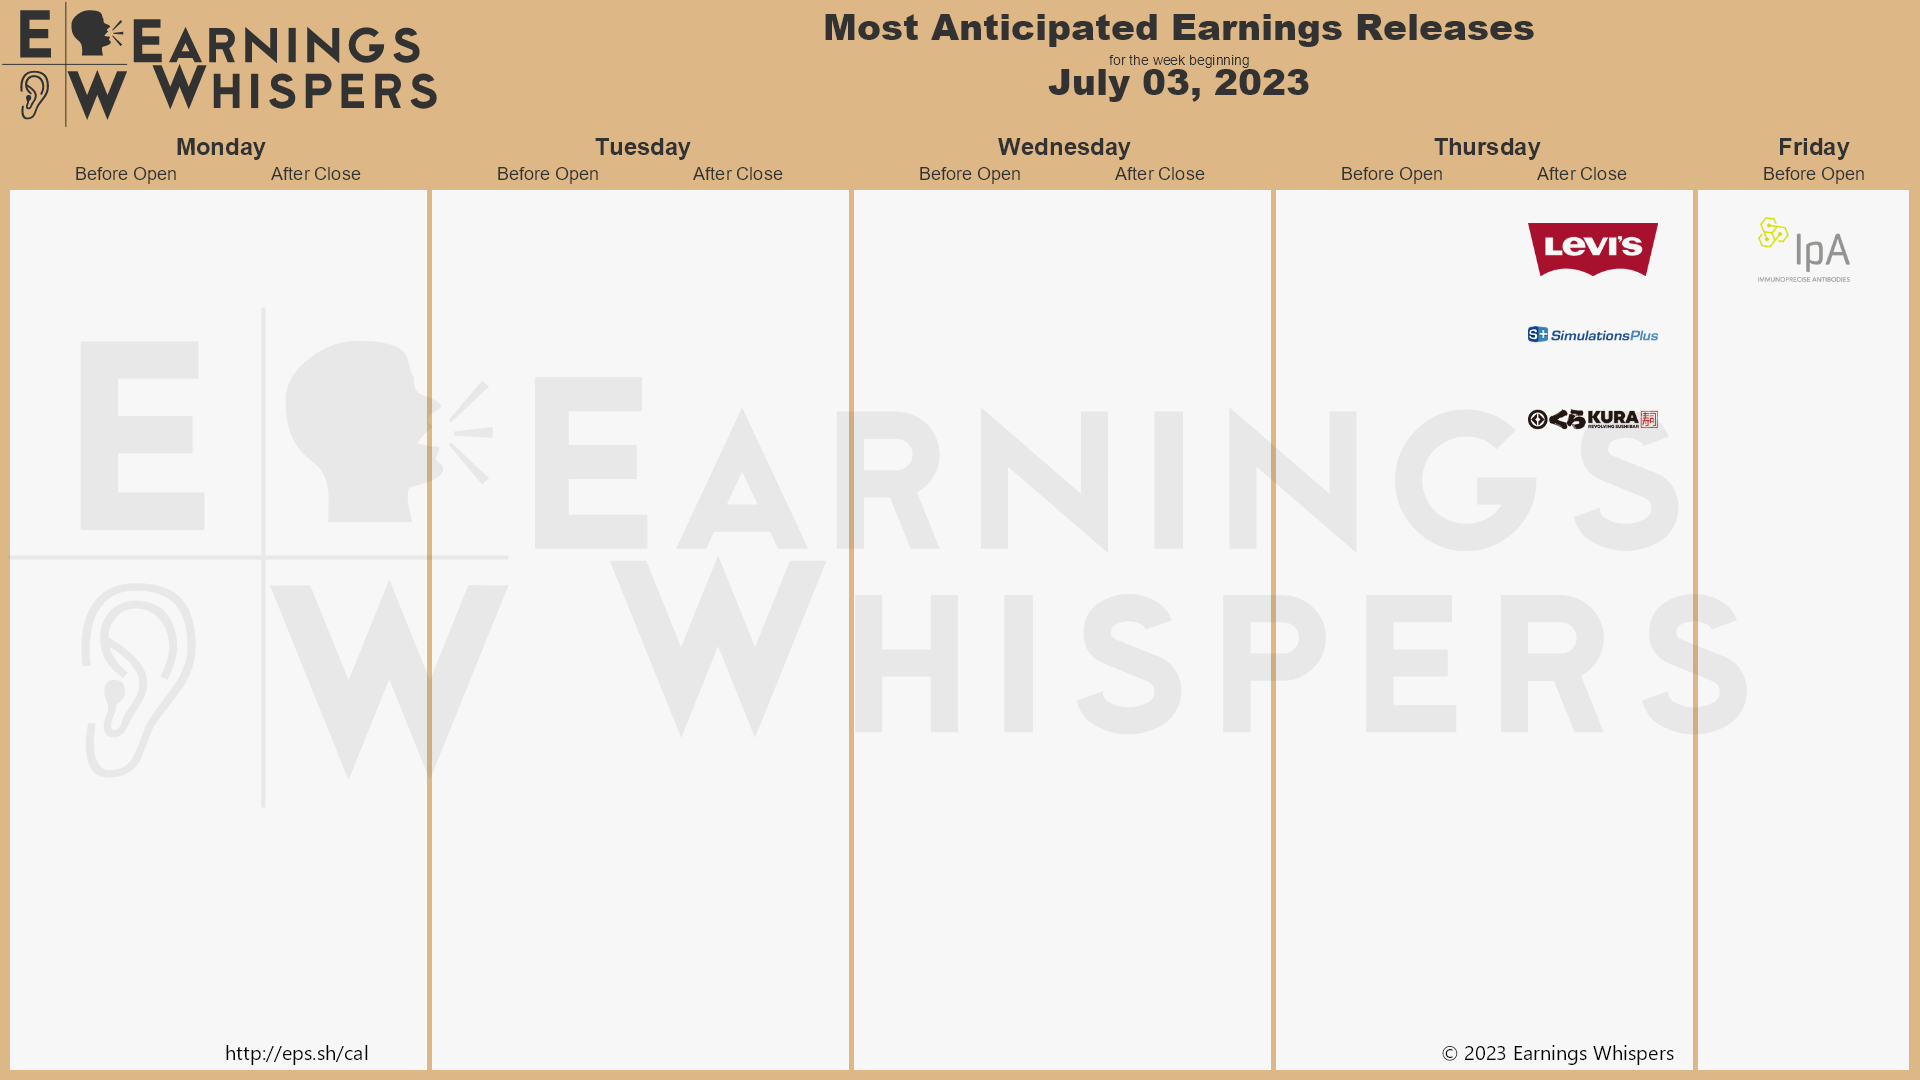
Earnings don’t really start until next Friday, when the Big Banks check in. This week is sparse to say the least:
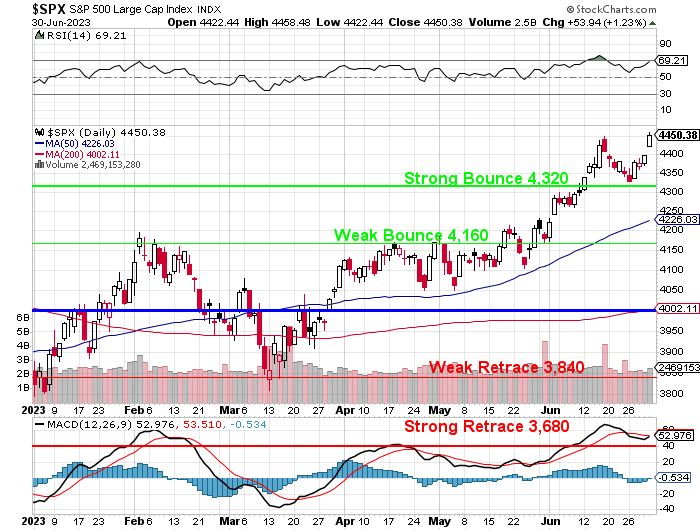
We had a huge end-of-quarter rally with the S&P and Nasdaq adding almost 2% on their last day to end up about 16% and 32% for the year – so far. Will we finish the year up 62% or will things calm down to 8% and 16%. If we hold the Strong Bounce Line of 4,320 on the S&P 500, we will have to move our range up to center on the 4,400 line and we’re already at 4,450 – here’s our old chart (we’ve been using since March of 2020) and then the one that is adjusted mainly for inflation – as earnings have not actually been much better than they were at the time:
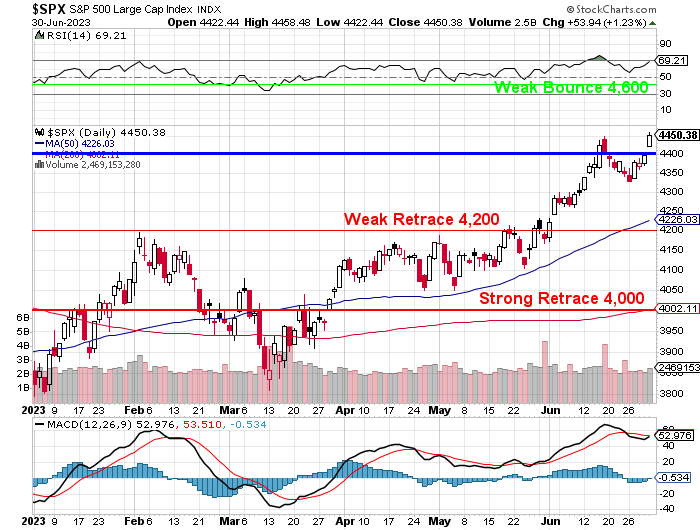
The second chart represents the assumption that 4,800 was not a mistake but actually the top of our range. It was way back in 2022 when we hit 4,800 (briefly) and then we fell 1,300 points (27%) but now we’re back at 4,485 on the Futures chart – what could possibly go wrong?
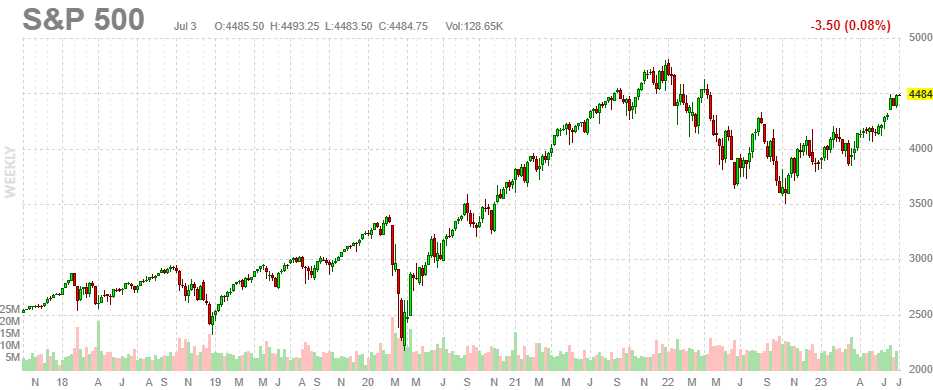
Have stocks REALLY doubled in value since the crash in 2020? Well, that was a crash so we shouldn’t count that. Let’s say 3,000 was a fair top before then and now 4,500 is up just 50% from the highs of 2018 and 2019.
- AAPL made $60Bn in 2019, now $94Bn – that’s more than 50% higher.
- MSFT made $40Bn in 2019, now $71Bn – that’s up 75%
- GOOG made $34Bn now $67Bn – call that a double!
- AMZN made $11.5Bn in 2020, now $16.5Bn – up 43%
- Berkshire Hathaway made $81Bn in 2019, now $33Bn – Oops! That’s down 60% but 2019 was a very good year for them.
Those 5 companies (6 kind of, because GOOGL is counted as well) make up $10.5 TRILLION worth of the S&P 500s $32Tn total market cap – almost 1/3. The next 5 companies (UNH, JNJ, XOM, V and JPM) are about $3Tn and the next 5 (TSLA, WMT, NVDA, PG and LLY) are about $2.5Tn thanks to NVDA busting up to the $1Tn club. After that, our next 5 are CVX, MA, HD, META and PFE – good for another $2Tn.
So that’s 20 stocks that are 1/2 the S&P 500’s total market cap and yes, most of them are doing great but the actual Earnings Yield of the S&P 500 overall is still below what it was in 2019 – it’s JUST the leaders that are doing well (which is why they are leaders – as we’ll looking at the 20 most valuable companies in the index).
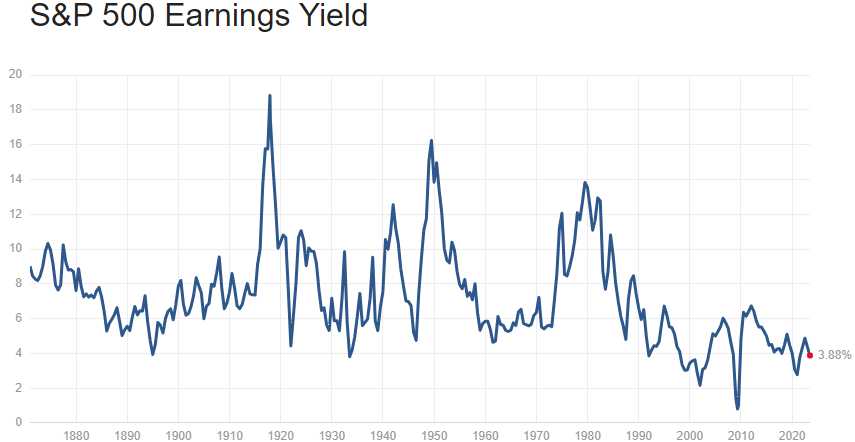
This is why I have so much trouble switching to the more aggressive chart for the S&P – I just don’t think they’ve EARNED it yet!
Have a happy 4th of July!
- Phil

")


