Zillow’s “Bold Call” on U.S. Housing Prices (Don’t Hang Your Hat on It)
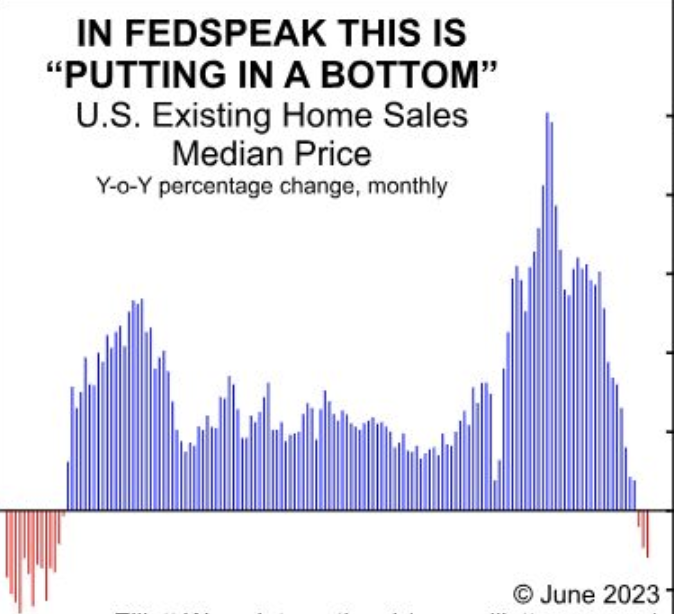
This does not look like a bottom in median existing home prices
By Elliott Wave International
Back in October 2022, none other than Realtor.com asked the question:
Is America in a housing bubble–and is it getting ready to burst?
That was 10 months ago and just like a widely anticipated recession, the feared bursting of the housing bubble has yet to materialize.
Indeed, another real estate sector firm — Zillow — has gone out on a limb with this prediction (Fortune, July 28):
In February, Zillow economists made a bold call that U.S. home prices had bottomed…
In the months that have followed, U.S. home prices as tracked by the Zillow Home Value Index have stopped falling, and between February and June rose 4.8%.
Yes, Zillow’s forecast has mainly worked out so far, however, let’s also keep in mind seasonal and other factors.
Here’s a perspective from our July Elliott Wave Financial Forecast, which used another measure to gauge the health of the U.S. housing market (The Elliott Wave Financial Forecast is a monthly publication which covers major U.S. financial markets):
This chart showing the year-over-year change in the median existing home price doesn’t look much like a bottom. According to the National Association of Realtors, the median existing home sold for $396,100 in May 2023, a 3.1% decline from May 2022, “marking the largest year-over-year price reductions since December 2011.” Recent increases can be attributed to two factors: spring buying, which happens every year, and the run-up in equity prices, which makes people feel wealthier.
So, we’ll see what happens after the seasonal bias passes. And, just as importantly (or more so), we’ll have to keep an eye on the stock market.
History shows that the housing and stock markets tend to be correlated.
So, if the stock market tanks in a big way, we could have a replay of 2007-2012 on our hands.
Of course, that’s a big “if.”
One way to gauge the health of the stock market, and thus the housing market, is to keep an eye on the stock market’s unfolding Elliott wave pattern.
Here’s a quote from the Wall Street classic:
In the 1930s, Ralph Nelson Elliott discovered that stock market prices trend and reverse in recognizable patterns. The patterns he discerned are repetitive in form but not necessarily in time or amplitude. Elliott isolated five such patterns, or “waves,” that recur in market price data. He named, defined and illustrated these patterns and their variations. He then described how they link together to form larger versions of themselves, how they in turn link to form the same patterns of the next larger size, and so on, producing a structured progression. He called this phenomenon The Wave Principle.
All that’s required for free access to the online version of the book is a Club EWI membership. Club EWI is free to join and allows members complimentary access to a wealth of Elliott wave insights regarding financial markets, investing and trading.
Follow this link to join Club EWI and read the book for free: Elliott Wave Principle: Key to Market Behavior.
This article was syndicated by Elliott Wave International and was originally published under the headline Here’s a “Bold Call” on U.S. Housing Prices (Don’t Hang Your Hat on It). EWI is the world’s largest market forecasting firm. Its staff of full-time analysts led by Chartered Market Technician Robert Prechter provides 24-hour-a-day market analysis to institutional and private investors around the world.


