We noticed something disturbing yesterday.

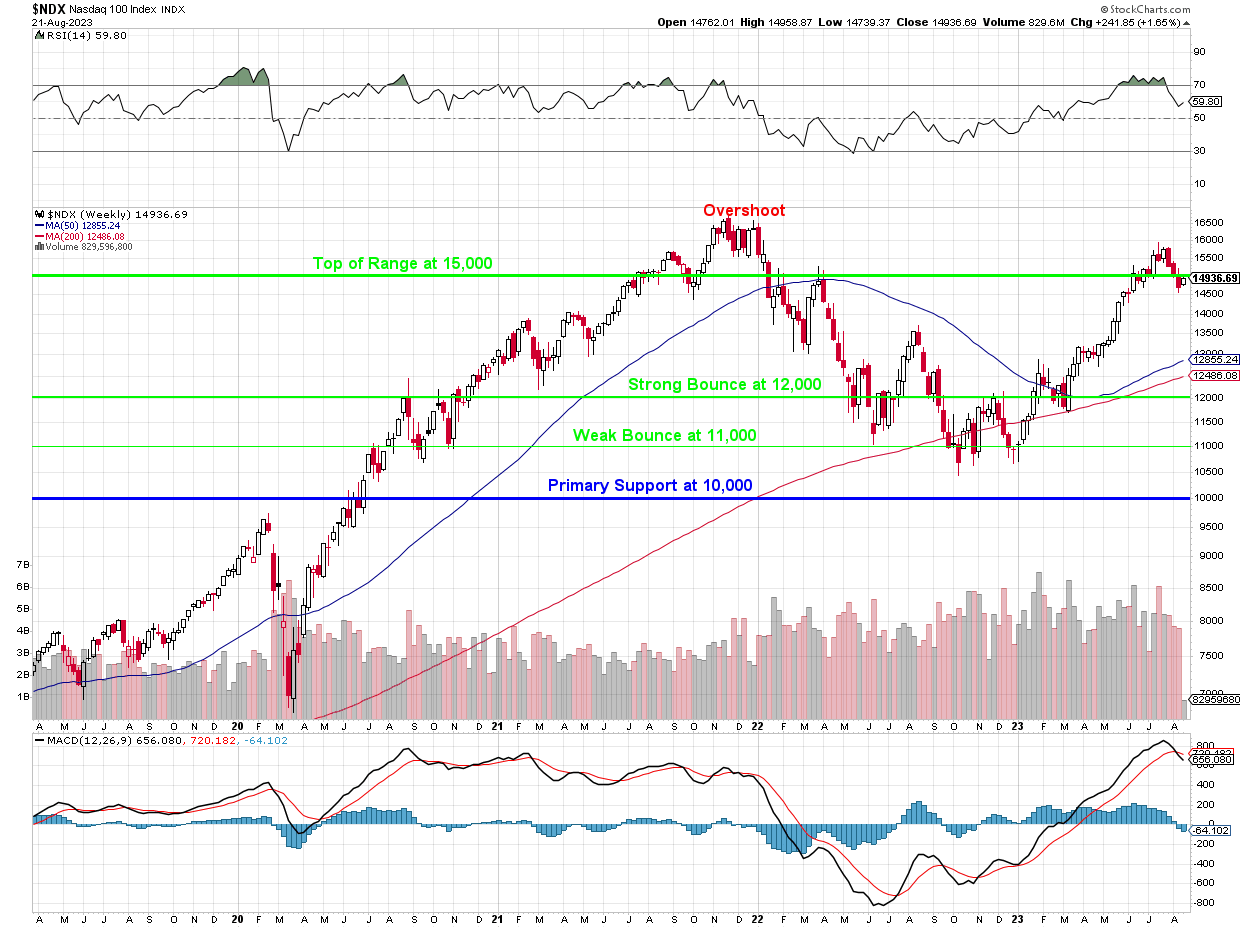
Although the S&P and Nasdaq look to be on the mend, their long-term, weekly charts tell a very different story. We never made a bullish adjustment for inflation on our Nasdaq weekly chart but, even so, we’re struggling to get back over the top of the old range at 15,000 and both RSI and MACD indicators are still looking quite overbought and let’s not even talk about both the 50 and 200 WEEK moving averages being 20% below where the index is.
Although TA is total BS, the fact that, for the past year (50-week) and 4 years (200-week), the consensus of all the people who bought Nasdaq stocks thought they were worth 20% LESS than they are priced at today.
Since that run-up came in the past year (and before this it was Trillions in stimulus that drove us higher), we can think of what changed and it’s post-Covid (we hope!) and, of course AI but – as I’ve said before – there are only a dozen companies that are SELLING AI/AI Services (MSFT, GOOGL, AMZN, IBM…) and the other 488 S&P 500 companies are CONSUMERS of AI and don’t deserve an immediate pop just for saying “AI” in the same way most companies should not have flown up in “value” just because they had “Dot Com” initiatives.
Will AI make companies more efficient and profitable? Probably. Will it happen this quarter or next quarter or the one after that? Not likely. Can you name 3 companies now where AI has had a positive impact on their bottom line?
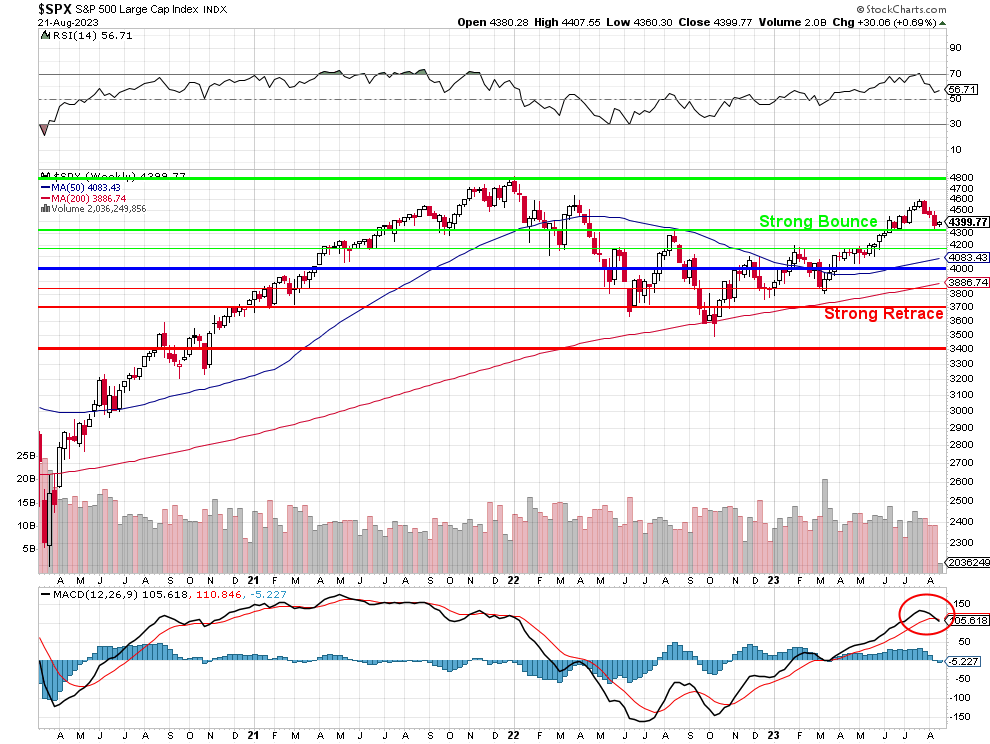
Anyway, back to the S&P chart. I made a weekly chart using our old 4,000 range – without the bump to 4,400 because, so far, the S&P has been unable to demonstrate it can hold that range. In fact, as you can see, evidence since 2021 strongly suggests that 3,700 (strong retrace) to 4,320 (strong bounce) is exactly the right range for the S&P 500.

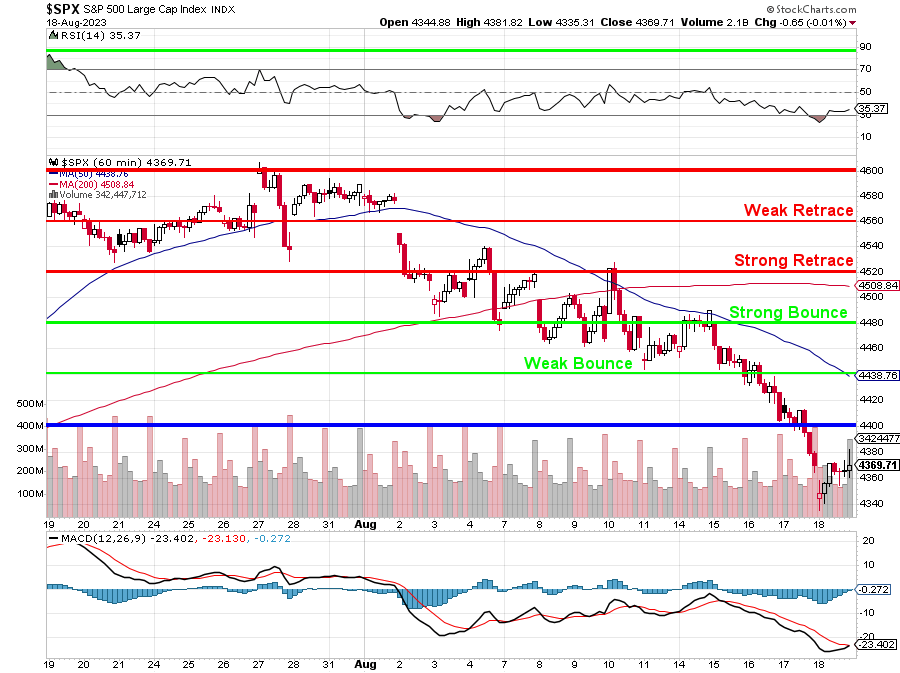
We were giving the S&P the benefit of the doubt and added 10% for inflation but, as you can see on that chart – CLEARLY it has not been performing like it belongs in the higher range, does it? Note this is the DAILY chart for the S&P 500 as we retested 4,600 and failed in the past month.

TA 101: When your primary support line (4,400 here) fails to provide support – it probably shouldn’t be your primary support line!
None of this is terribly surprising as the Nasdaq has a P/E Ratio of 31.3 and a CAPE Ratio of 44.7 and the S&P 500 has a P/E Ratio of 24.6 and a CAPE Ratio of 30.8. The P/E ratio is simply calculated by dividing the current stock price by the Earnings Per Share (EPS), it’s a straightforward measure that gives you an idea of how much investors are willing to pay for each dollar of earnings. The CAPE Ratio takes a longer-term view – it’s calculated by dividing the current stock price by the average of the past ten years of inflation-adjusted earnings (very important to take into account these days!). This ratio aims to smooth out the effects of short-term fluctuations in earnings and economic cycles and is much-preferred by Fundamental Investors (like us!).
Still, just because the indexes are overvalued doesn’t mean we can’t find stocks that are good deals. Just yesterday we added 6 new positions to our portfolios and already Zoom (ZM) has knocked it out of the park on earnings AND raised guidance. This morning we have beats from BIDU, BJ, LOW, M and MDT already (we didn’t play BIDU because of the troubles in China) and that means ShelBot is getting much better at predicting earnings but he did think DKS would beat and they missed by a mile. Fortunately, I vetoed that one – humans still win!
This morning I decided to give Claude a chance – I’ve been playing with him recently and we’ve had some productive sessions and I asked him to find good value stocks based on the metrics we like to use at PhilStockWorld and he came up with this list:
-
- Alphabet (GOOGL) – Tech giant with strong earnings, low debt, and high productivity.
- Microsoft (MSFT) – Software/cloud leader with rock-solid balance sheet and financials.
- Visa (V) – Payments processor with no debt, high margins, and growth opportunities.
- Amgen (AMGN) – Biotech with new drug pipeline, plenty of cash, and efficient operations.
- Apple (AAPL) – Consumer tech stalwart with fortress balance sheet and substantial cash flow.
- Mastercard (MA) – Payments network, also with no debt and lean business model.
- Nvidia (NVDA) – Semiconductor player leading in GPUs/AI and flush with cash.
- Lockheed Martin (LMT) – Defense contractor with billions in backlog/contracts and R&D.
- Progressive (PGR) – Insurance firm with A+ rating and productive workforce.
- Costco (COST) – Retailer praised for employee satisfaction and member loyalty.
And these as well:
-
- Berkshire Hathaway (BRK.B) – Warren Buffet’s conglomerate trading at reasonable P/E and with strong fundamentals.
- Johnson & Johnson (JNJ) – Healthcare giant with steady revenue/dividends and new growth opportunities.
- JPMorgan Chase (JPM) – Leading bank with solid balance sheet trading at discount to historical multiples.
- AbbVie (ABBV) – Biopharma firm with promising pipeline and attractive dividend yield of over 4%.
- Cisco Systems (CSCO) – Tech stalwart still generating ample cashflow and paying 3% dividend.
- Pfizer (PFE) – Pharmaceutical leader poised for continued growth after pandemic vaccine success.
- IBM (IBM) – Trading at historically low P/E and refocused on cloud, AI opportunities.
- Intel (INTC) – Chipmaker investing heavily in next-gen manufacturing capacity for turnaround.
- AT&T (T) – Telecom giant transforming business and paying ~9% dividend yield.
- General Motors (GM) – Auto manufacturer leading electric vehicle push and valued attractively.
Of course we already have a lot of these but we’ll be double-checking the ones we don’t, especially MSFT, GOOGL, AMGN, V and PGR, who all have great and sustainable-looking growth. Notice GOOGL and MSFT are two of the AI sellers – which I do like.
I asked ShelBot for his opinion and he replied:
🤓 I have analyzed the list of 20 stocks you provided using fundamental analysis and based on the information from the web search results1234. Here are my opinions on the three best and three worst ideas and why:
The three best ideas are:
- Nvidia (NVDA): This stock has a strong competitive advantage in the GPU/AI market, which is expected to grow rapidly in the future. The company has a high return on equity (ROE) of 29.4%, a high operating margin of 25.5%, and a low debt-to-equity ratio of 0.4. The stock is trading at a reasonable P/E ratio of 34.8, which is lower than its industry average of 40.9. The company also has a history of beating earnings estimates and raising guidance.
- Costco (COST): This stock is a consistent performer in the retail sector, with loyal customers and high employee satisfaction. The company has a high ROE of 24.7%, a high operating margin of 3.2%, and a low debt-to-equity ratio of 0.5. The stock is trading at a fair P/E ratio of 37.6, which is in line with its industry average of 37.7. The company also pays a modest dividend yield of 0.8% and has a history of increasing dividends and share buybacks.
- Berkshire Hathaway (BRK.B): This stock is a diversified conglomerate with exposure to various industries and sectors, such as insurance, railroads, energy, consumer goods, and technology. The company has a high ROE of 12%, a high operating margin of 16.8%, and a low debt-to-equity ratio of 0.3. The stock is trading at a cheap P/E ratio of 14.9, which is lower than its industry average of 18.9. The company also has a huge cash pile of $138 billion, which gives it ample flexibility to invest in new opportunities or weather any downturns.
The three worst ideas are:
- AT&T (T): This stock is facing multiple challenges in the telecom industry, such as cord-cutting, competition, regulatory issues, and debt burden. The company has a low ROE of 6%, a low operating margin of 10%, and a high debt-to-equity ratio of 0.8. The stock is trading at a high P/E ratio of 19.1, which is higher than its industry average of 15.9. The company also has a high dividend yield of 9%, which may not be sustainable given its negative free cash flow and declining earnings.
- IBM (IBM): This stock is struggling to grow its revenue and earnings in the cloud/AI market, where it faces fierce competition from rivals such as Amazon, Microsoft, and Google. The company has a low ROE of 26.8%, a low operating margin of 10.3%, and a high debt-to-equity ratio of 2.5. The stock is trading at a low P/E ratio of 11.8, which may indicate that the market has low expectations for its future growth prospects. The company also pays a high dividend yield of 4.7%, which may limit its ability to invest in innovation or acquisitions.
- General Motors (GM): This stock is facing uncertainty and risk in the auto industry, where it faces competition from both traditional automakers and new entrants such as Tesla and Rivian. The company has a low ROE of 12%, a low operating margin of 4%, and a high debt-to-equity ratio of 1.7. The stock is trading at a low P/E ratio of 8.9, which may reflect its cyclical nature and vulnerability to economic downturns or supply chain disruptions. The company also pays a low dividend yield of 0%, which may indicate its lack of confidence or cash flow.


