

Visualizing U.S. GDP by Industry in 2023
Visualizing U.S. GDP by Industry
The U.S. economy is like a giant machine driven by many different industries, each one akin to an essential cog that moves the whole.
Understanding the breakdown of national gross domestic product (GDP) by industry shows where commercial activity is bustling and how diverse the economy truly is.
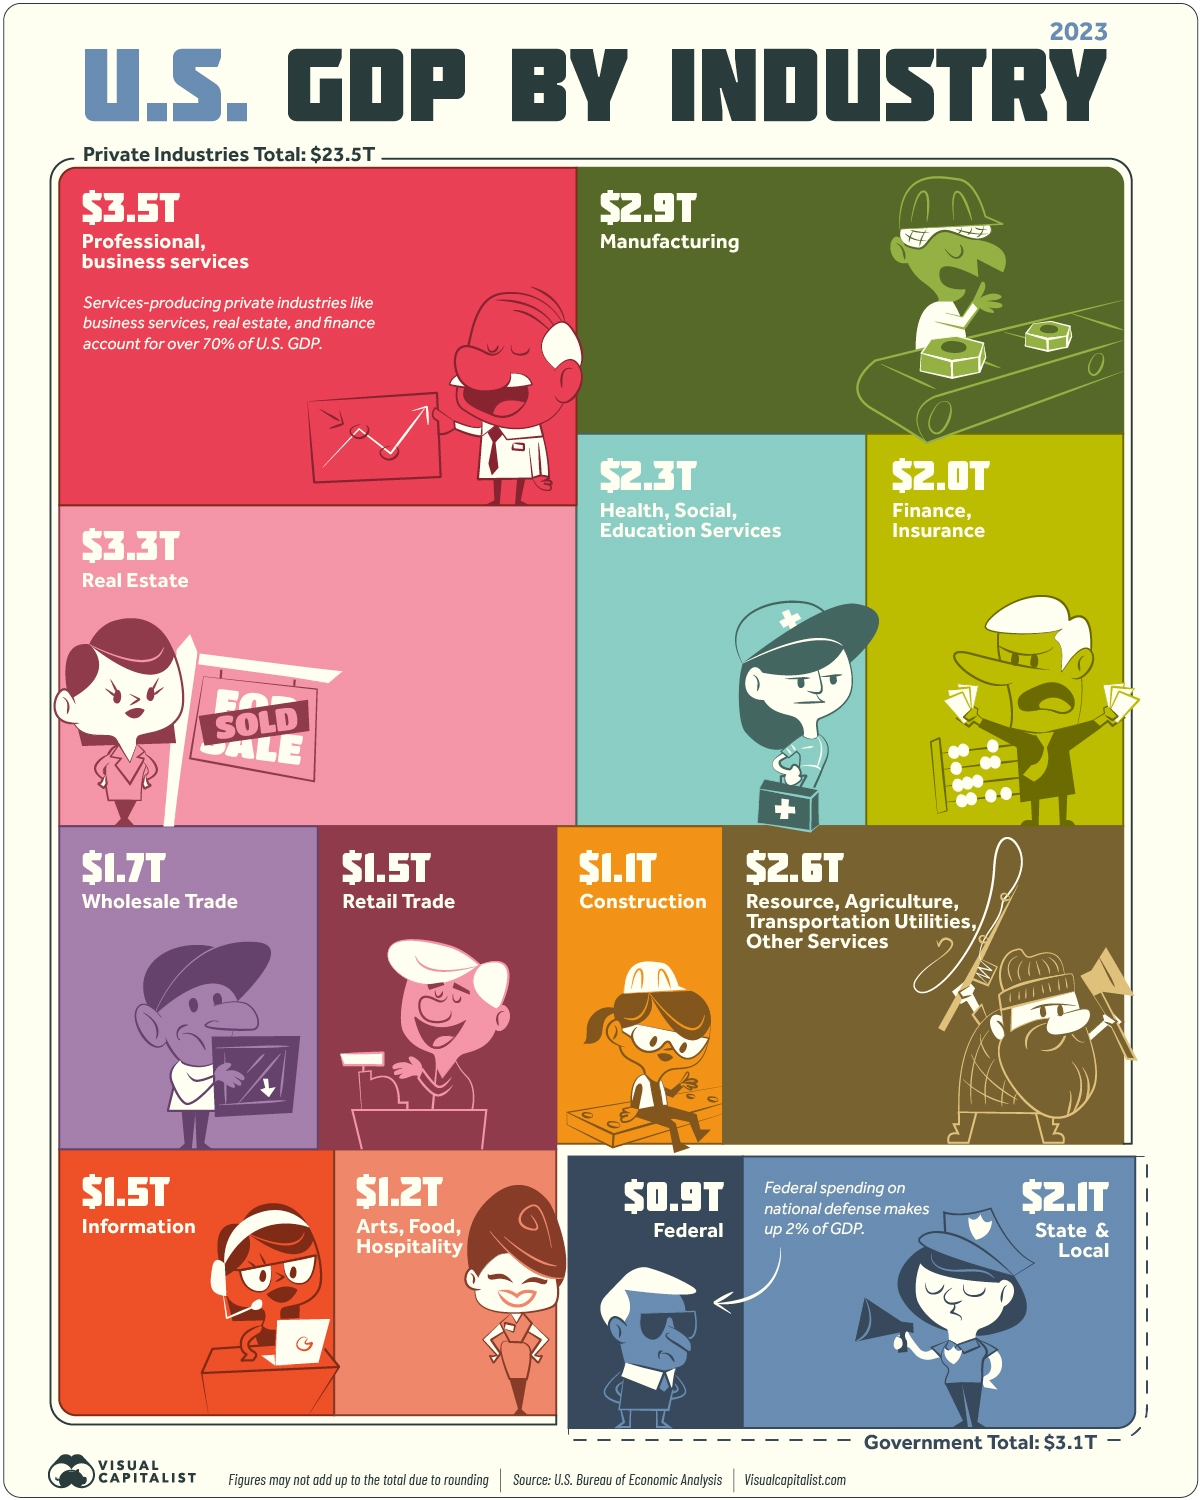
The above infographic uses data from the Bureau of Economic Analysis to visualize a breakdown of U.S. GDP by industry in 2023. To show this, we use value added by industry, which reflects the difference between gross output and the cost of intermediate inputs.
The Top 10 U.S. Industries by GDP
As of Q1 2023, the annualized GDP of the U.S. sits at $26.5 trillion.
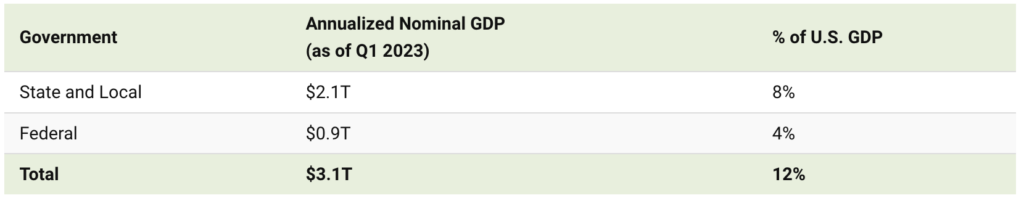
Of this, 88% or $23.5 trillion comes from private industries. The remaining $3 trillion is government spending at the federal, state, and local levels.
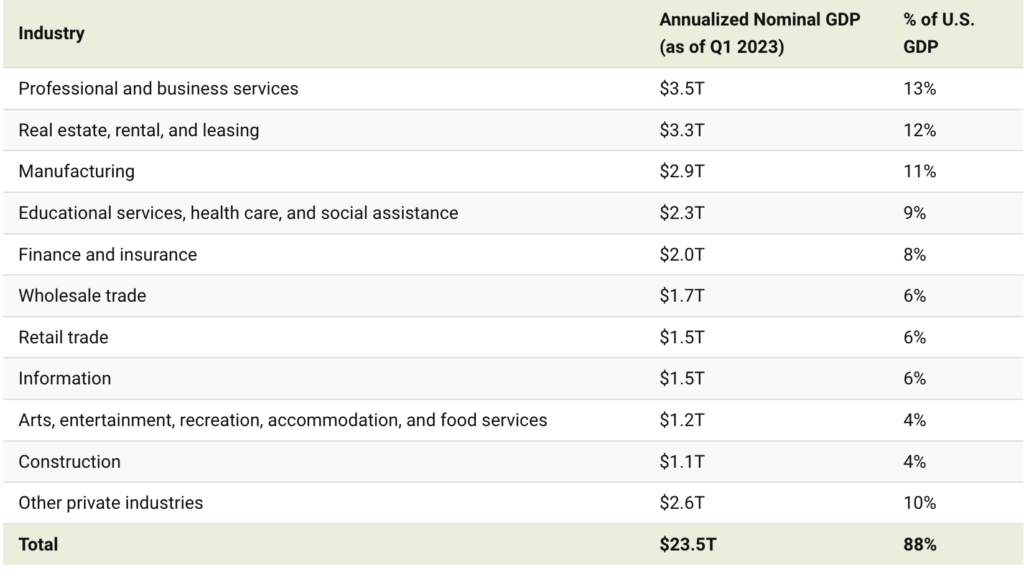
Here’s a look at the largest private industries by economic contribution in the United States:
Like most other developed nations, the U.S. economy is largely based on services.
Service-based industries, including professional and business services, real estate, finance, and health care, make up the bulk (70%) of U.S. GDP. In comparison, goods-producing industries like agriculture, manufacturing, mining, and construction play a smaller role.
Professional and business services is the largest industry with $3.5 trillion in value added. It comprises establishments providing legal, consulting, design, administration, and other services. This is followed by real estate at $3.3 trillion, which has consistently been an integral part of the economy.
Due to outsourcing and other factors, the manufacturing industry’s share of GDP has been declining for decades, but it still remains a significant part of the economy. Manufacturing of durable goods (metals, machines, computers) accounts for $1.6 trillion in value added, alongside nondurable goods (food, petroleum, chemicals) at $1.3 trillion.
The Government’s Contribution to GDP
Just like private industries, the government’s value added to GDP consists of compensation of employees, taxes collected (less subsidies), and gross operating surplus.
Figures may not add up to the total due to rounding.
State and local government spending, largely focused on the education and public welfare sectors, accounts for the bulk of value added. The Federal contribution to GDP amounts to roughly $948 billion, with 52% of it attributed to national defense.
The Fastest Growing Industries (2022–2032P)
In the next 10 years, services-producing industries are projected to see the fastest growth in output.
The table below shows the five fastest-growing industries in the U.S. from 2022–2032 in terms of total output, based on data from the Bureau of Labor Statistics:
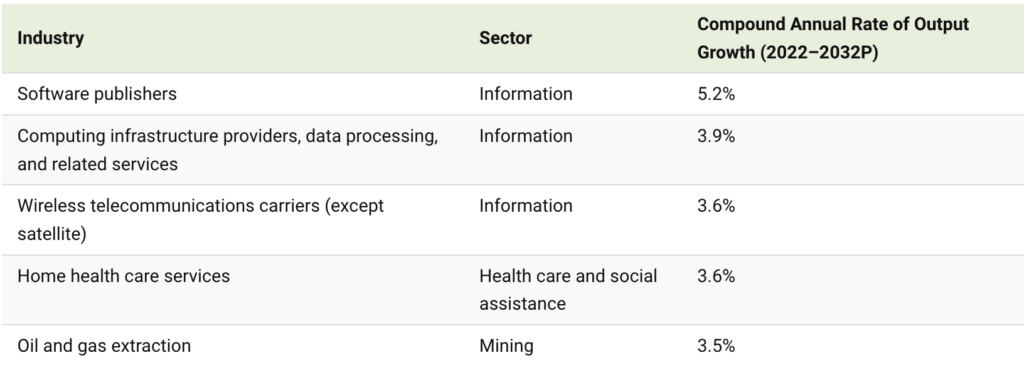
Three of the fastest-growing industries are in the information sector, underscoring the growing role of technology and digital infrastructure. Meanwhile, the projected growth of the oil and gas extraction industry highlights the enduring demand for traditional energy sources, despite the energy transition.
Overall, the development of these industries suggests that the U.S. will continue its shift toward a services-oriented economy. But today, it’s also worth noticing how services- and goods-producing industries are increasingly tied together. For example, it’s now common for tech companies to produce devices, and for manufacturers to use software in their operations.
Therefore, the oncoming tide of growth in service-based industries could potentially lift other interconnected sectors of the diverse U.S. economy.