 $427,611!
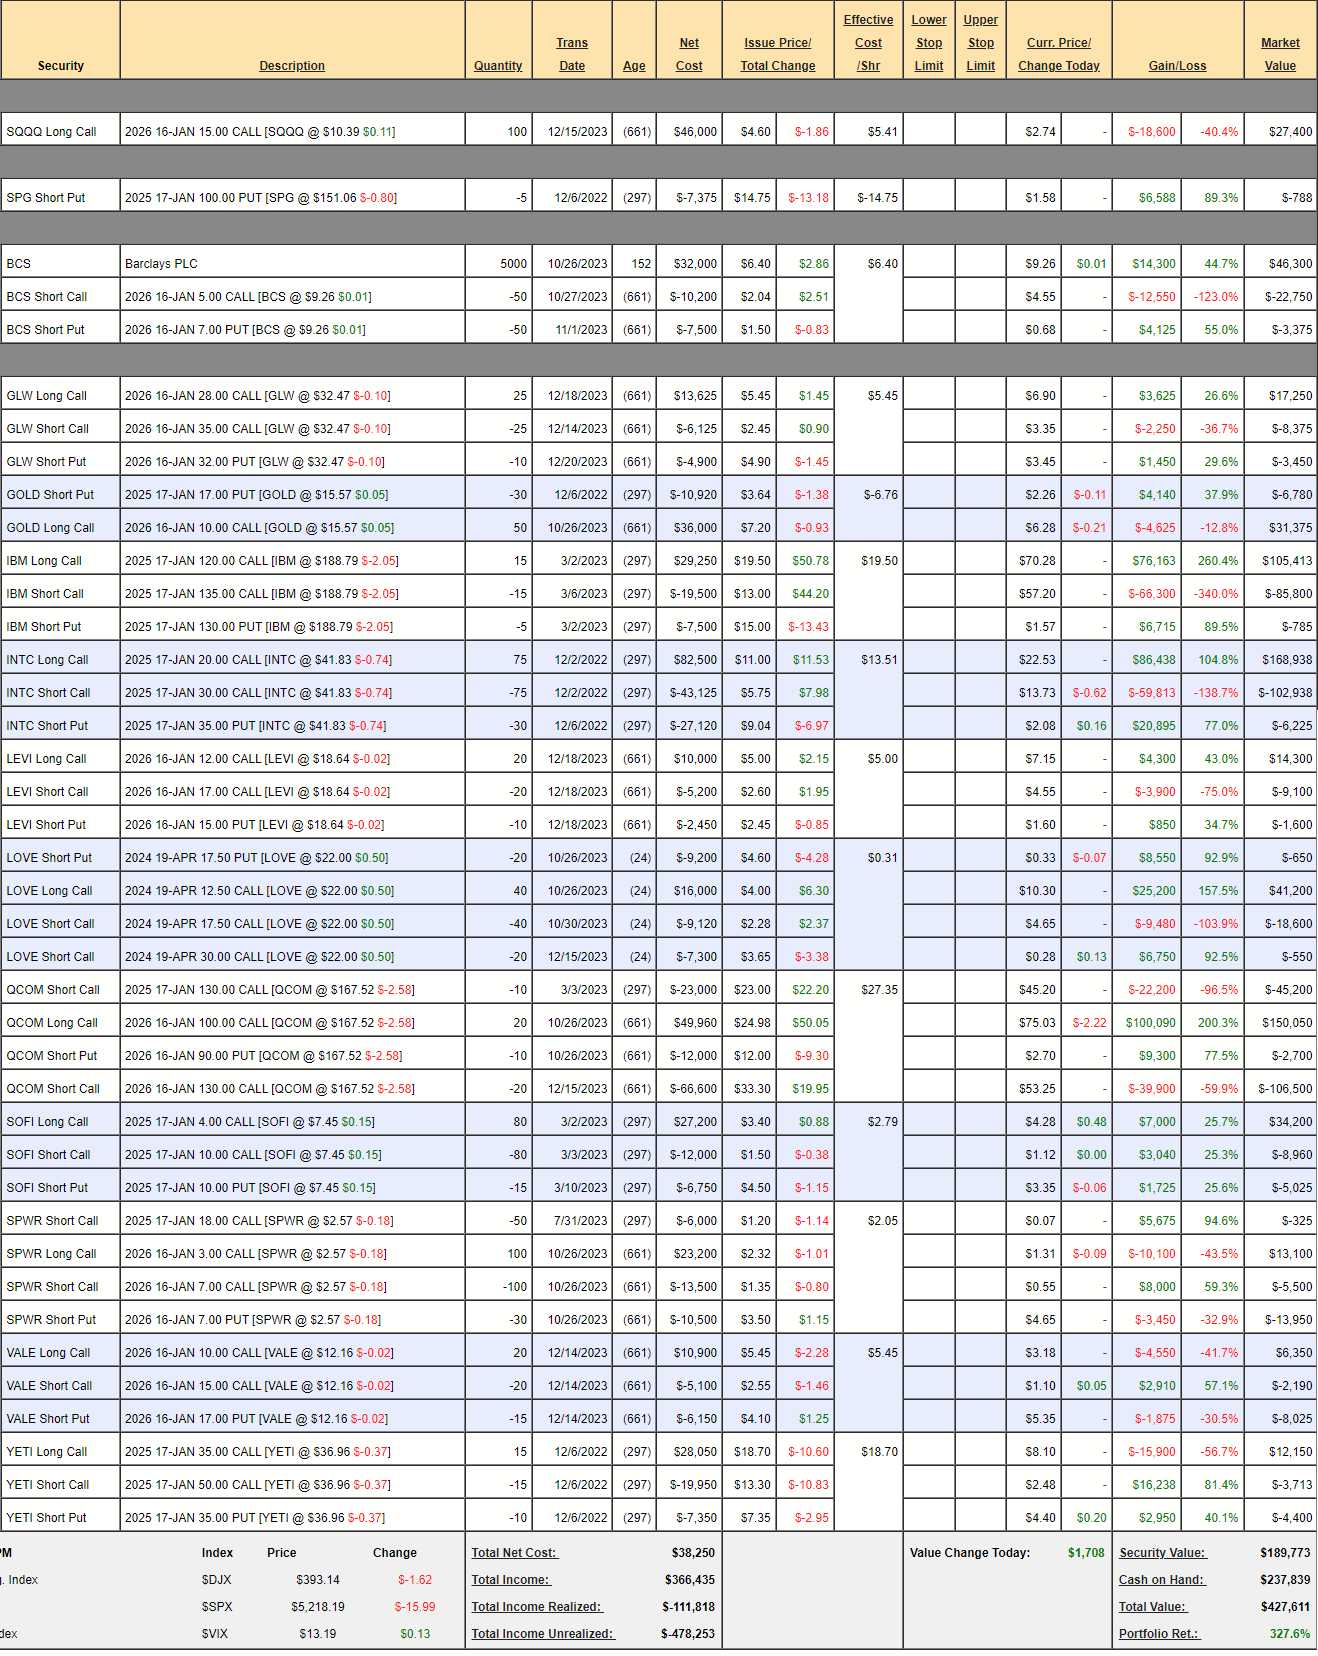
That’s down $17,783 (3.9%) since our December 14th Review and I don’t regret it as we were up $75,718 from the October review, and I didn’t want to risk losing our gains during earnings season (we don’t touch this portfolio between shows). Our hedges killed us but we’re still up 327.6% ($327,611) from our $100,000 start back on Nov 13th, 2019 – it’s been a good 4 years!
Can we get to $1M in 2 more years? From our track record, I don’t see why not. As of the least review, we had $198,891 in upside potential from our longs and that’s already almost a 50% gain we have planned and, of course, we’ll add new positions over the next 20+ months to try to find the other $200,000 we’ll need to hit our $1M target – come join us on our journey!
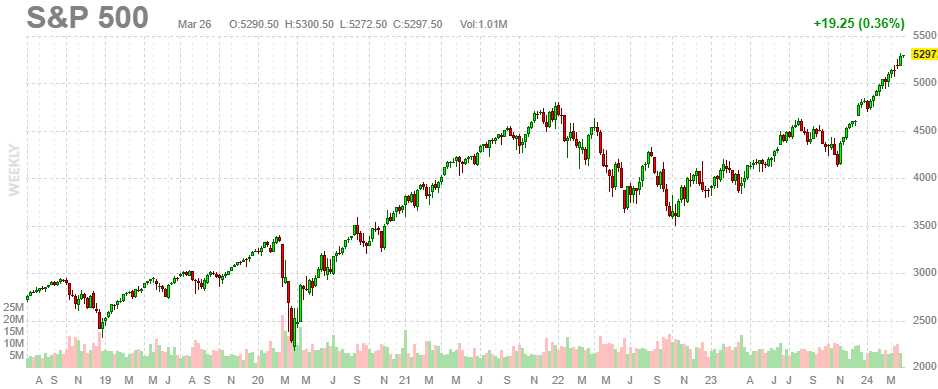
And now, let’s turn to our review and determine what needs to be changed and – even more fun – what needs to be added! As we’ve been cautious, we still have $237,839 (55.6%) in CASH!!! but we’re still being cautious into Q2 earnings as we assess the impact regulatory actions against 3 of the Magnificent 7 will have over the next few months. On the whole, we expect a 10% pullback in the Nasdaq.
-
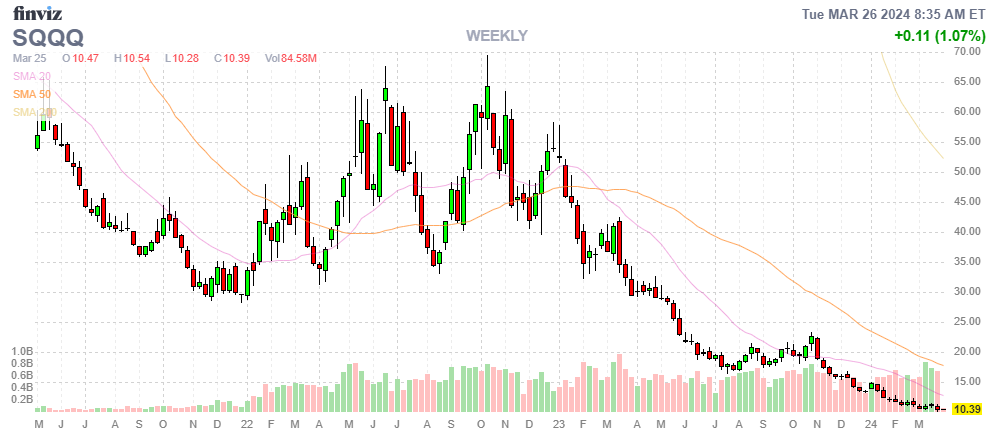
- SQQQ – Ouch, we took a big hit on these, causing more than all of our net losses in the Portfolio. With SQQQ now at $10.36, even a 20% drop in the Nasdaq would only push these calls up 60% (3x inverse ETF) to $16.57 (you should ALWAYS do the math on your hedges!) – so this is a useless hedge BUT it’s worth $27,400 so let’s cash it out and pick up 100 of the 2026 $5 ($6)/15 ($2.74) bull call spreads at net $3.26 ($32,600).
- That’s a net $100,000 spread that’s $53,900 in the money and it gives us $66,100 (202%) of upside (downside?) potential if SQQQ hits $15 (a 20% drop in the Nasdaq). It’s still possible that this spread will annoy us – especially if SQQQ reverse-splits, which is very likely if the Nasdaq punches higher but, for now – I’d rather have the protection than not.
-
- SPG – We have to wait a year to collect the last $788 but we don’t need the money/margin and the puts are so far out of the money, they aren’t worth cashing out.
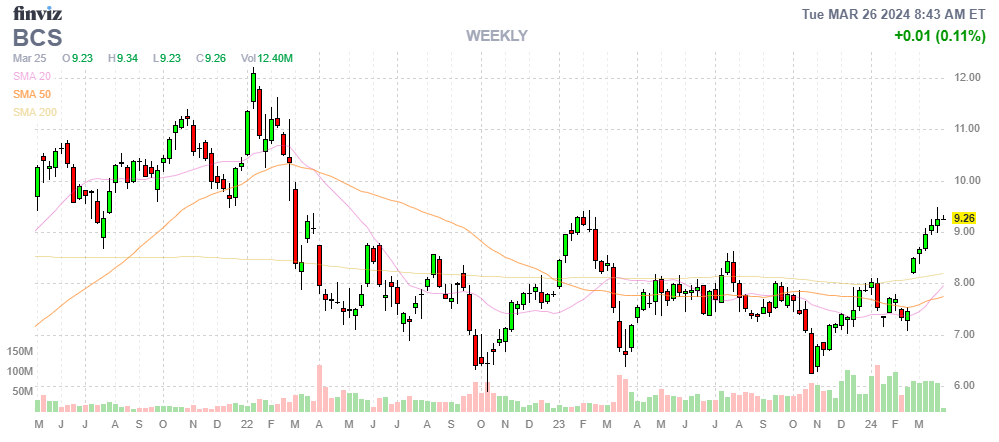
- BCS – Just paid us a lovely 0.27 ($1,350) dividend on Feb 29th and we only paid net $14,300 for the spread so that’s 9.6% PER QUARTER in dividends we’re collecting so we can anticipate 7 more for $9,450 before we are called away at $25,000 which is $34,450 vs the current net of $20,175 so we have $14,275 (70.7%) of upside potential and we’re miles in the money so it’s a fairly low-risk trade if you were to take it from scratch!
-
- GLW – Already almost at goal on this $17,500 spread that’s still only net $5,425 so there’s $12,075 (222%) upside potential here – easy money! And we started at net $2,600 just a few months ago – already a double!
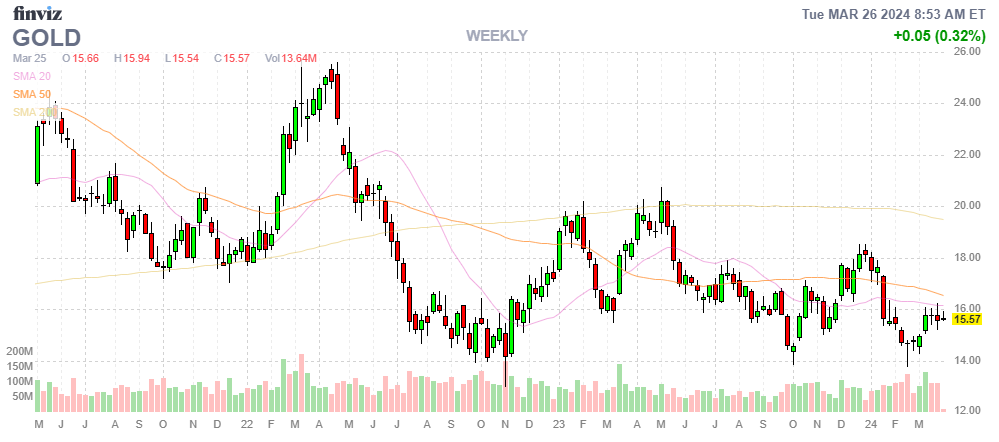
- GOLD – I am so glad we left this one aggressive but I think GOLD still has a lot of room to rise as it’s lagging way behind the rise of Gold (/GC). I think $20 is fair and that would be $50,000 and, currently, we’re at net $24,595 but we’ll eventually sell the $20 calls, now $1.50 ($7,500) for at least $10,000 and put that money back to work but, for now, let’s call it $25,405 (103%) upside potential at $20.
-
- IBM – Here we’re at net $18,828 on the $22,500 spread and, like SPG, we’re so deep in the money that there’s no point in cashing it in as we still have $3,672 (19.5%) left to make and that’s more than the cash would pay us so – unless we decide to put the money to work – it may as well sit here and make 19.5% in 10 months, right?
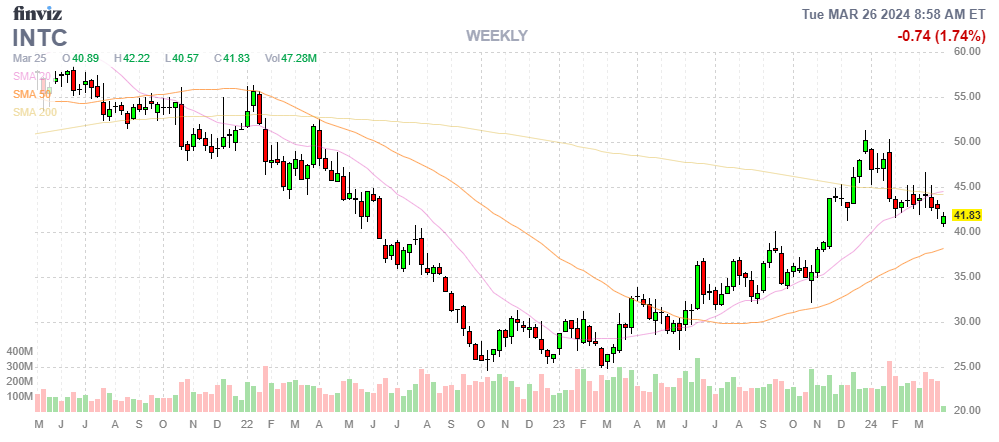
- INTC – Another one miles over our target at net $59,775 on the $75,000 spread so we’ve still got $15,225 (25.4%) left to collect, also in just 10 months.
-
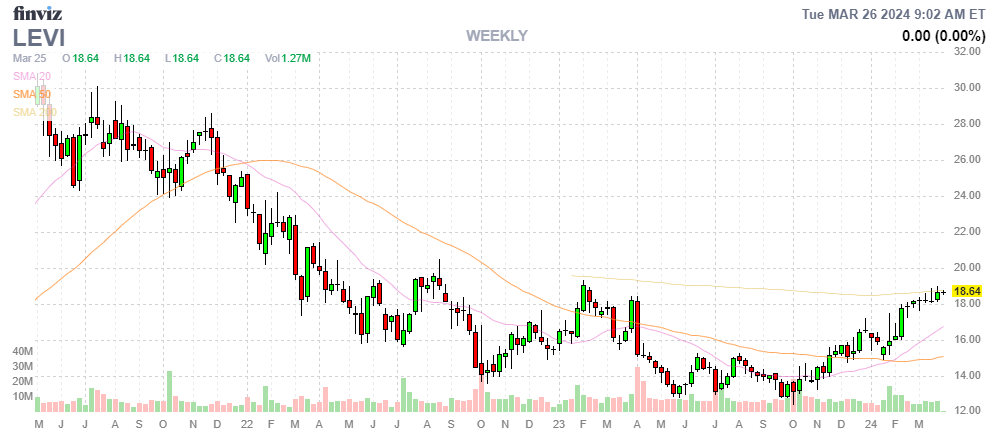
- LEVI – Already over our target after just 3 months! Still just net $3,600 on the $10,000 spread so this one has $6,400 (177%) left to gain if LEVI simply stays over $17 for 22 months. Only good for a new trade if you like money! 😉
-
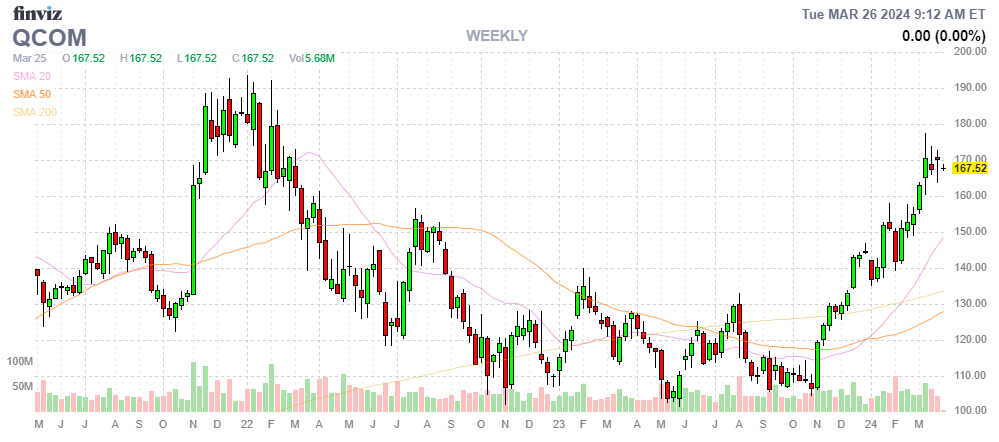
- QCOM – The short Jan calls are killing us and our 2026 $100/130 spread is miles in the money at net $43,550 so let’s cash that out and pick up 40 of the 2026 $150 ($41.50)/175 ($30) bull call spreads at net $46,000 and we’ll roll the 10 short Jan $130 calls at $45.20 ($45,200) to 10 short Jan $170 calls at $21 ($21,000) and 15 short June $175 calls at $8.30 ($12,450). That gets us back on a path to selling premium at an adjustment cost of $14,200 (comes out of cash) which means the spread is now net $29,350 on the $100,000 spread with $70,650 upside potential at $175. Next month, the cash will be less and the spread will be net more but we like to look at things as they are now when reviewing.
-
- SOFI – I expect another pop on earnings (late April). Net $20,215 on the $48,000 spread has $27,785 (137%) upside potential but that’s only if I’m right about April – otherwise we’ll have to adjust.
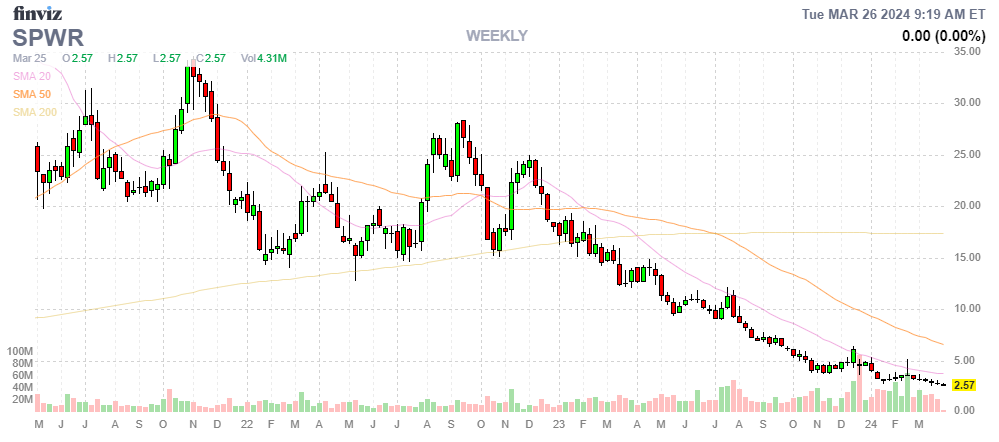
- SPWR – Total meltdown! Can they really be so off-kilter that none of the Billions of Dollars in stimulus will rain on their order books? 2026 is a long way away so let’s just take advantage to roll the 30 2026 $7 puts at $4.65 ($13,950) to 60 of the 2026 $4 puts at $2.25 ($13,500) but, as we did last quarter, I’m certainly not counting on this spread as having upside potential – we’ll be thrilled to get even!
-
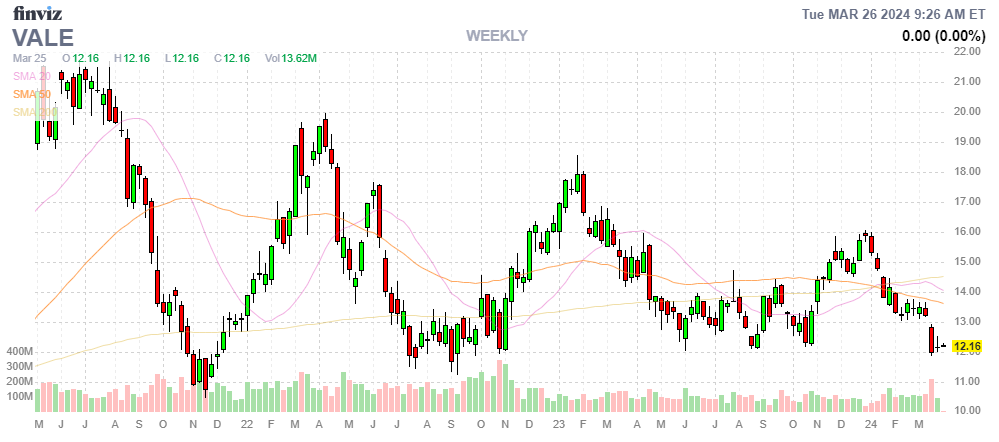
- VALE – Our Trade of the Year is off to a poor start so LET’S BUY MORE! The company didn’t do anything wrong, Iron Ore prices just crashed but this should be the bottom for both so let’s buy back the short 2026 $15 calls ($2,190) and buy 20 more 2026 $10 calls for $3.18 ($6,350) and now we have a much more aggressive position. I would say $17 is a very fair target and that would be $28,000 against our current net $12,405 debit so we have $60,405 (486%) upside potential on this one.
-
- YETI – Last year’s Trade of the Year has pulled way off it’s $52 high but competition is way up so let’s see how Q1 earnings look before trying to capitalize on the pullback. Another one I’m not going to count on for upside potential given the uncertainty.
So our 14 open trades have $235,680 (55.1%) of upside potential and we are protected from a 20% drop with a $66,100 hedge so now it’s time to look at what we can add to our portfolio this quarter:
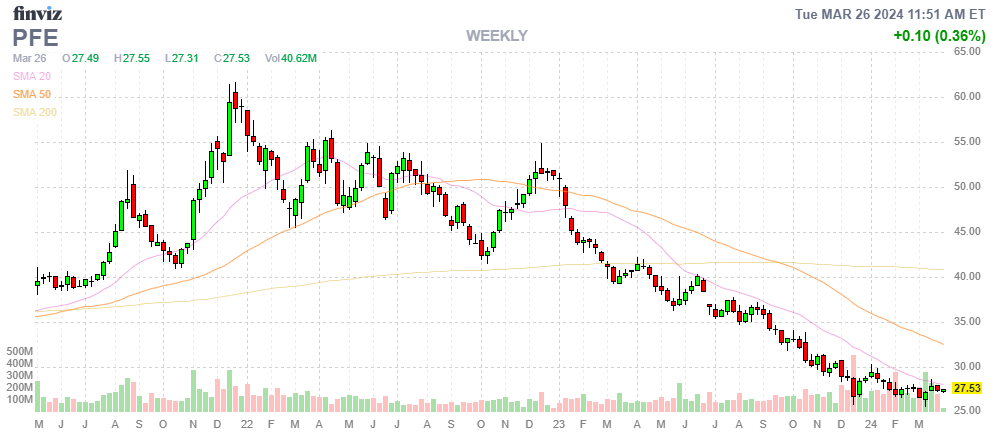
Pfizer (PFE) is a must-have at $27.46, which is $155Bn and, even post-Covid, they are still banking $14Bn in annual net profits so call that 11 times earnings and, if Covid comes back – you’ll be happy!
Can’t argue with that kind of gallows logic and, thanks to options, we don’t need PFE to go up, we just need them not to go down and, since down is less than 10x earnings – I feel pretty good about that bet.
So, for the Money Talk Portfolio, let’s:
-
- Sell 10 PFE 2026 $30 puts for $5.25 ($5,250)
- Buy 25 PFE 2026 $22.50 calls for $6.50 ($16,250)
- Sell 25 PFE 2026 $30 calls for $3 ($7,500)
That’s net $3,500 on the $18,750 spread so there’s net $15,250 (435%) upside potential at $30 but we’re already at $27.50 so, if we expire here, our bull spread is at net $12,500 and we would have to give back $2,500 on the short puts (but we’d roll them) and that’s still net net $10,000 for a gain of $6,500 (185%) if PFE simply holds $27.50 – aren’t options fun?
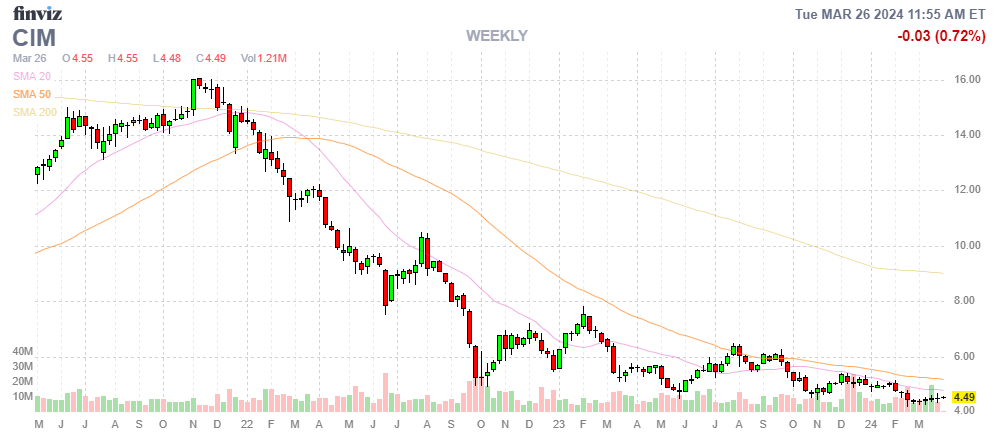
Chimera Investments (CIM) is a well-run RET at $4.49 that pays a 0.70 (15.6%) dividend but we can assume they’ll cut it in half and it’s still almost 8% and here’s the magic trick for owning them using options:
-
- Buy 5,000 shares of CIM at $4.49 ($22,450)
- Sell 50 Jan 2025 $5 calls for 0.32 ($1,600)
- Sell 50 Jan 2025 $5 puts for $1 ($5,000)
That drops our net entry on 5,000 shares to $15,850 ($3.17) and, if we are assigned another 5,000 shares at $5 we’ll have 10,000 shares at $4.085, which is 10% below the current price – that’s our WORST case. Best case is that, in less than a year, we get called away for $25,000 and we collect 4 dividend payments for $3,500 for a potential profit of $12,650 (79.8%) in less than a year!
So there’s 2 new Trade Ideas that have the potential to add another $19,150 in profits and THAT is how we continue to build our returns towards our $1M goal.


