 $21,635!
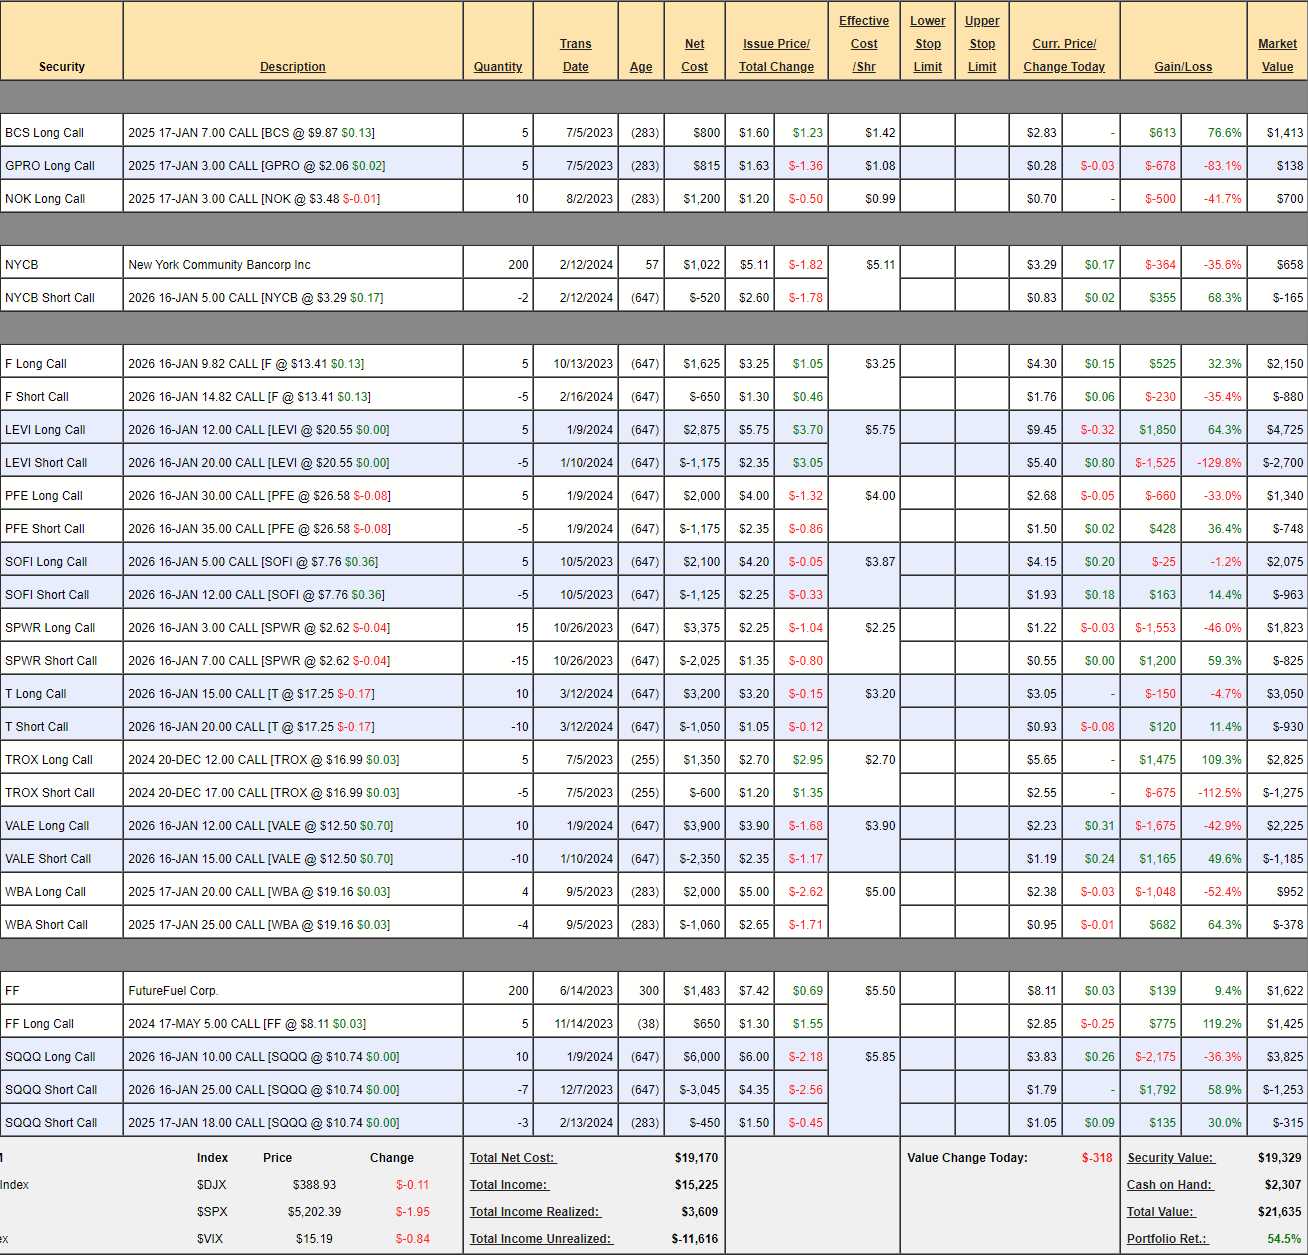
Including this week’s $700, we have a starting basis of $14,000 since Aug 25th, 2022 and a profit of $7,636 (54.5%) – up $1,011 (5.1%) since our March 12th Review, where we only made 1 adjustment (FF) and added one new position (T). Overall, we’re up 54.5% in 19 months and miles ahead of our 10% annual goal and that allows us to take a few more risks – but it doesn’t allow us to be reckless!
At this pace, call it 30% per year, it will only take us 13 years to get to our $1M goal but, so far – you haven’t missed much as we’re effectively going to take $19,655 and make $1M over the next 12 years! You can go over months 1, 2, 3, 4, 5, 6, 7, 8, 9, 10, 11, 12, 13, 14, 15, 16, 17, 18 and 19 to see all the moves we’ve made to get this far. This is a small portfolio, which means we can’t use all of our favorite option techniques yet – but it’s a great way to learn how to get started on a wealth-building adventure.
As of our review on Feb 9th, we had $14,551 of upside potential in the existing trades, that would be good for another 74% gain over the next two years (if all goes well) but of course we’ll be adding new trades along the way. We’ll make sure we sum things up this month as well – to make sure we’re on track for Q2:
-
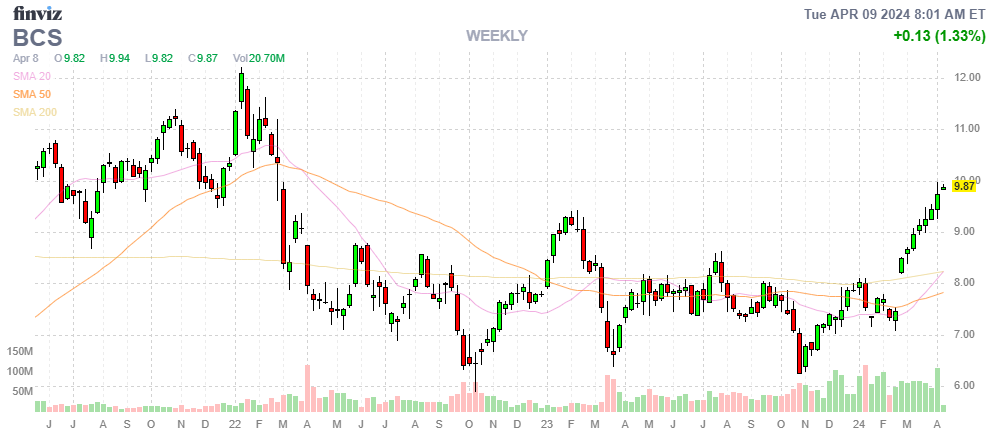
- BCS – Of course they are going to struggle at $10 and earnings are on the 20th so, should we risk it or cash out or cover? We only have $2,307 in cash so I’m inclined to take $1,413 off the table and find a fresh horse to ride. If we sell the 2026 $10 calls, those are $1.70 ($240) plus $1,500 for the spread is $1,740, which is $327 (23.1%) more over 2 years – surely we can do better and it isn’t risk-free so covering doesn’t make sense and we don’t have so much money that we can risk it – so I guess we’re cashing out!
-
- GPRO – Earnings (2/7) were no help. Revenues were down 47% from last year and the company lost $2M for Q3. While I think $308M ($2.06) is a great deal for a company with a great brand name and $1Bn in sales (and $150M in CASH!!! net of debt!) – I can’t justify putting more money into it but I don’t mind letting our $138 ride into the May earnings report – just in case they announce something or get bought.
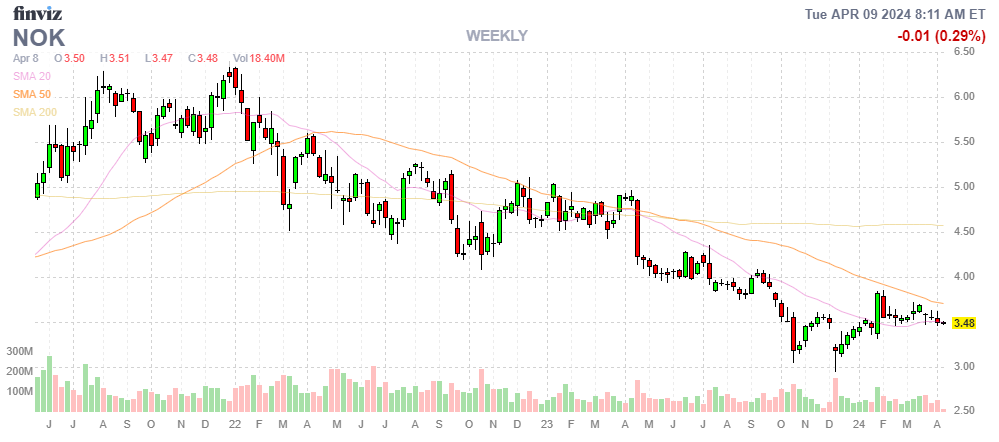
- NOK – Earnings on the 18th, so we’ll see. $3.48 is $19.3Bn and these guys make $1.8Bn so 11x and $3Bn in CASH!!! makes them interesting to me but let’s see how earnings look before making any decisions.
Note none of the above have any expectations of upside potential (BCS because we’re cashing out).
-
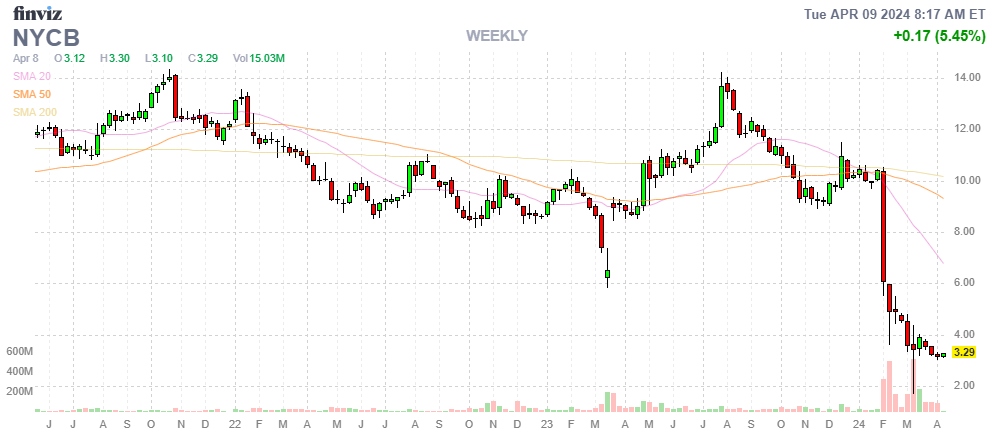
- NYCB – We’re not going to look this gift horse in the mouth so we’ll buy back the short $5 calls ($658) with a 68% profit and I do expect $5 by 2026 and that would be $1,000 for a $342 (51.9%) upside potential. Finally a green! We might even get a $100 (15%) dividend in mid-May!
-
- F – We’ve been adjusted for the special dividend that our shareholders collected. We’re on track for the full net $2,500 at net $1,270 so $1,230 (96.8%) left to gain if F is over $14.82 in Jan 2026. Sounds good to me!
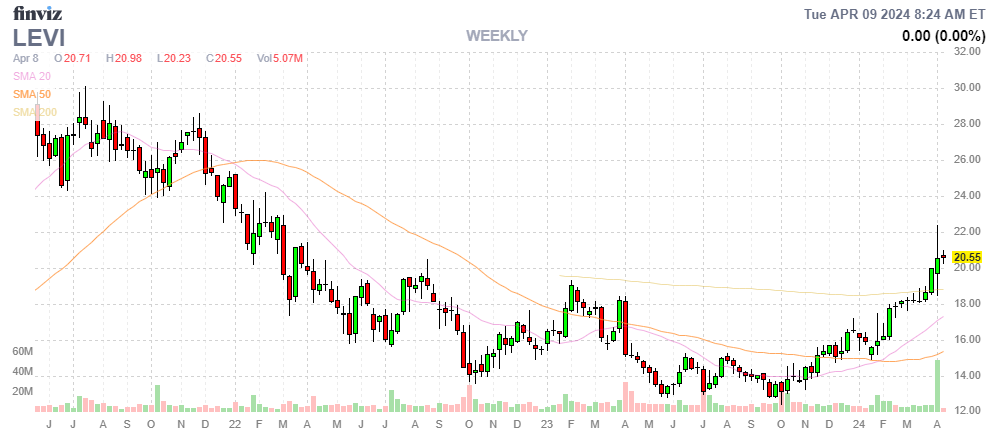
- LEVI – Also on track at net $2,025 on the $4,000 spread so $1,975 (97.5%) left to gain is just lovely…
-
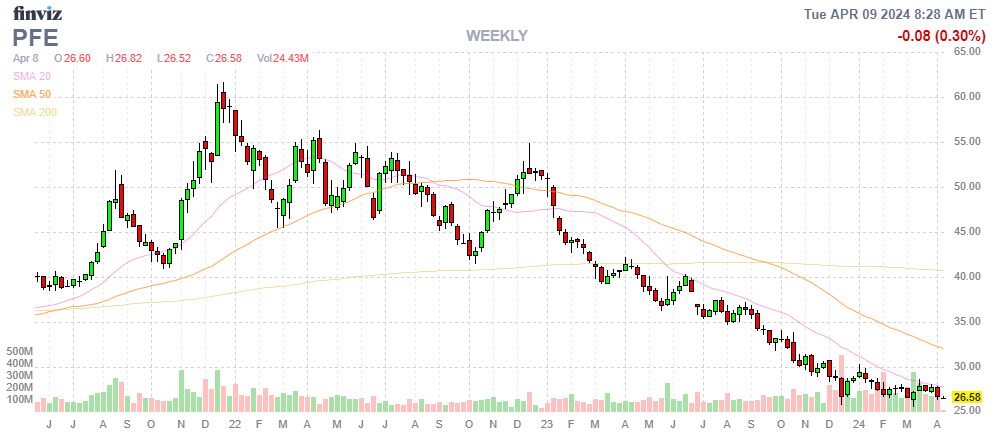
- PFE – The money train is leaving the station! It’s a $1,500 spread we picked up for net $825 and now it’s net $592 and I think, with $908 (153%) left to gain – I can’t think of a better place to put money so let’s double down on this one.
-
- SOFI – Another one that’s tempting to DD on at net $1,112 on the $3,500 spread. That’s $2,388 (214%) upside potential. So tempting…
- SPWR – Still a disaster. $7 seems far away so we’re not going to count on it and we’ll see how mid-May earnings look.
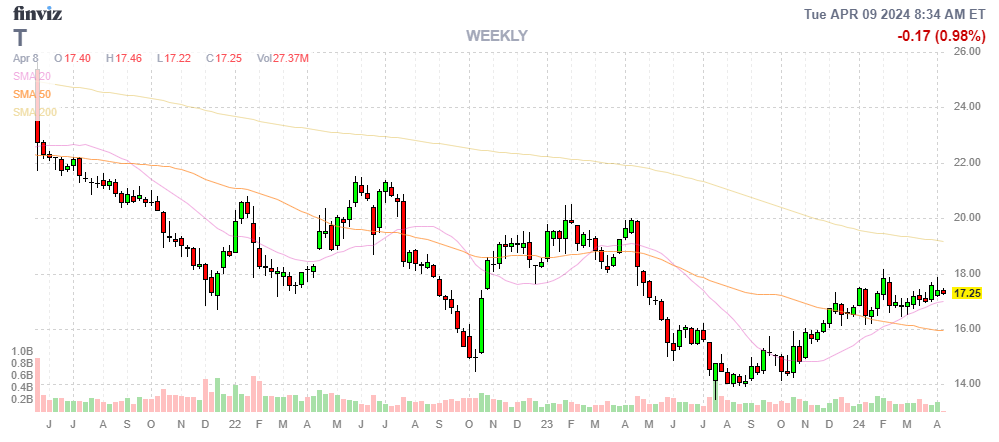
- T – We just added this one and we’re down $30 but it’s net $2,120 on the $5,000 spread so we have $2,880 (135%) left to gain at $20+ in 20 months.
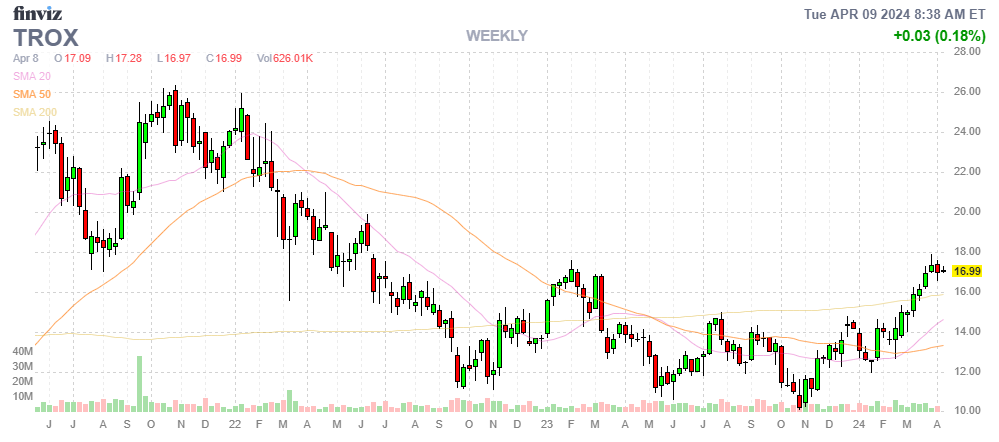
TROX – Leaped to our goal already! Still only net $1,550 on the $2,500 spread so $950 (61.2%) left to gain if we can hold $17 into December.
-
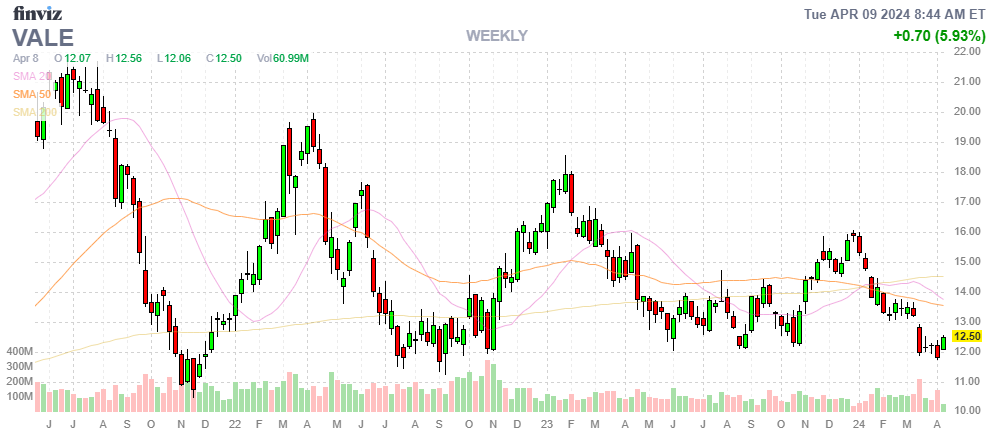
- VALE – Our Trade of the Year is off to a poor start at net $1,040 on the $3,000 spread so we have $1,960 (188%) left to gain. Are we better off buying back the short calls for $1,165 or doubling down for roughly the same amount? We’ll going naked is risky and we’re only going to re-cover at $16 and maybe the $17 calls will be $2.20 instead of 0.70 so +$1,500 if that goes perfectly but another spread, that pays off at $15 will give us $3,000 back for $1,040 so yes, let’s double down! ($1,040) Now $3,920 left to gain!
-
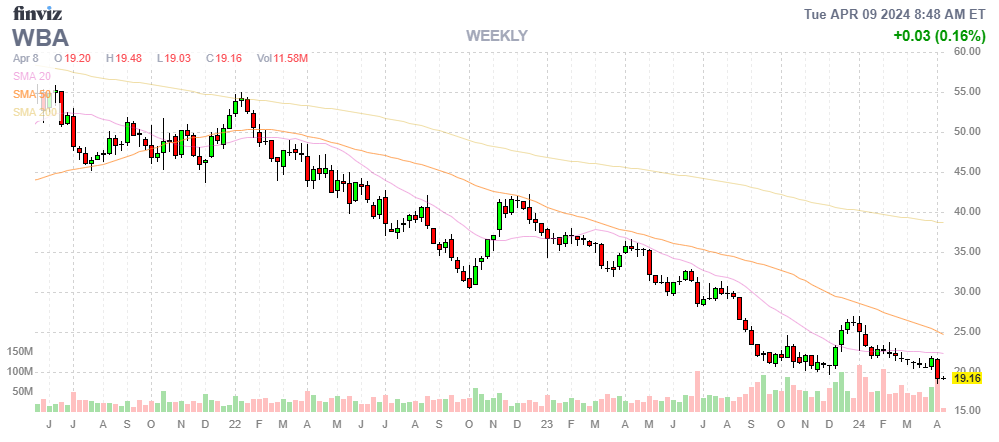
- WBA – I’m tempted to spend money here but we spent plenty already and earnings just disappointed so I don’t think there’s a hurry. I still expect $25 but I worry about the time-frame so I’m not going to expect any profits until we see the next earnings – in 3 months…
-
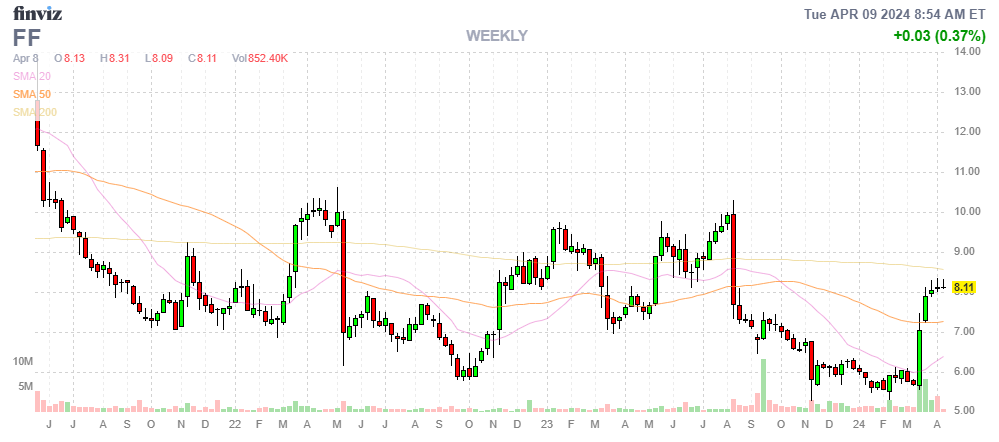
- FF – We just doubled down on them and GREAT TIMING as they blasted higher (told you so!). We bought long calls and it would be foolish not to cash in the May $5s with a 119% profit so let’s take that $1,425 off the table and that leaves us with $1,622 in the stock and we can sell the Dec $7.50 calls for $1.45 ($290 – 17.8%) but not really as we’d be taking a $122 haircut on the stock vs just cashing it in so I guess the fun is over and we’ll cash in the stock for $8.20 ($1,640) as well.
-
- SQQQ – Our hedge is at net $2,257 but we need to focus on the calls, which are currently $3.83 with SQQQ at $10.74 and a 20% drop in the Nasdaq would give us a 60% pop in SQQQ to $17.18 and then we’d be $7.18 in the money for $7,180 – so we have $4,923 worth of hedges from this position.
Wow, what a ride! We cashed out net $2,613 after all those moves and that leaves us with net $4,930 left to spend and our existing position have net $15,501 (71.6%) left to gain (of the ones we are fairly certain of – over the next 20 months.
That being the case, let’s improve WBA after all:
-
- Close the existing spread at net $574 and:
- Buy 5 WBA 2026 $12.50 calls for $7.75 ($3,875)
- Sell 5 WBA 2026 $20 calls for $3.85 ($1,925)
That’s net $1,376 spent and we’ve moved from a $1,600 spread that was out of the money to a $3,750 spread that’s almost entirely in the money at net $1,950 so our new net is our old net ($574) plus the cash deployed ($1,376) = $1,950 but now we have very realistic upside potential of $1,800 (92%), bringing the Portfolio’s Potential Total to $17,301 (79.9%) over the next 20 months!
That is called a Salvage Play!
We still have $3,554 in CASH!!! and another $700 coming next month so we’ll have plenty to spend and we might not want to wait – so stay tuned in Member Chat in case we add something sooner.


