 Dow 40,000!
We’re up 30% since October and up 39% since October of 2022. We topped out at 39,900 in March and dropped 2,300 points but we made it all back in the past 30 days and now we’re at an all-time high – again.
Unfortunately, we’re also at an all-time price multiple for the Dow with the 30 index components now trading at 34.95 times their current earnings. And, of course, the Dow is a stupidly price-weighted index, which means a move in the stock’s price, regardless of market cap, is what determines its contribution to the index. And, of course, like all the indexs, it’s all about the top 10 stocks:
| Company | Stock Price Change | Dow Points Contributed |
|---|---|---|
| Microsoft Corp (MSFT) | +$107.08 | +705.38 |
| UnitedHealth Group (UNH) | +$103.55 | +682.13 |
| Goldman Sachs (GS) | +$100.09 | +659.43 |
| Salesforce Inc (CRM) | +$93.54 | +616.13 |
| Home Depot (HD) | +$92.67 | +610.39 |
| Visa Inc (V) | +$86.98 | +572.82 |
| Amgen (AMGN) | +$82.79 | +545.24 |
| Caterpillar (CAT) | +$76.04 | +500.88 |
| McDonald’s Corp (MCD) | +$73.87 | +486.63 |
| American Express (AXP) | +$71.70 | +472.32 |
UNH is a $476Bn company, just 16% the size of MSFT ($3Tn) and UNH is $517 per share so they grew 20% ($95Bn) in market cap while MSFT grew 33% ($1Tn) yet they both are weighted as having equally contributed to the Dow’s growth. Again, this is why we generally ignore the Dow – it’s a useless index!
 Still, all around the World, thanks to 100 years of inertia, it’s the Dow Jones Industrial Average that makes the headlines and even in the US media – the Dow drives the headlines – despite the fact that the only “Industrial” company in the top 10 is Caterpillar – though I guess you could say AMGN MAKES drugs, right?
Drugs are what we’re going to need if we are going to keep buying stocks at 35 TIMES their current earnings. Since 1929, the historical average p/e of the Dow has been 16.87 – we’re talking HALF of the current level (true for all the indexes). In fact, the Dow has only surpassed a P/E of 30 during the height of the dot-com bubble in the late 1990s and briefly in 2009 following the earnings collapse induced by the financial crisis.
It’s worth noting that the Dow’s valuation looks even more stretched when compared to the broader S&P 500. While the S&P 500’s P/E of 27.27 is also way above its historical average, it’s certainly no Dow. This discrepancy underscores how the Dow’s price-weighting methodology can distort the picture compared to the market-cap weighted S&P 500.
It’s also interesting to look at the S&P 500, 10-year trailing earnings – which eliminates the speculative aspects of p/e ratios and gives us an idea of what we’re really paying for – on a performance basis. Note that the rally, since 2009, has really been ALMOST ENTIRELY a multiple rally – we’re now paying 33x ACTUAL earnings when we used to pay 13.3x – that’s kind of insane, actually…

So what would it take to justify the Dow’s current valuation? With a P/E of 34.95, investors are betting on significant earnings growth. To bring the P/E back to a more “normal” level of 16.8, the Dow components would need to collectively double their earnings, even without any further price appreciation. That’s a tall order in any economic environment, no matter how much you think AI will add efficiency or how low the Fed will drop rates.
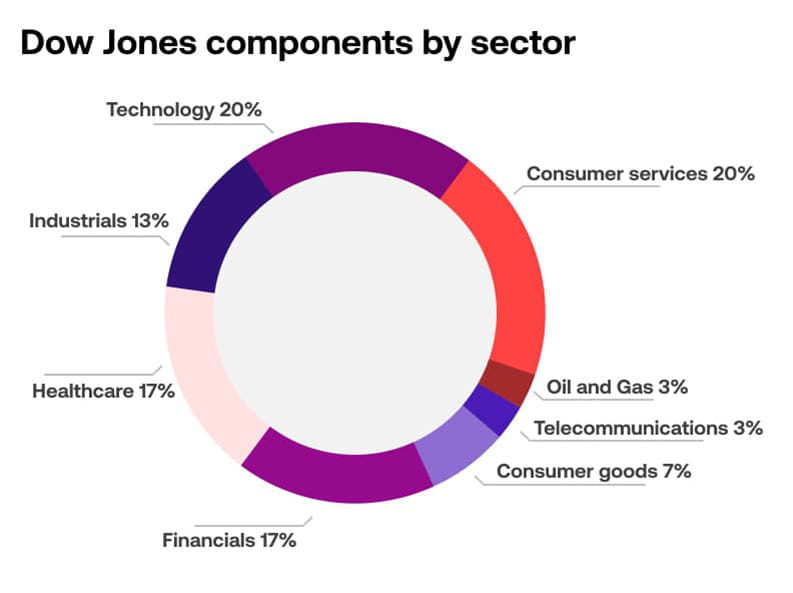
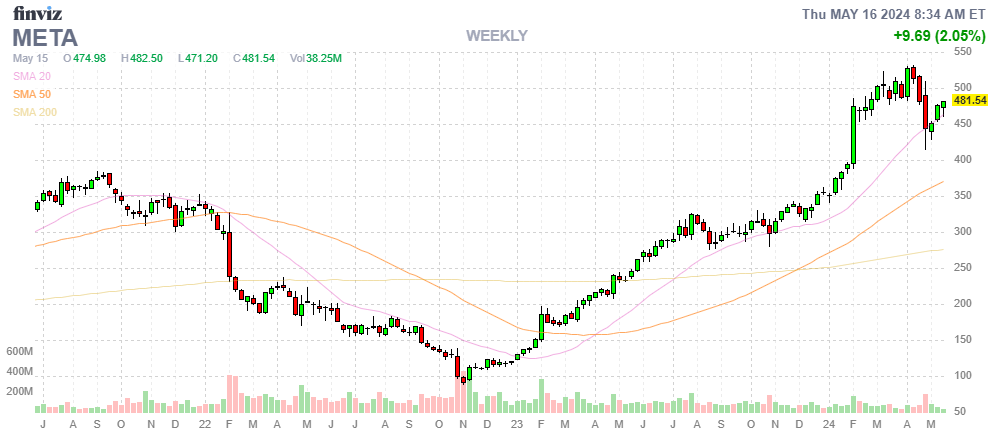
The Dow’s price-weighting has left it overexposed to certain sectors. The outsized impact of high-priced stocks like UnitedHealth (UNH) and Goldman Sachs (GS) has skewed the index towards Healthcare and Financials, while underrepresenting high-growth tech companies like Alphabet (GOOG/L), Meta (META), and Amazon (AMZN) that have also been key drivers for the S&P 500 and Nasdaq.
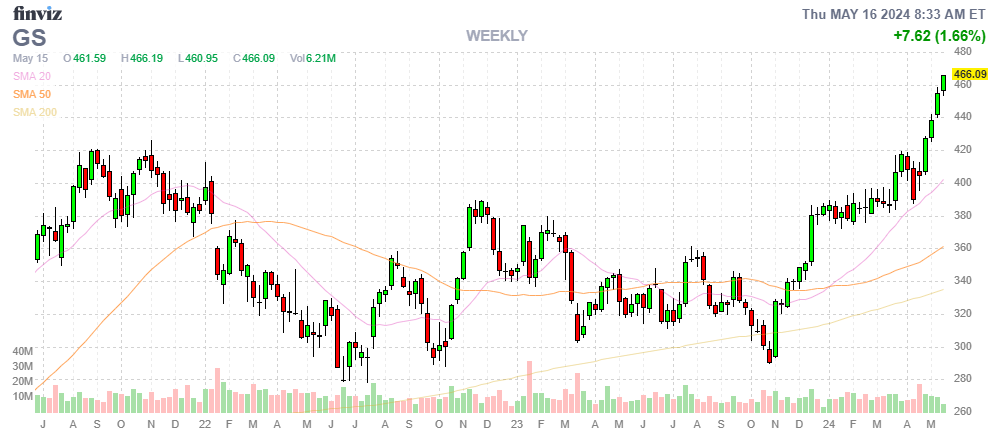
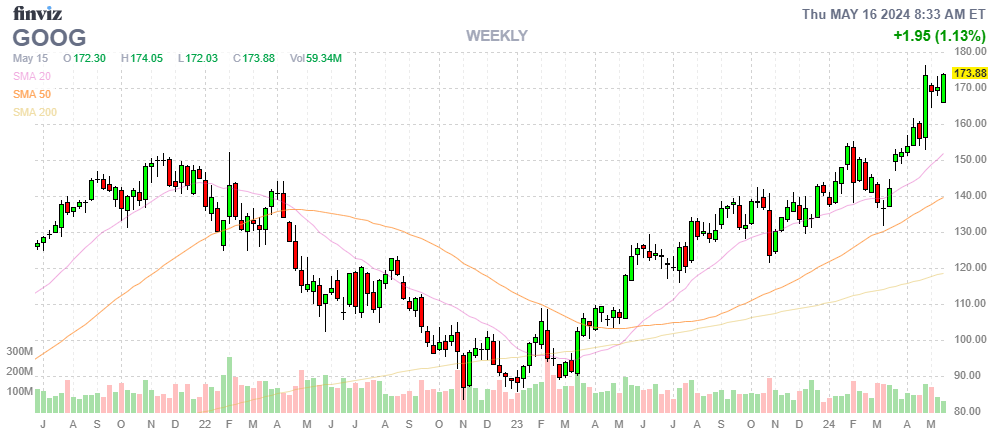
The Dow’s 30% surge since October on top of already-high valuations also suggests a degree of investor exuberance and risk-taking that may be reaching a tipping point. Historically, periods of excessive valuation have often been followed by market corrections as expectations realign with economic realities. With potential risks to earnings growth mounting – inflation, interest rates, geopolitics – the Dow’s current P/E may be even harder to rationalize.
 So while “Dow 40,000” makes for a great headline, it’s important to look under the hood. What we see is an index that is increasingly unrepresentative of the broader market and potentially overvalued relative to fundamentals. The Dow’s old-school price-weighting methodology has left it overly concentrated in a handful of high-priced stocks, painting a misleading picture of the overall earnings landscape.
As you can see from this chart, S&P ACTUAL Earnings have only increased by $5.51 (2.9%) while the index has jumped 1,130 points (26.9%) – that’s not only not sustainable, but foolish!
With the Dow trading at nearly 35 times current earnings, a level rarely seen outside of bubble periods, caution may be warranted. Sustaining these valuations would require a degree of earnings growth that could prove challenging in the face of economic headwinds. While the Dow hitting 40,000 is undoubtedly impressive and a testament to the market’s resilience, it may also be a warning sign of irrational exuberance.
In this environment, investors might be wise to look beyond the headlines and focus on fundamentals. Seek out companies with strong earnings, reasonable valuations, and the ability to weather potential storms. The Dow at 40,000 is a milestone worth noting, but not necessarily one worth chasing. As always, a disciplined, long-term approach is likely to serve investors best, even as the market’s machinations continue to surprise and confound.


