 $1,951,713!
That is, unfortunately, DOWN $51,955 from our May 16th review but we knew that silly gain was not going to stand as everything was a little too perfect and we spent money adding hedges to lock in our gains - which is where we lost most of our money (in the STP) as the market continued to drive higher and, even worse, the rally was led by stocks we don't own - ouch!
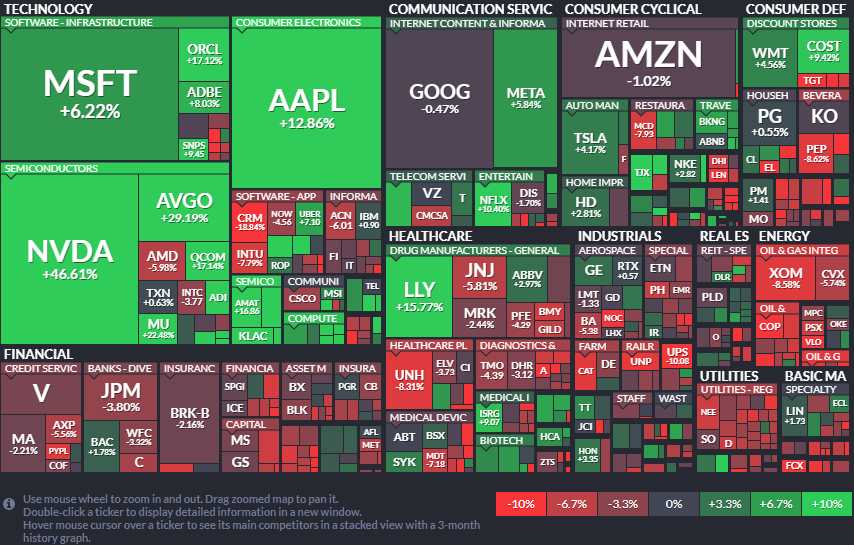
Things certainly could have been worse because, while the S&P 500 gained 320 points (6%) in June and the Nasdaq popped 1,743 points (9.4%) it was the narrowest of rallies - as you can see from the 1-month heat map of winners and losers:

That's how narrow this rally was, AAPL 12%, NVDA 46%, AVGO 29%, LLY 15%, QCOM 17%, MU 22%, NFLX 10%, ORCL 17% and COST 10% and who cares about the other 491 stocks, right? Some things went up so much they burned us but this too shall pass and we started last May with $700,000 in our paired Long & Short-Term Portfolios and now we're up $1,251,713 (178%) in a year and a month so another 178% gain from here would be $3,479,762 so - if we can accomplish that by playing conservatively - wouldn't it be foolish to do otherwise?
We raised a lot of CASH!!! in our LTP and that puts us in good position to take advantage of a dip - IF a dip ever comes. If not, we're beginning to put together a new Watch List for our Members - looking at all those red spots on the heat map to find a few bargains that have slipped through the cracks.
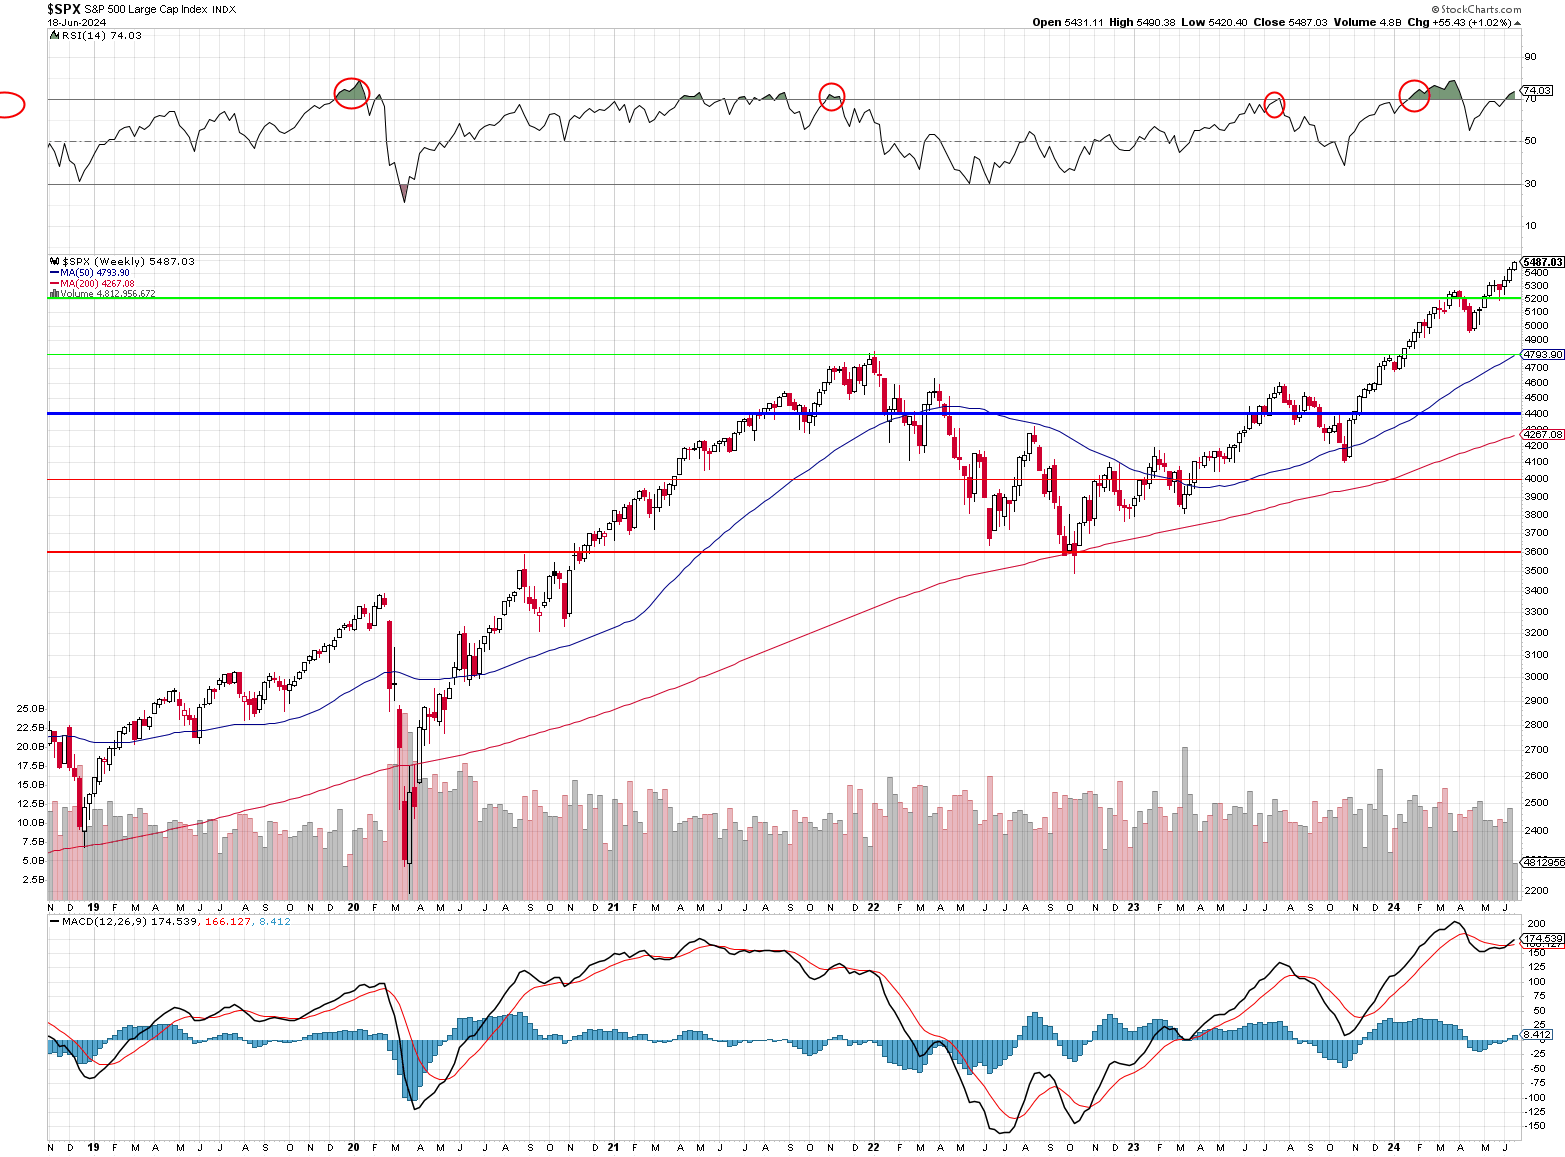
We are back to that worrying RSI 70+ zone on the S&P but it lasted a good 3 months before failing last time but 5,500 on SPX seems very premature to me - so we'll wait and see how July earnings turn out:

Now, let's dive in and see how things are playing out:
$700/Month Portfolio Review: We just did this review on the 4th and we were at $26,502.


