
What a first half we have had!
The month ends on Sunday but the Dow is already almost back to where we were in March – so that’s good, right? The Dow, of course, suffers from a serious lack of Nvidia (NVDA) because, if it just had that one stock, the pre-split rise from $500 in January to $1,400 last week (back to $1,200/120 now) would have popped the Dow (900 x 8.5 =) 7,650 points and we’d be over 47,000 now – up 20% with the substitution of just one stock!
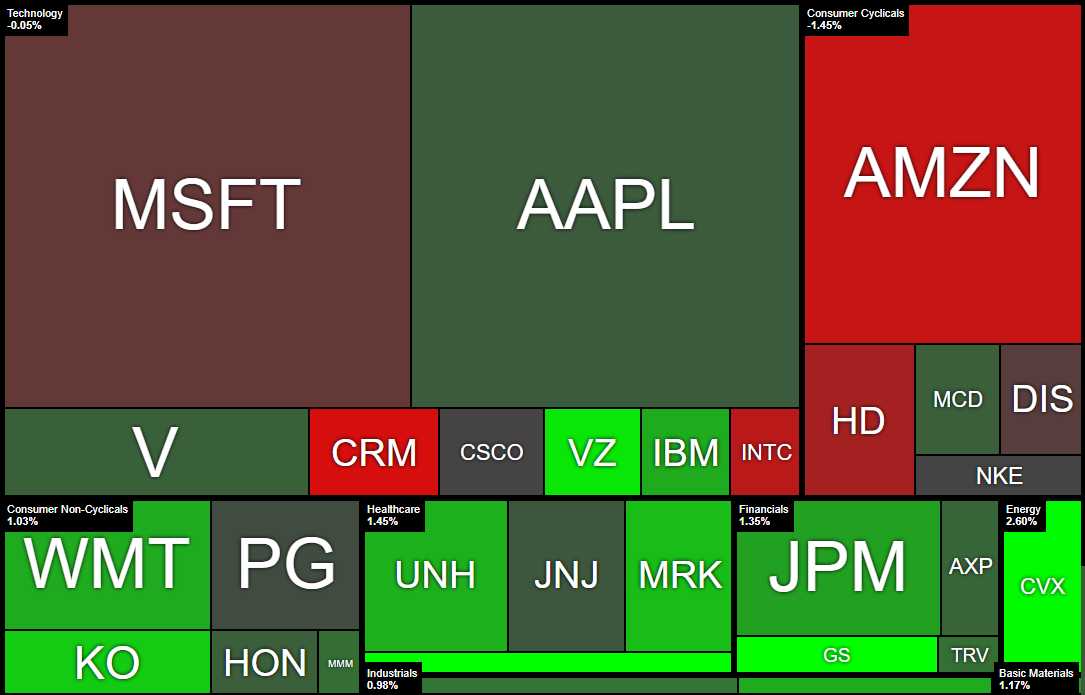
Rather than ooing and ahing over the amazing possibilities, I want to call your attention to just how arbitrary the whole thing is. Now that NVDA is pulling back, the Dow 30 is having it’s day. And the Dow, of course, is the silliest index anyway because here is the Dow 30 arranged by their market caps:
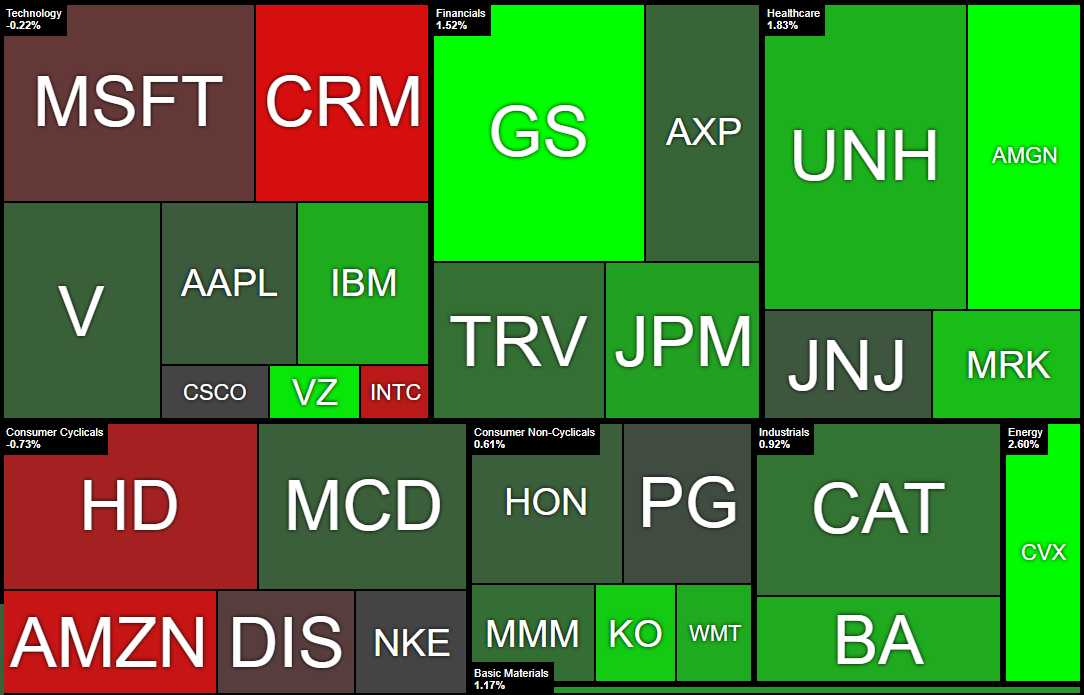
And here are the Dow 30 components arranged by their weighting, which is based on the PRICE of each stock which, in turn, varies from day to day.
Yet as arbitrary and pointless this all is – it’s the way the entire World views the “health” of the markets – even in the US, where we should damn-well know better! The other indexes are SORT OF market cap weighted but not really. Just last week, the Russell “rebalanced” their index, another process that can significantly distort the true market picture.
The Russell reconstitution, which takes place annually in June, involves adding and removing stocks from the Russell 1000, 2000, and 3000 indexes based on market capitalization. While intended to ensure the indexes accurately reflect the U.S. equity market, this rebalancing can lead to substantial capital flows in and out of stocks being added or removed, impacting their prices in the short-term.
Similarly, the S&P 500 undergoes quarterly rebalancing where the index weightings are adjusted based on changes in member companies’ float-adjusted market caps. BUT, the S&P also has a more insidious impact – it effectively drops “losers” that no longer meet its criteria and adds up-and-coming “winners“. This survivorship bias means the index naturally gravitates towards successful companies over time, painting an overly rosy picture of the broader market.
The Nasdaq 100 also made headlines with its “special rebalancing” last year to reduce the concentration of mega-cap tech names that had grown to dominate the index AFTER they already made massive contributions (reducing their downside impact in a sell-off). Normally, the Nasdaq 100 rebalances annually in December, but high concentration triggered an additional rebalance effective July 24 based on market caps as of July 3, 2023. This then led to significant trading volume for the Nasdaq (which is profitable churn for them) as index funds adjust holdings to match the new weightings.
So, while the major indexes are often cited as barometers of overall market health, it’s crucial to understand how their construction and regular rebalancing can skew the story they tell. With the Dow driven by arbitrary stock prices, the S&P “buying high and selling low” by chasing winners, and the Nasdaq 100 scrambling to adjust outsized tech weightings, these benchmarks are far from perfect representations of the complex and ever-changing equity market.

The above chart is from last November and already NVDA is as big as AAPL and MSFT – driving the Nasdaq to all-time highs almost single-handedly. As investors, we need to look beyond the headline index numbers and understand what’s truly driving these market moves. While indexes will always play a key role, a healthy dose of skepticism and deeper analysis are essential to cut through the noise and make informed decisions in these “super-testy” times.
Speaking of AI-driven markets: I asked Boaty (our resident AGI) to run down the news he’s watching this morning as we get ready to start our trading day:
🚢 Thanks Phil, here are some key market-moving news and trends to follow on the morning of June 25, 2024:
1. Nvidia’s continued pullback and its impact on the tech sector
– Nvidia shares have declined for three straight sessions, shedding around $430 billion in market value and entering correction territory. This is raising concerns about the sustainability of the AI-driven tech rally.
– As a bellwether for the AI and semiconductor industry, Nvidia’s performance could signal a broader cooldown in the AI mania that has propelled markets higher this year.
– Investors should watch for any ripple effects on other AI-related stocks and the tech sector as a whole.
2. Rotation from growth to value and defensive sectors
– With worries about tech valuations mounting, we’re seeing a shift in market leadership. Traditional value and defensive sectors like energy, utilities, consumer staples, and financials outperformed on Monday.
– This rotation suggests investors are becoming more cautious and seeking safety in less volatile, income-generating stocks. It will be important to monitor if this trend continues.
3. Economic data releases and their implications for Fed policy
– Key economic indicators are on tap this week, including the PCE inflation data on Friday. The PCE is the Fed’s preferred inflation gauge, so it will be closely scrutinized for signs of cooling price pressures.
– Other notable reports include consumer confidence on Tuesday, GDP on Thursday, and the ISM manufacturing index next Monday. These will provide further clues on the health of the economy and could influence expectations for the Fed’s rate path.
– With the market currently pricing in rate cuts later this year, any upside surprises in inflation or growth data could challenge this dovish narrative and spark volatility.
4. Developments in the banking sector and lending conditions
– The recent challenges faced by small and regional banks, particularly in the commercial real estate space, are leading to tighter lending standards. This credit crunch could be a headwind for economic growth.
– Investors should pay attention to any further signs of stress in the banking system, as well as commentary from bank executives on loan demand and credit quality.
5. Geopolitical risks and their potential market impact
– Elevated tensions with China, the ongoing Russia-Ukraine war, and fresh conflicts in the Middle East (e.g., Israeli airstrikes in Gaza) are all potential sources of market volatility.
– While the direct economic impact on the U.S. has been limited so far, any escalation or spillover effects (e.g., energy supply disruptions) could rattle investor confidence.
In terms of the bigger picture, it’s worth noting that despite the recent tech wobbles, the S&P 500 hit a new intraday high last week and is up nearly 15% year-to-date. However, with valuations stretched and economic uncertainty persisting, the market may be vulnerable to a pullback or consolidation phase.
Investors should stay attuned to the tug-of-war between AI optimism and slower growth realities. Sector and style rotations could become more frequent as the market grapples with this tension. Diversification, risk management, and a long-term perspective will be key to navigating the second half of 2024.
")


