
This week wasn’t so bad:
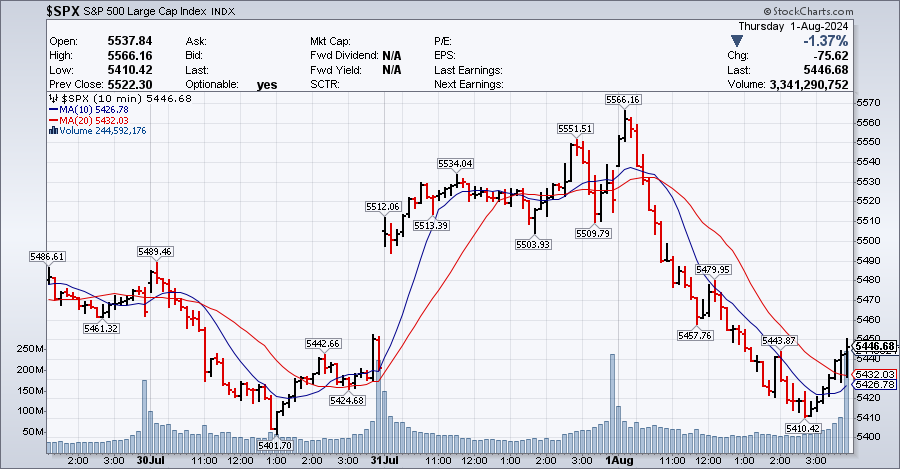
We had a silly run-up caused by a misinterpretation (or misrepresentation) of Fed comments that allowed the MSM’s sponsors to unload their shares are high prices to the retail suckers who listened to the pundits and were BUYBUYBUYing based on 13 words that were changed from the prior Fed statement. We had already warned our Members Live on Wednesday with Warren (PSW’s resident AI) saying at 2:14:
🤖 “Based on the latest FOMC statement and the context provided by the June meeting minutes, the likelihood of the Fed cutting rates at the September meeting appears to be relatively low. Here are the key reasons supporting this assessment:“
This was at the same time that the Wall Street Journal had changed the front page on the web to read: “Federal Reserve Clears Path for September Rate Cut” and we discussed that idiocy in our Live Member Chat Room during Powell’s press conference. It’s important to have these discussions lest investors fall prey to Recency Bias, which is a cognitive bias that causes individuals to give greater importance to recent events compared to older events and long-term trends.
Recency Bias can significantly influence decision-making processes, leading investors to overemphasize the latest information while disregarding historical data or long-term trends. Investors often fall prey to recency bias, especially when reacting to earnings news or Federal Reserve announcements. That’s exactly what we saw on Thursday as traders drove up stock prices based on the expectation of lower interest rates – even though the long-term economic outlook remains extremely uncertain.
Keep in mind the Fed has been saying for over a year that they will lower rates only when inflation and employment and wages slow significantly – how is that a positive for the economy? When they talk about a “Soft Landing” they are talking about STAGNATING the economy without sending us into a full-blown Recession – how will that justify paying 30-40 times earnings for companies?
We’re about halfway through earnings season and 78% of the companies reporting so far have beaten earnings forecasts vs the 5-year average of 74% BUT the early reporting companies are the big companies with the big accounting firms that have their books ready early in the season and that means they are also well-equipped to manipulate those numbers to make themselves look good.
Those beats, in fact, are averaging 4.4% – which is about HALF of the 5-year average beats of 8.6% and only 60% of the reporting companies are beating on Revenues – DESPITE INFLATION – and this is also below the 5-year average of 69% Revenue beats. And the amount of the beats? 1% vs a 2% average.

The magnitude of earnings and revenue beats is below historical averages, and fewer companies are exceeding revenue expectations compared to past periods. This mixed picture reflects the current economic environment, where companies are navigating various challenges including inflation, interest rates, and changing Consumer behavior.
Sector trends this earnings season reveal a nuanced picture of the current economic landscape. Here’s a breakdown of what we’re seeing:
Technology Sector (XLK):
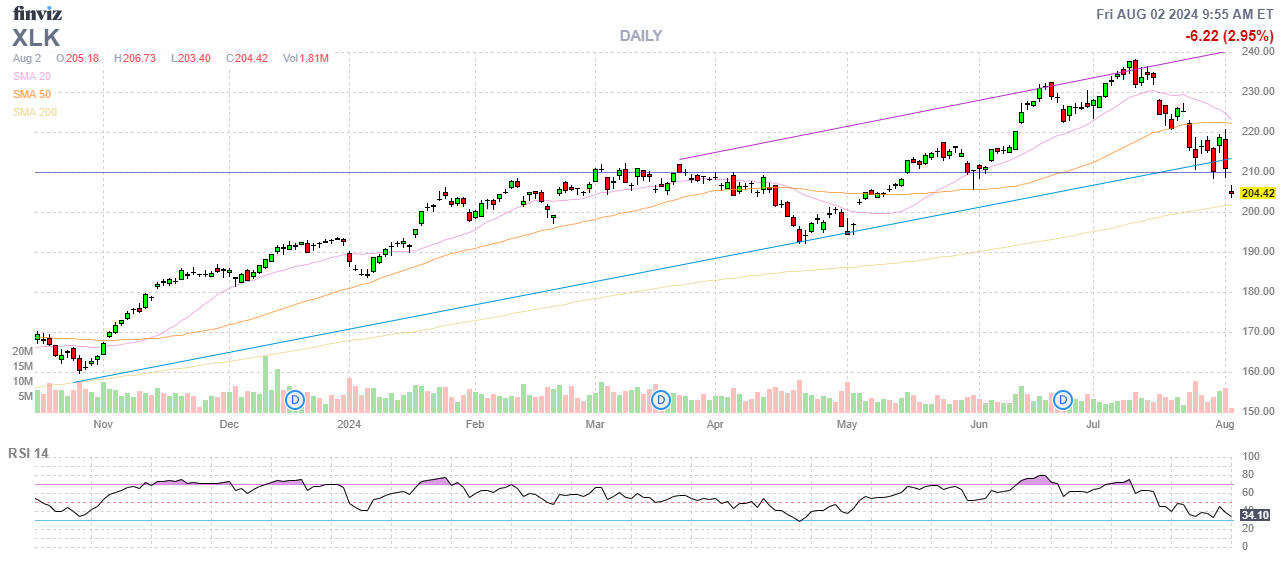
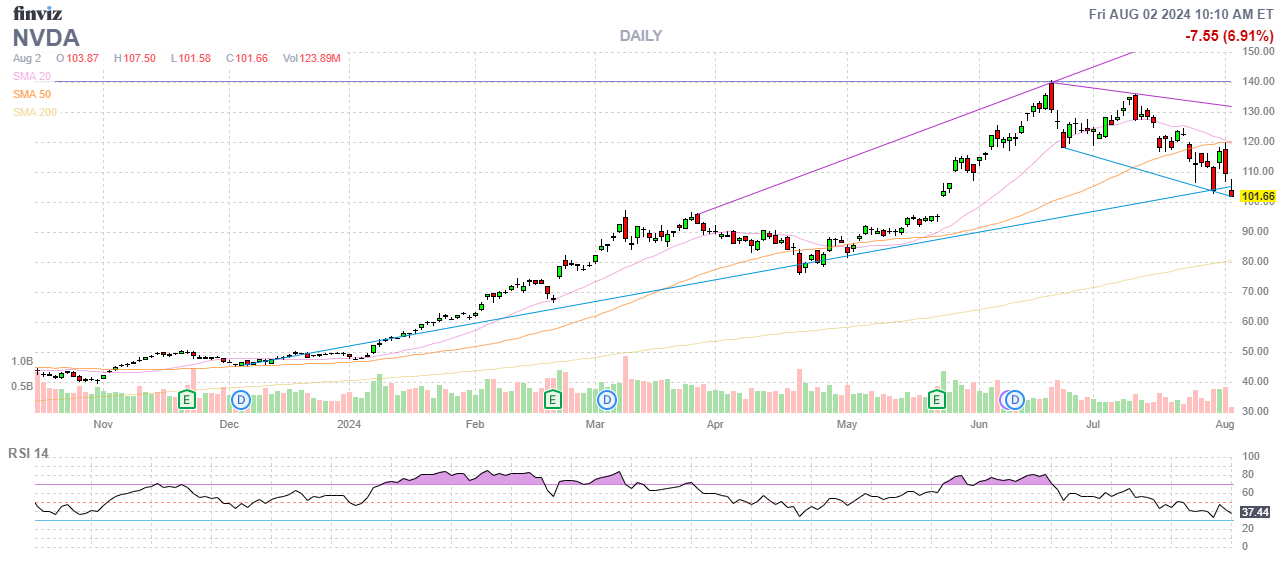
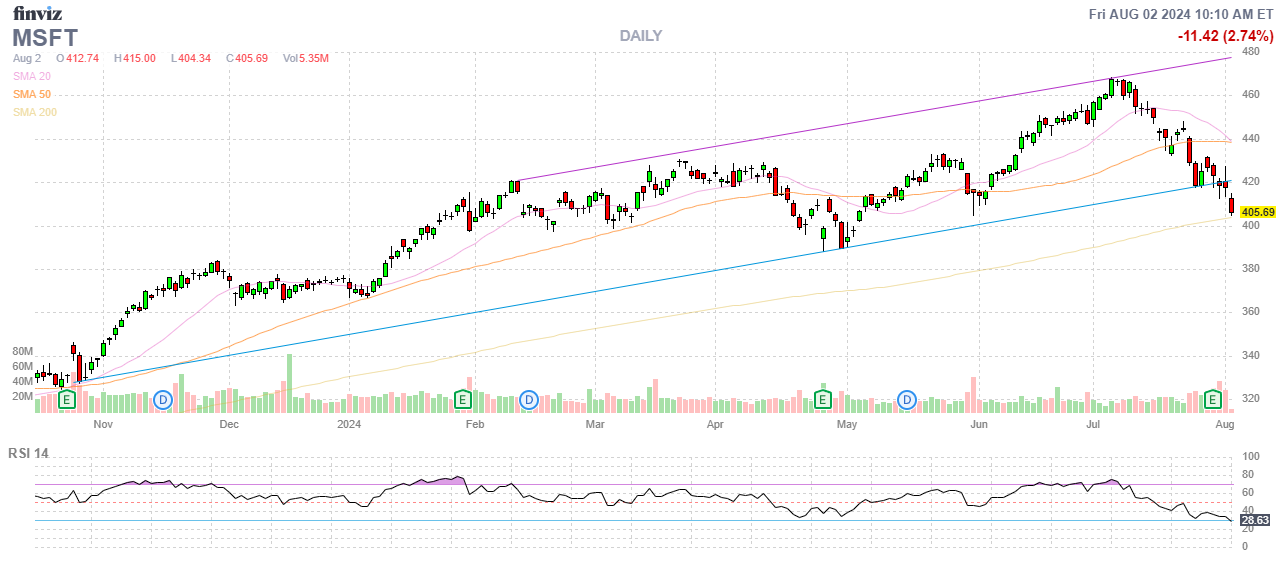
- The tech sector continues to be a standout performer, with earnings growth expected to be up 17.4% for the full year 2024. This sector had been benefiting from the AI boom, with companies like Nvidia (NVDA – 20.2%) leading the charge. However, there are signs of caution even among tech giants. Microsoft (MSFT – 22%) and Broadcom (AVGO – 4.2%), despite beating expectations, faced stock declines due to concerns about increased capital expenditures related to AI investments and capacity constraints.
Communication Services (XLC):
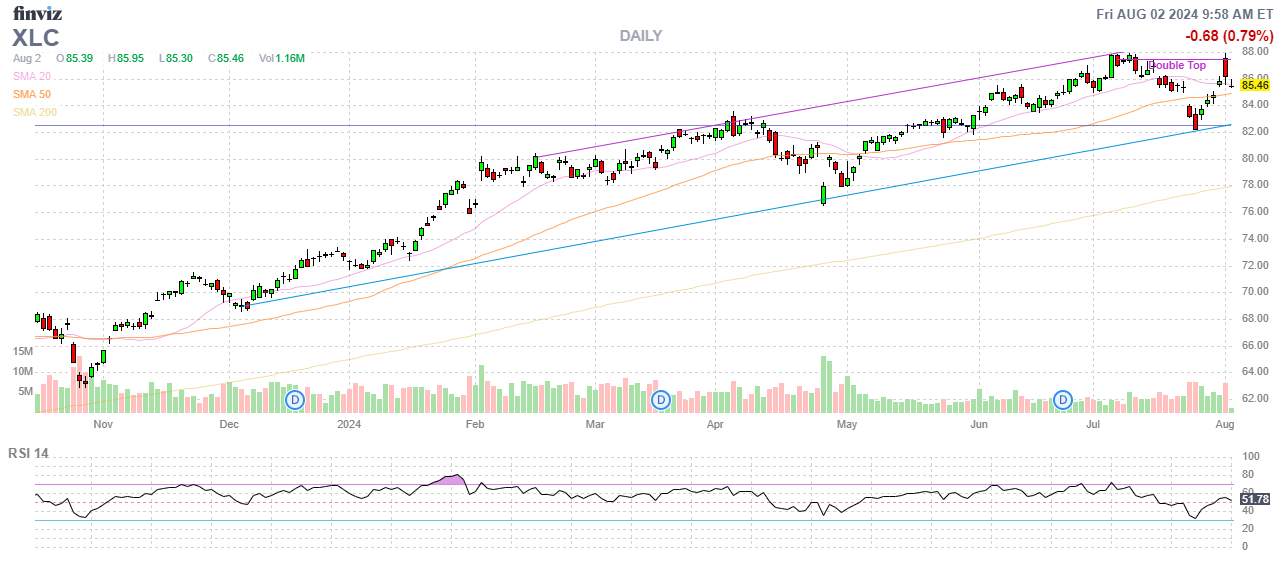
- This sector is showing strong performance, largely driven by social media giants like Meta (META, 22.5% of the index) and Alphabet (GOOG/L 12.6% and 10.5% of the index – I kid you not!). The sector is reporting double-digit growth, benefiting from increased digital advertising revenues and user engagement.
Financials (XLF):
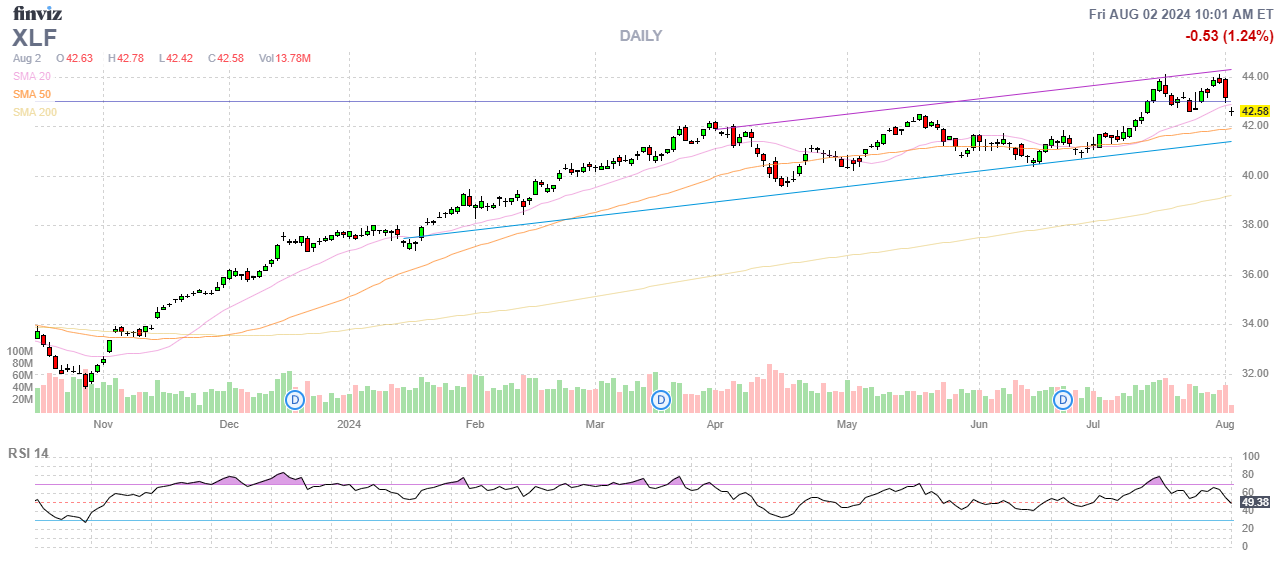
- Banks and financial institutions are reporting robust earnings growth, aided by higher interest rates and strong consumer spending. However, there are concerns about the sustainability of this growth as interest rates potentially stabilize or decline.
Health Care (XLV):
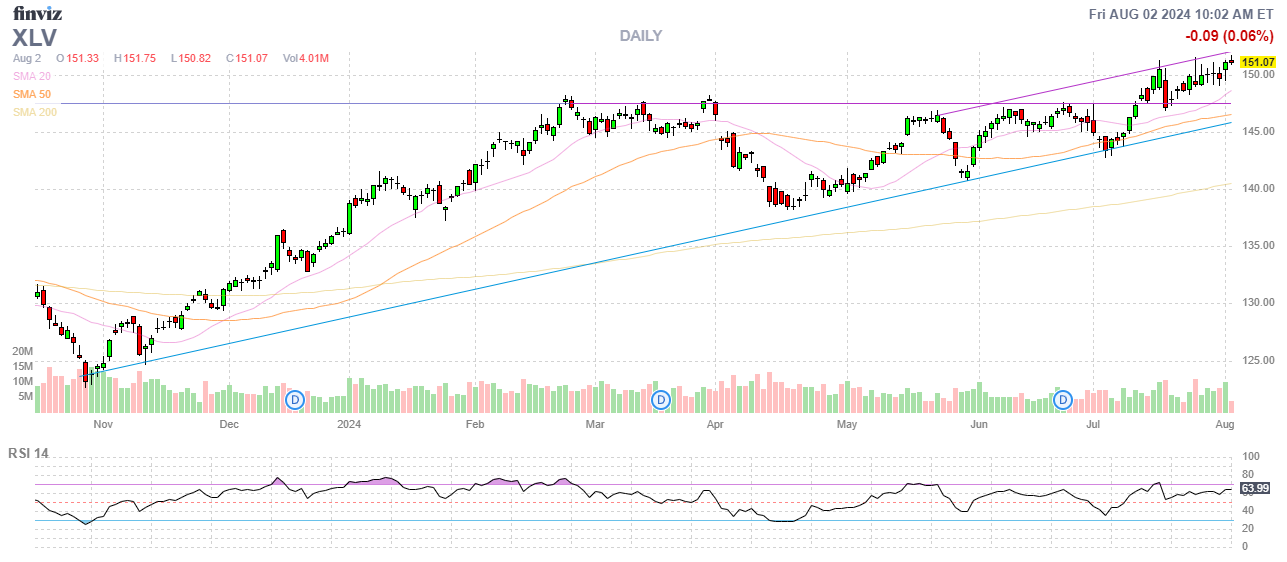
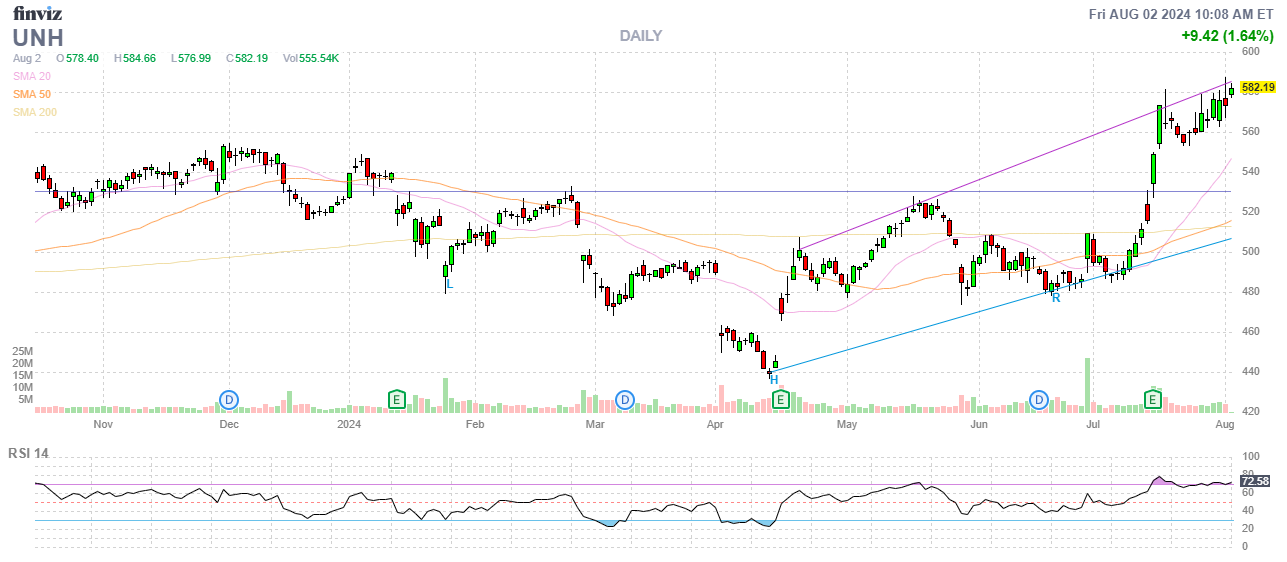
- The health care sector is experiencing a resurgence after several quarters of negative growth. Companies like United Health (UNH) are contributing significantly to the sector’s positive performance, partly due to easier year-over-year comparisons.
Consumer Discretionary (XLY):
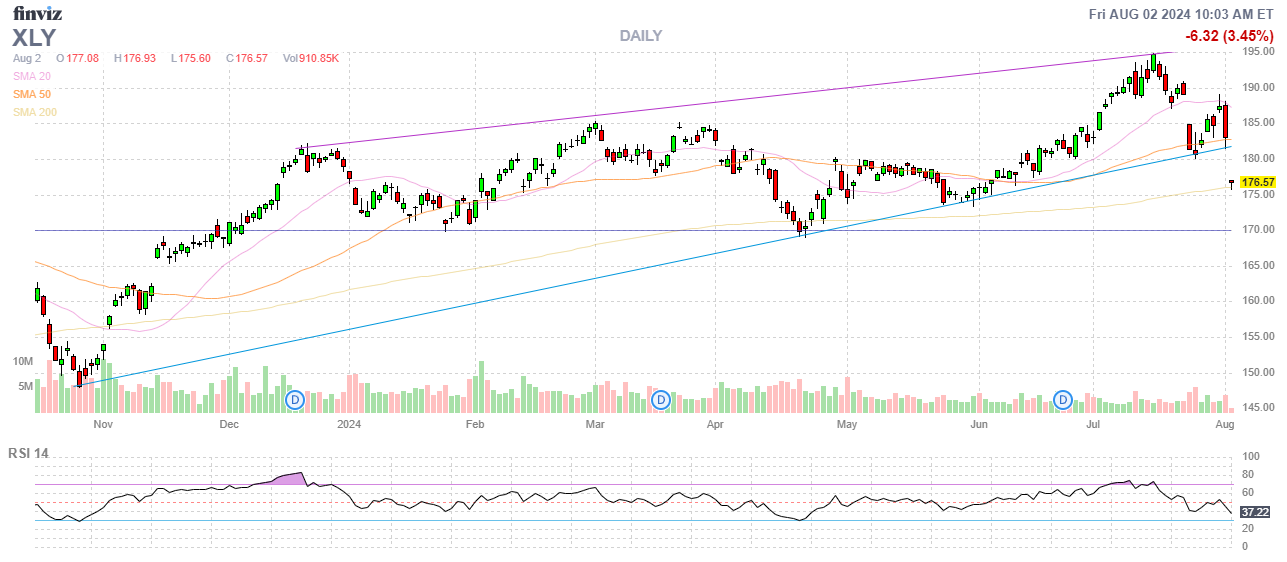
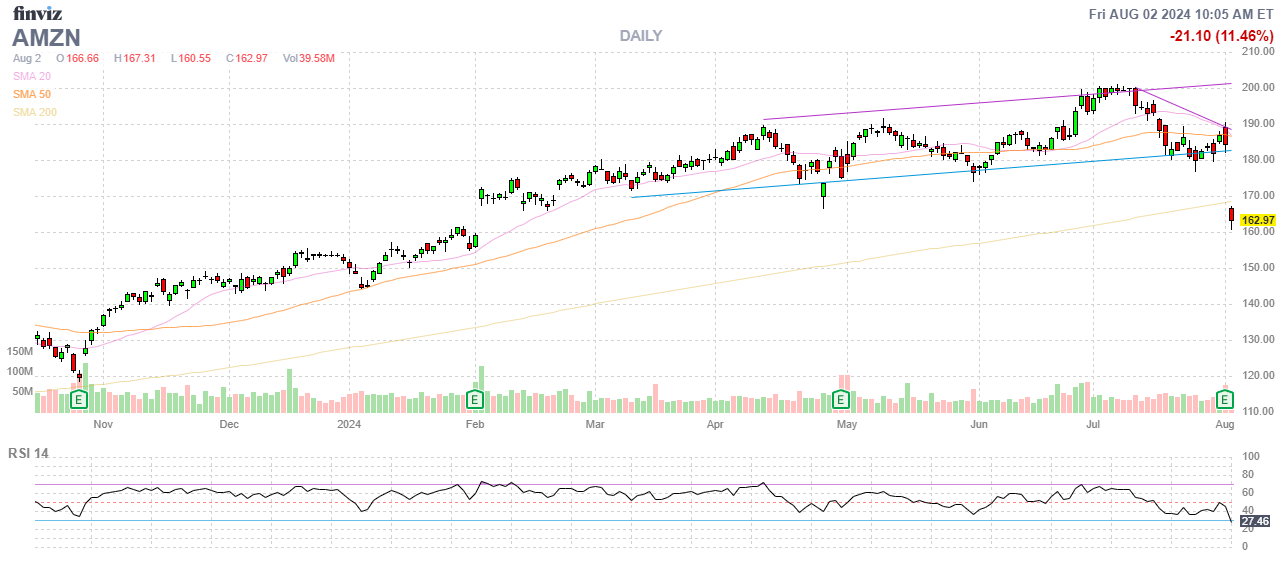
- This sector is weakening rapidly, with companies like Amazon disappointing as Consumers pull back on spending. Retailers are reporting pressure on margins due to persistent inflation and shifting consumer spending patterns. AMZN is 23% of this index, TSLA is 15% and HD is 9%.
Energy (XLE):
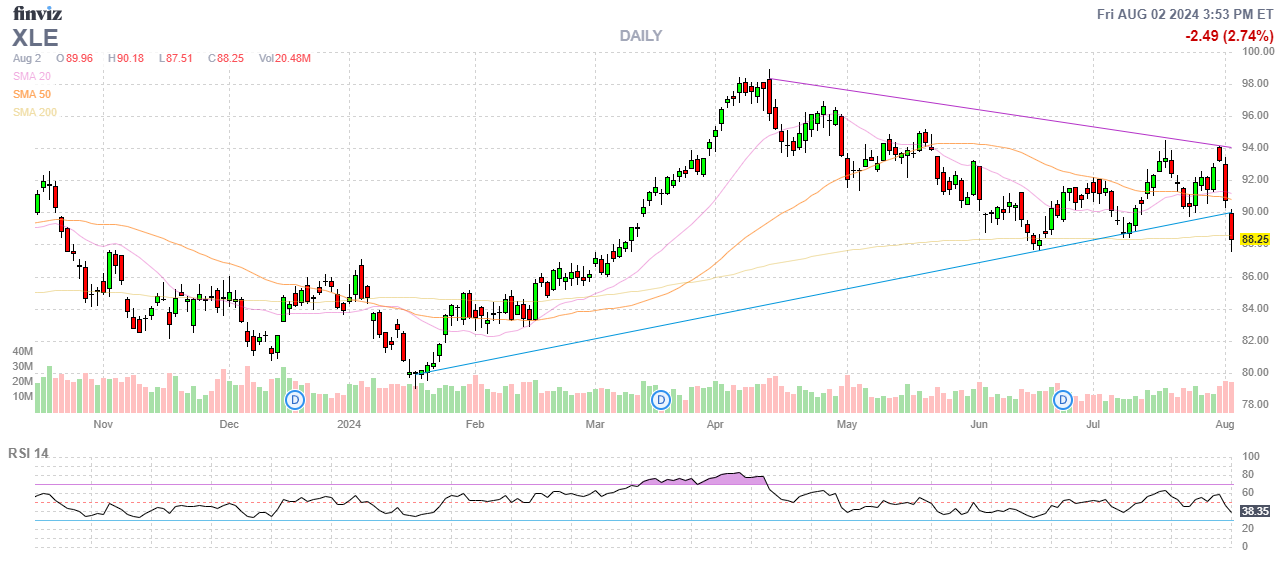
- The energy sector has seen the largest downgrade in earnings expectations, with a 450 basis point reduction. This reflects the volatility in oil prices and global economic uncertainties affecting demand. Oil has plunged back to $74 and that’s not going to help them hold that lower channel – so down we go!
Industrials (XLI):
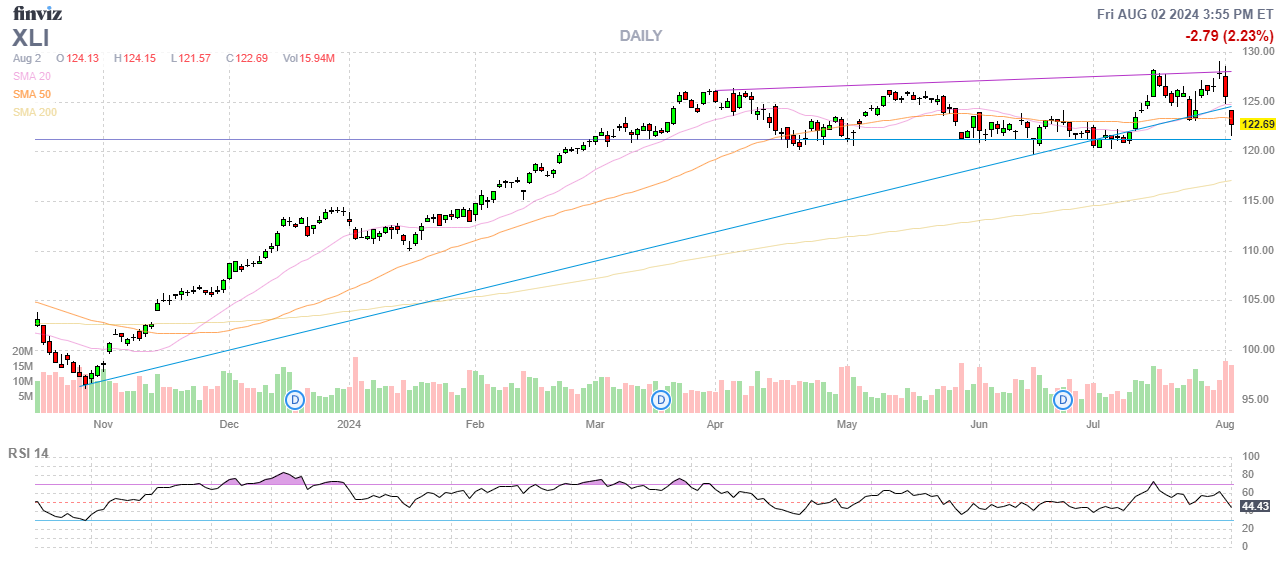
- This sector is facing challenges, expected to end its streak of positive year-over-year earnings growth. This could be indicative of broader economic slowdown concerns though a lot of it has been Transports (BA) and the Auto sector, which fell victim to a ransomware attack that, hopefully, is a one-time thing.
Materials (XLB):
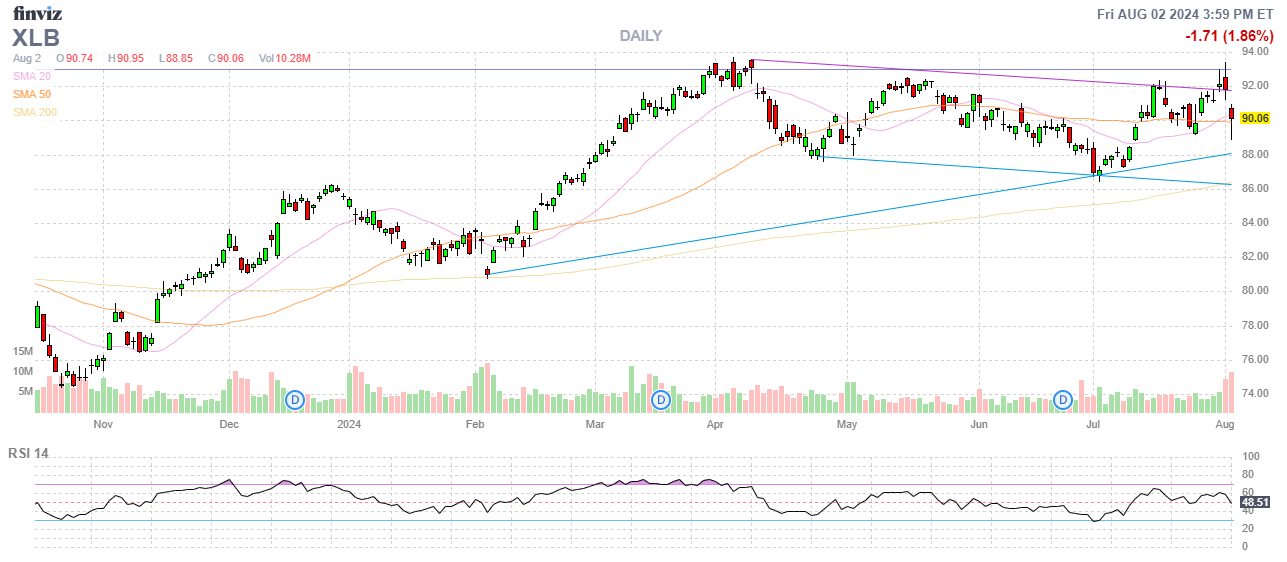
- The materials sector is the only one reporting a decline in revenue, signaling potential weaknesses in global demand for raw materials and commodities.
Real Estate (XLRE):
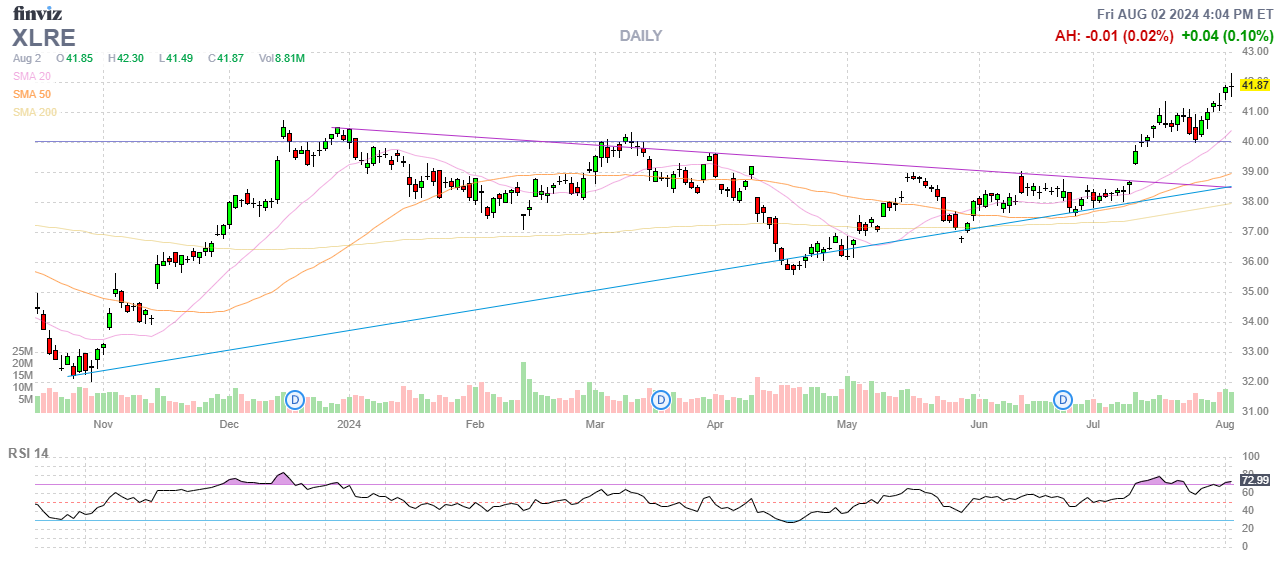
- The real estate sector has been facing challenges in 2024, largely due to high interest rates and economic uncertainties. According to the search results, real estate fundamentals and earnings growth in most property sectors remain healthy amidst an environment characterized by low supply. Commercial RE is the wildcard here – still in danger of a full-on collapse but REITs are very attractive right now as rates are very UNlikely to go up – which is usually the risk for REITs.
Utilities (XLU):
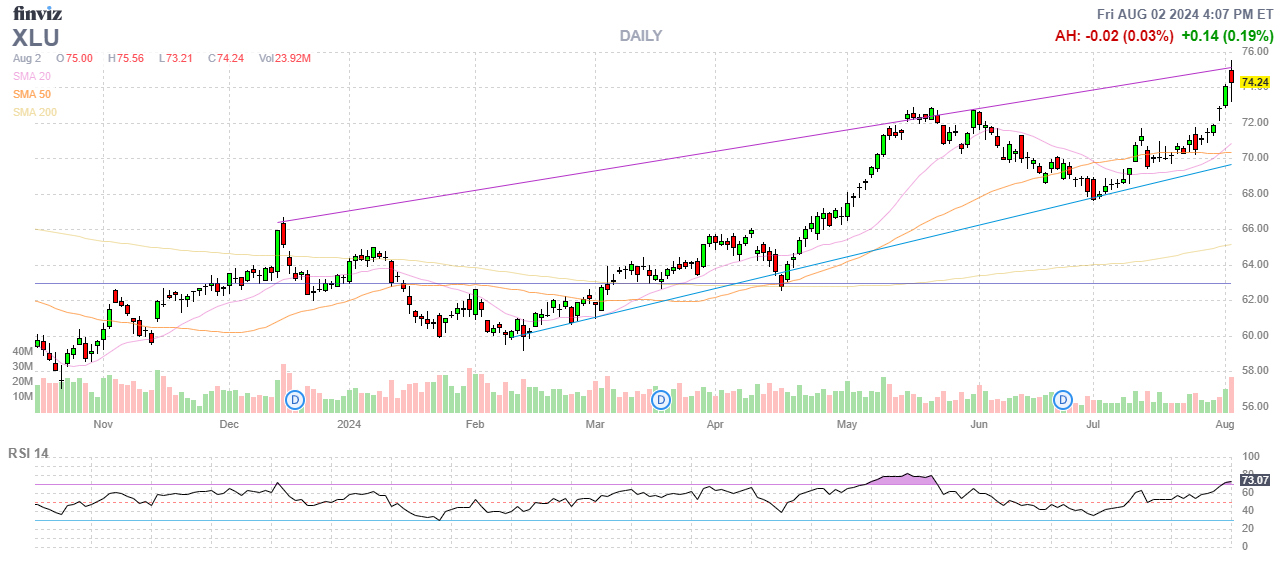
- A big flight to safety recently and, like Real Estate, Utilities are rate-sensitive and there’s very little upside risk there. Also, inflationary costs have been absorbed and now comes the rate increases, which are a slow process that often require Government approvals after the Utility Companies prove their margins have been squeezed.
This earnings season is painting a picture of an economy in transition. While some sectors, particularly tech and communication services, are thriving on the back of AI and digital transformation, others are showing signs of strain. The divergence between earnings beats and revenue misses suggests that companies are managing to maintain profitability through cost-cutting measures rather than robust top-line growth.
As we move into the second half of earnings season, it will be crucial to watch for any shifts in these trends, particularly among smaller companies that tend to report later. These could provide a more accurate gauge of the broader economic health beyond the influence of the market giants.
Have a great weekend,
-
- Phil


