

Back on July 26th it was “False Hope Friday – Watch for our Weak Bounces” and we talked about the sneaky nature of “Dead Cat Bounces” using the above chart of the Nasdaq and Warren noted: “The term “Dead Cat Bounce” is particularly relevant today, highlighting the risk of misinterpreting temporary recoveries as signs of a sustained rally. This pattern often emerges during prolonged downtrends, where brief rebounds can lure investors back into the market prematurely.” and I said:
“It was the 11th, with the RSI over 70, that I called for a 1,000 point correction as earnings season kicked off because the 40x p/e ratio of the Nasdaq was clearly unsustainable. And I wasn’t calling for 1,000 points from 20,500 – the 5% Rule™ also told us the extra 500 points was just an overshoot and we ignored that and called for a move back to 19,000 – which is exactly what happened.
19,000 itself is a weak retrace of the run from 15,000 to 20,000 (-20% of the run) and, if that line holds – then we are possibly consolidating for a move higher. BUT, didn’t we say 20,000 was ridiculous already? It was ridiculous pre-earnings as there was nothing to justify it but, if earnings are up 10% then the p/e of the Nasdaq is 36 and if the Nasdaq is down 10% (from 20,000 to 18,000), then the p/e of the Nasdaq is 32.4 and we know that can be sustained (but it doesn’t mean we run out and buy it – as it’s still toppy).
Below 18,000 (strong retrace) would indicate something is very wrong with the forward valuations and we may normalize back to (for the Nasdaq) 25x forward earnings which would be, unfortunately, all the way back to 15,000. So all it takes for what would seem like a catastrophic 25% correction in the Nasdaq is a reversion to the mean for p/e.“
Here’s how we’re following that script so far:
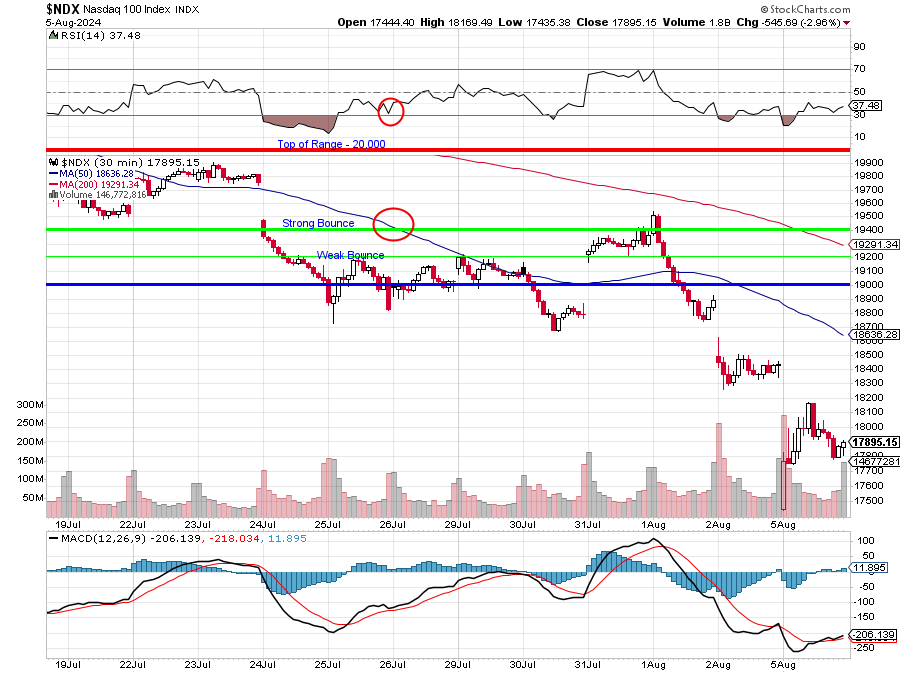
The whole point of the 5% Rule™ is to take the emotion out of trading. One of the biggest mistakes traders make is getting suckered into buying on bounces, which only leads to further losses. What we’re having in the market is a CORRECTION and that means the indexes are coming back to their CORRECT levels – do not expect us to race back to the top – we were too high and we’re not even sure this is going to be the low as we’re still trading at 30x Nasdaq 100 earnings.
This morning the Nasdaq is bouncing 200 points, so back to 18,100 but we fell from weak support at 18,800 to 17,800 (not counting the spike down) so 200 points is simply a weak bounce and we need 18,200 to call it a strong bounce and even that is nothing as the original fall is from 19,800 – and even that consolidation was only a week (17th to 24th) and a weak bounce from there would be 400 points (18,200 again) so THAT is our significant line and anything below that is just noise.
Of course the Nasdaq is a little insane, with just 7 stocks driving it up and down so let’s look at the S&P 500 so we can also be aware of those potential bounce lines using our fabulous 5% Rule™. First though, some perspective, here’s the 5% Rule applied to the weekly chart:
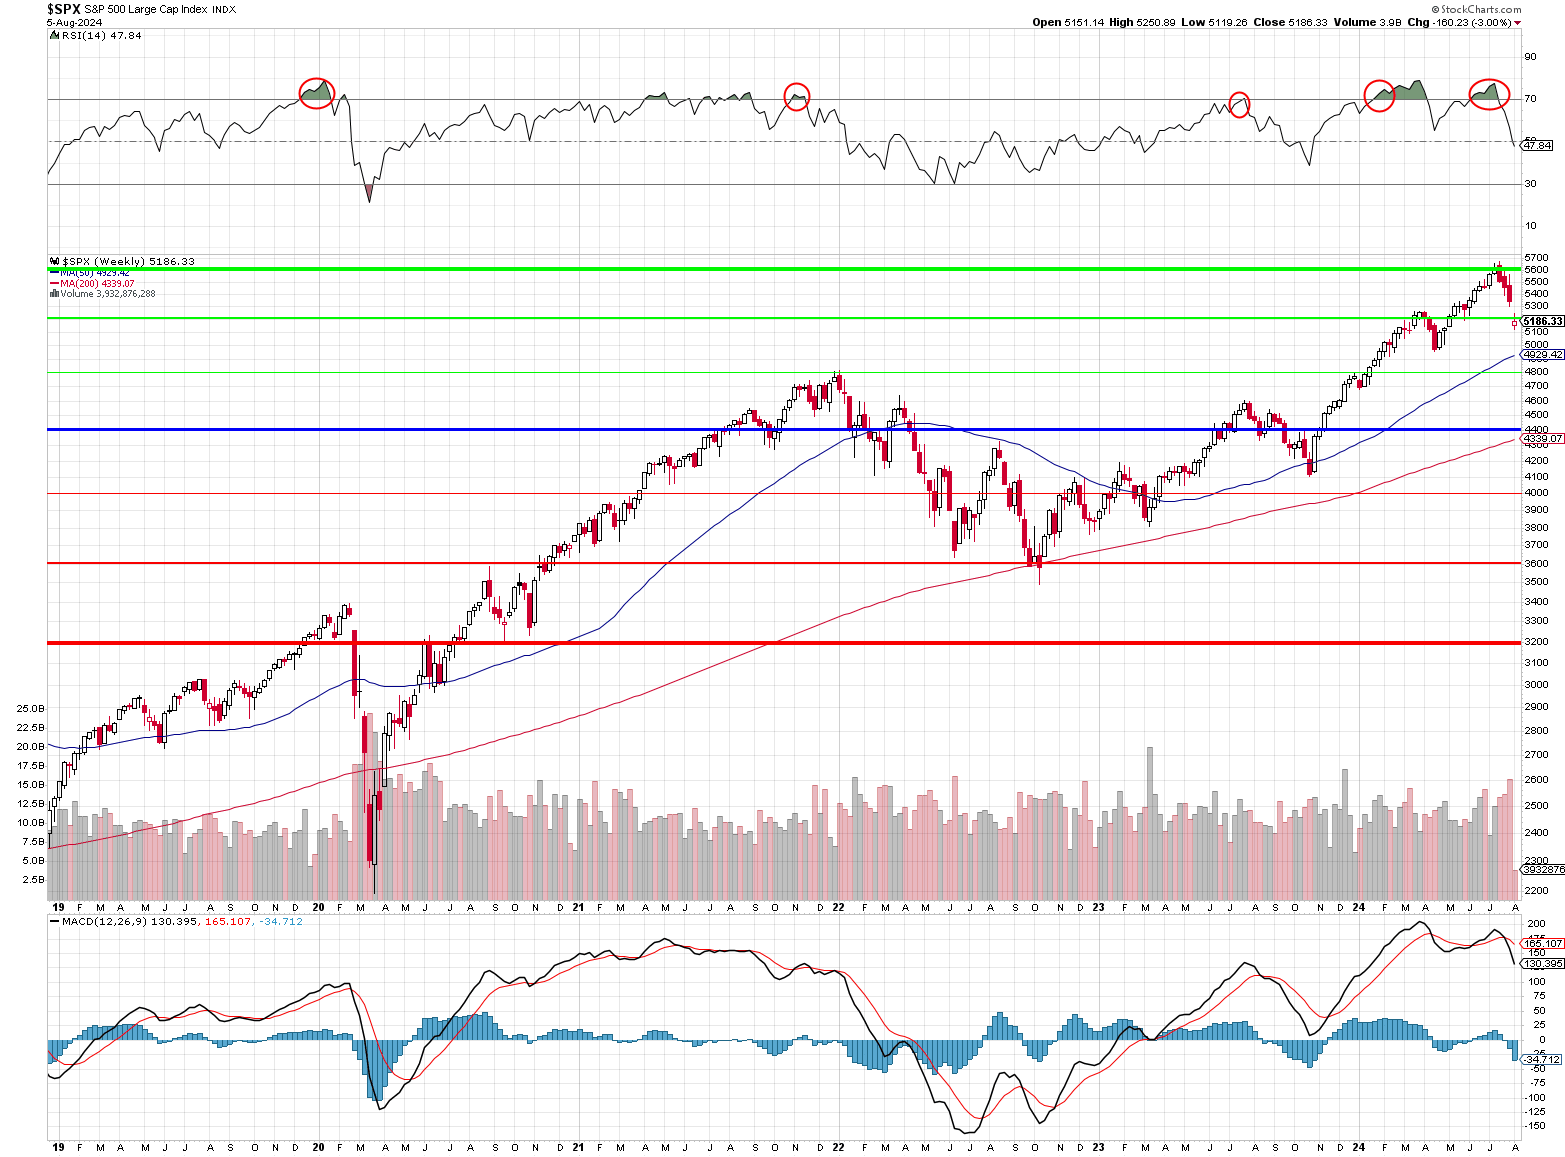
So far, this has been exactly the fall we predicted from the top of our range at 5,600 to 5,200, which is only a “weak retrace” of the run from 4,400 – which is our old “fair value” line for SPX. We have discussed raising the blue bar to 4,800 to account for Inflation over the past couple of years and we were waiting for this earnings season to be over to make a final decision because it’s not that these companies are making more money – it’s just that the currency they are being measured in has been devalued (like Japan!) – and we just saw how quickly those sort of gains can be unwound.
In any case, the bottom line for the S&P 500 is it’s moving in 400-point zones and this particular drop has taken us from 5,600 to 5,200 which is 400 points and that means a weak bounce at the top of the range would be 80 points (20% of the drop) – meaning a weak bounce would be 5,280 and a strong bounce would be 5,360 and we finished yesterday at 5,186 – so it will take 174 points to impress us – BY FRIDAY (oh yes, time matters too!).
Now, here is why TA people suck at predicting things. At this point, they keep staring at their charts – looking for some sort of pattern to emerge from the sticks on the ground while we Fundamentalists look at what drives the S&P 500 and we have AAPL (6.9%), MSFT (6.7%), NVDA (6.2%), AMZN (3.7%), META (2.2%), GOOGL (2.2%), GOOGL (1.8%), BRK-B (1.7%), AVGO (1.5%) and TSLA (1.4%) – those 10 (9, really) stocks make up 34.3% of the index so really, all we have to do is figure out whether THOSE STOCKS are too cheap, or not…
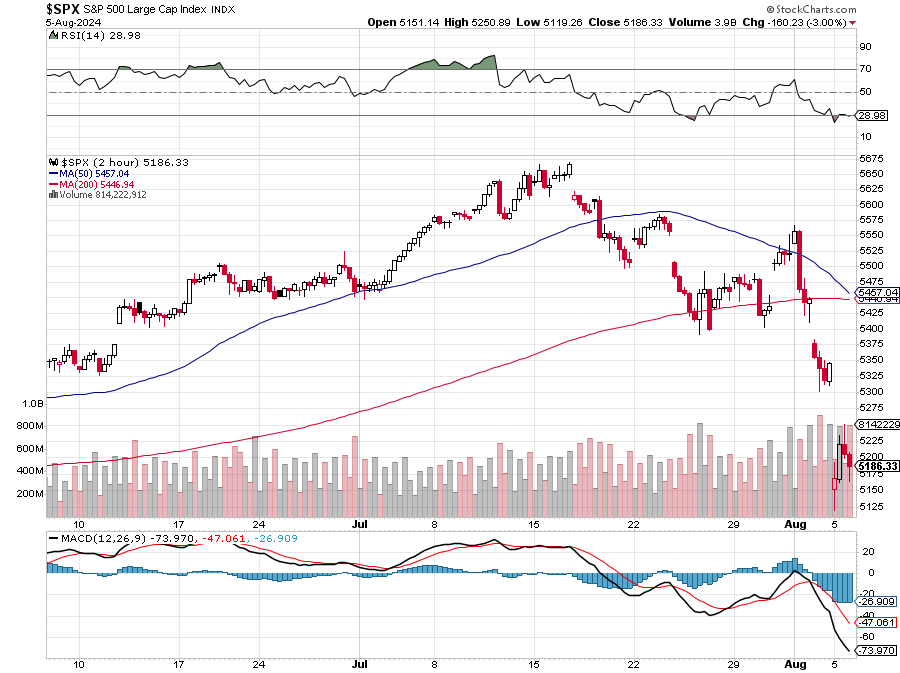
Looking at the index itself, the 2-hour chart is coming into a death cross – that is NOT GOOD but, on the other hand, getting over that would be impressive. The RSI and MACD both seem oversold and we had strong volume that formed a bottom yesterday (assuming it holds) – so several good signs.
UNFORTUNATELY, on the weekly chart, the RSI is only halfway to oversold, which indicates that we won’t be oversold until 4,800 and the weekly MACD line actually still looks WAY OVERBOUGHT. On the bright side – we did just pull out of a shallow correction in April and both the 50 and 200 dmas are rising – so it’s not too likely we’ll fall much further then 4,800, which is 25x earnings for the index.
Now, here is where Fundamentals kick in as we can simply look right now at our major components and see what p/e levels our leadership has fallen to: AAPL (31.4), MSFT (33.8), NVDA (60.4), AMZN (38.8), META (24.6), GOOGL (23.7%), GOOGL (23.7%), BRK-B (13.3), AVGO (62.3) and TSLA (56.5)… Oh dear, that’s not very encouraging, is it? And GOOG/L were just declared a monopoly and that can lead to serious issues for our 2nd best-valued company.
Berkshire (BRK-B) just had fantastic earnings and they are sitting on $300Bn worth of CASH!!! after brilliantly dumping half their AAPL stake just before it sold off – BRILLIANT! People should have been running TO this stock, not out of it and Berkshire is always a good proxy for the S&P 500 so, IF you want to make a bottom call on the market – this is the way I’d go!
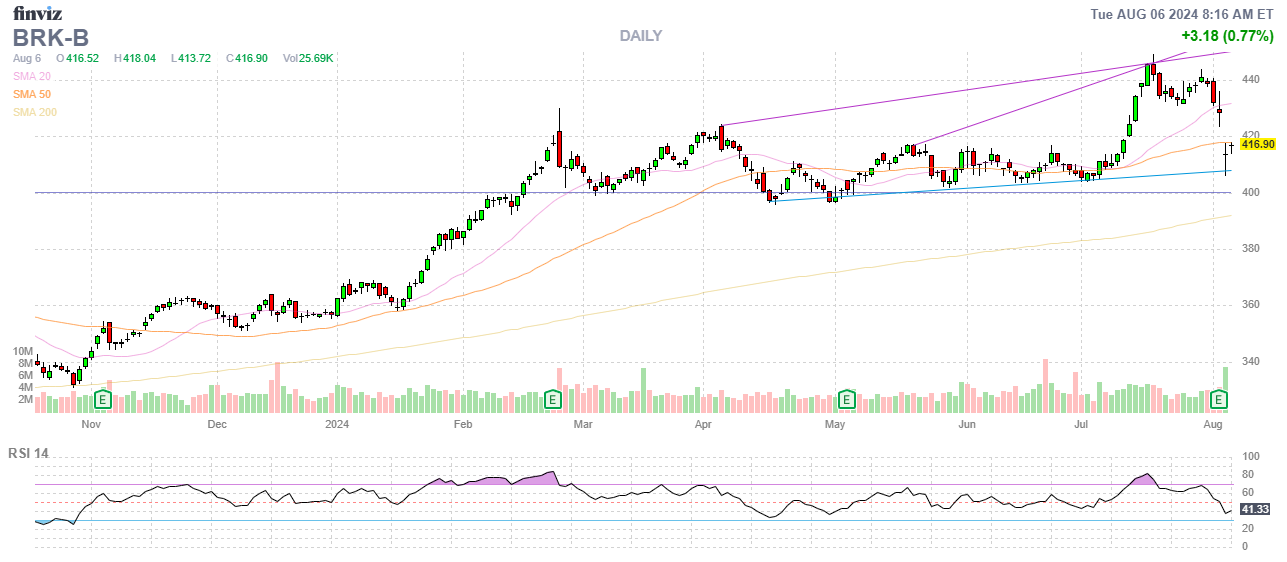
We don’t have BRK.B in the LTP so we should take a small position that we’d be happy to double down if the market drags it lower:
-
-
- Sell 5 BRK.B 2026 $400 puts for $25 ($12,500)
- Buy 7 BRK.B 2026 $400 calls for $62 ($43,400)
- Sell 5 BRK.B 2026 $470 calls for $26 ($13,000)
-
That’s net $17,900 on the $49,000+ spread and our intention, of course, is to sell short-term calls like 3 Oct $440 calls for $10 ($3,000) as 6 quarterly sales like that would generate $18,000 and give us a net free spread. But, for now, the upside potential as it stands is $31,100 (173%) over 18 months so that wouldn’t be so bad – even without the short call sales – which means we’re not in a hurry and we’ll give them a chance to bounce.
Anyway, where were we? Oh yes, so do the valuations of the rest of the Top 8 S&P components justify a bottom to this sell-off? No, not really, we’re still generally over-valued and that means a REAL correction, should take us back to that 4,800 line – another 7.5% drop from here.
So beware the bounce – let’s make sure we’re over our goals before we rush in like fools…


