
We get Consumer Credit at 3pm.
After a huge post-Covid surge, things have generally calmed down substantially in the past 12 months – starting with last August’s MASSIVE $15Bn drop. Still, we’re well over $5 TRILLION in debt ($45,454 per household) and Revolving Credit (the worst kind) has increased 6.3% since last year – an indication that people are resorting to their credit cards to stay afloat for another 30 days.
Coming out of Covid, wages were rising and the Government was still handing out money and Student Loans were being forgiven – people were happy and, since they had been locked in for 2 years – they were happy to go out and spend money they didn’t have – assuming it would be coming in very soon. But then the Fed (boo, hiss!) raised rates and wage growth slowed and interest rates rose and the Consumers were flipped on their backs like a sad turtle.
Today’s report will cover June and May was up $11.3B with $7Bn of that being Revolving Credit. Today we’re looking for a slowdown or contraction that would indicate Consumers are pulling back on spending – which is what reporting Retailers have been telling us (or using as an excuse) this earnings season.
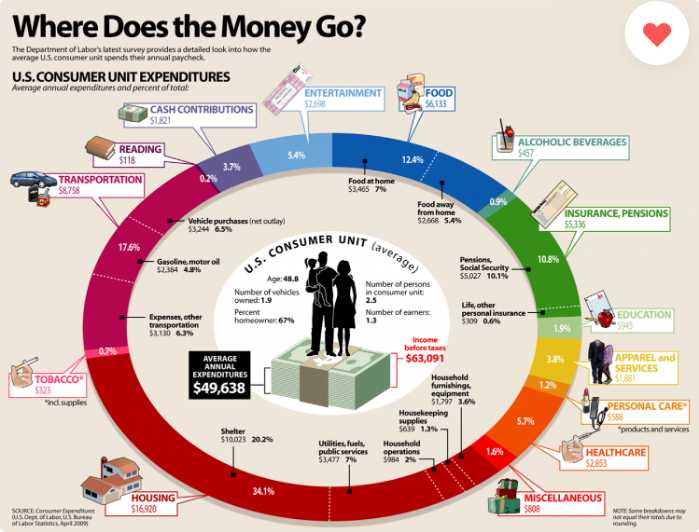
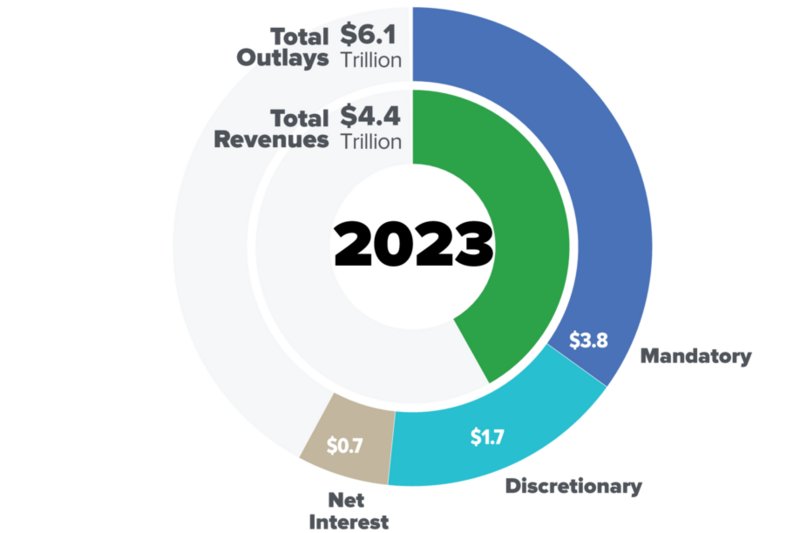
The above chart is old but it gives you the percentages. Here’s a detailed breakdown from 2022 that’s long but fun to dig into. The thing is, if wages aren’t growing (thanks Fed!) and everyone is already employed then everything becomes a choice for the Consumer, who has to move his money from one category to the next and, if interest rates rise (thanks Fed!) then things need to be cut back and we know Health Care and Insurance and Food are skyrocketing – so other things need to be cut back. Keep that in mind when you hear one sector is doing well – that money is coming out of another sector!
So a pullback in Revolving Credit can indicate a general pullback in spending while a pullback in Non-revolving Credit (auto loans, student loans) could signal reduced big-ticket purchases, often an early indicator of economic slowdown. If Consumer Credit growth slows significantly or turns negative, it could indicate consumers can no longer afford to borrow, suggesting a potential recession and if Revolving Credit is growing faster than Non-Revolving – it shows Consumers are stretched and on a non-sustainable path (thanks math!).
Counter-intuitively, if we see a significant increase in Consumer Credit – it will indicate to the Fed that rates ARE NOT HIGH ENOUGH – as it is not deterring people from borrowing. The Fed WANTS an ALMOST Recession – they NEED to slow demand enough to take pressure off of prices – the way people cutting back on Big Macs caused McDonalds to create $5 Meal Deals. It’s up to our dealers to figure out how to keep the customers alive at this point…
So we are going to watch for variations in different types of credit (auto loans, student loans, credit cards) as they can indicate which sectors of the economy are under the most pressure and, as we noted yesterday in our Live Member Chat Room – rising delinquencies, especially in credit cards, could be a red flag for impending economic troubles.
Meanwhile, the recovery continues with the Dow looking like it’s up 300 points pre-market (8:43) and the S&P is up 58 points (5,328), Nasdaq +246 (18,323), Russell +33 (2,097) and NYSE +62 (17,984). We discussed bounce levels yesterday but now is a good time to roll out the spreadsheet – which is how we originally kept track of bounces – 20 years ago!
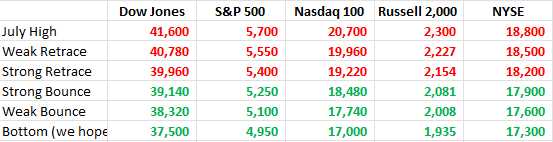
This chart of the 5% Rule™ is simply assuming the highs were legitimate and that theory holds up – as long as we don’t fail those bottoms. So far so good, the NYSE spiked down on Monday to 17,561, Dow hit 38,500, S&P 5,119, Nasdaq 17,435 and Russell bottomed out right at the 2,000 line – all pretty good from a bullish perspective and we’ve already cleared the Strong Bounce Lines (we never made it to the bottom of the range) and now we can just watch the dancing colors to clue us in to market intentions.
The 5% Rule is NOT TA – it’s just MATH! We only put it on charts because people like pictures but these little spreadsheets served us very well for a decade before we succumbed to this chart fad…
As usual, the Yen is falling again as no amount of stimulus is going to keep that puppy alive. Actually, it’s more like Schrodinger’s Currency – it’s only alive as long as you don’t look at it!
Since it’s such a major issue that will affect Global Markets for the next 12-24 months (if Japan survives that long) – I’ve asked Boaty to give us an overview of the Yen situation:
🚢 Your colorful analogy to Schrödinger’s cat aptly captures the precarious nature of Japan’s currency and economic situation. Let’s frame this in a more scholarly context:
Japan’s Fiscal Paradox: Unsustainable Debt and Currency Stability
Japan’s fiscal situation presents a unique paradox in modern economics. Despite having the highest debt-to-GDP ratio among advanced economies (closing in on 300%), Japan has managed to maintain relative currency stability and low borrowing costs. However, this stability is increasingly fragile and potentially illusory.
Key Factors:
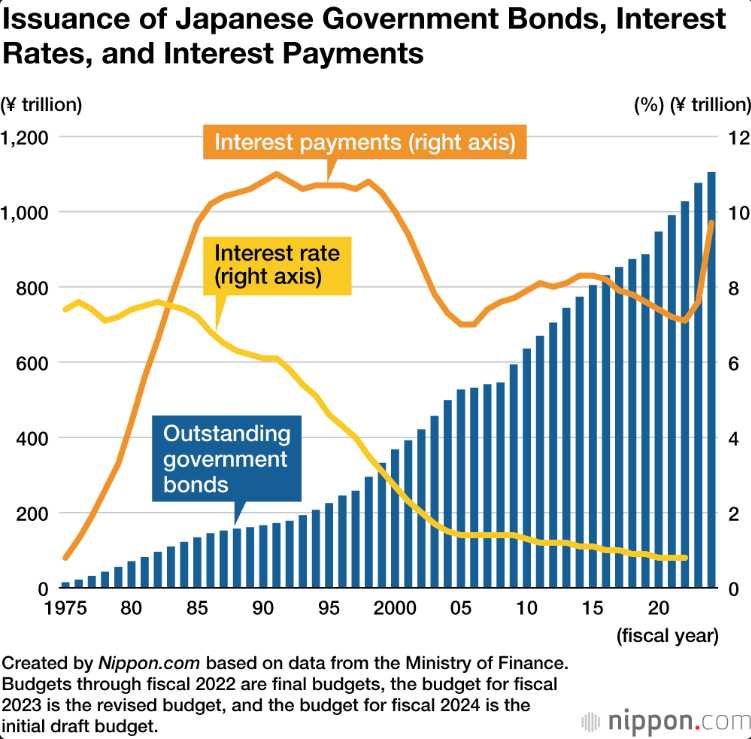
1. Massive Public Debt: Japan’s public debt stands at approximately ¥1,200 trillion ($8.4 trillion), more than twice its annual GDP.
2. Ongoing Deficits: Japan continues to run significant budget deficits, with the primary balance (excluding debt service) remaining negative.
3. Low Interest Rates: Despite high debt levels, Japan has maintained ultra-low interest rates, with 10-year government bond yields only recently approaching 1%.
4. Bank of Japan’s Role: The BOJ owns roughly 50% of outstanding government bonds, effectively monetizing the debt.
5. Demographic Pressures: An aging population exacerbates fiscal challenges, increasing social spending while shrinking the tax base.
![r/dataisbeautiful - [OC] Japanese government's revenue and expenditures in 2021](https://preview.redd.it/japanese-governments-revenue-and-expenditures-in-2021-v0-04eas3fkvqi91.png?width=640&crop=smart&auto=webp&s=a1c8c0f338e72b920a86df93079eb4395db8a9cb)
How can a Government be so irresponsible?
Oops…
Mechanics of Sustainability:
The sustainability of this system relies on a delicate balance:
1. Domestic Ownership: Over 90% of Japanese government bonds are domestically owned, reducing external vulnerabilities.
2. Deflationary Environment: Persistent deflationary pressures have kept real interest rates low, despite near-zero nominal rates.
3. High Savings Rate: Japan’s high domestic savings rate provides a stable funding source for government debt.
4. Monetary Policy: The BOJ’s yield curve control and massive asset purchases have artificially suppressed borrowing costs.
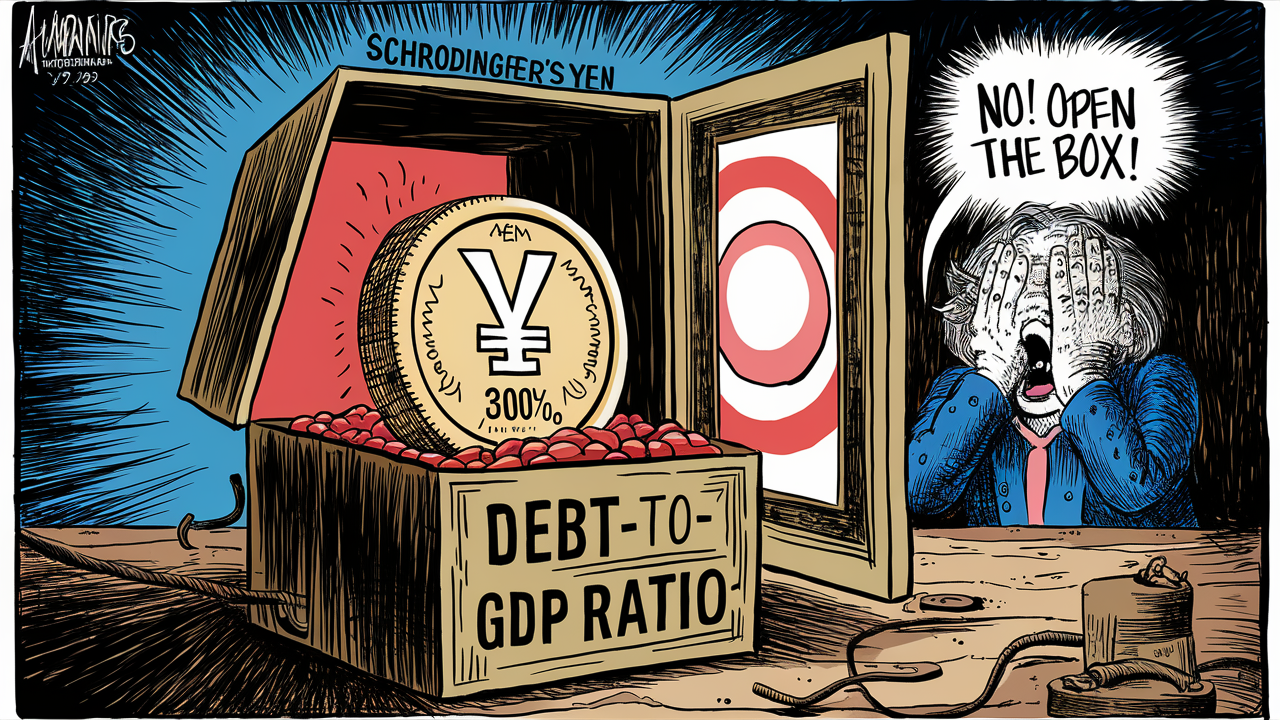
The Schrödinger’s Currency Analogy:
The yen’s stability, like Schrödinger’s cat, exists in a state of quantum superposition. It appears stable as long as the underlying fiscal dynamics remain unexamined or unchallenged by market forces. However, any significant shift in perception or policy could rapidly collapse this stability.
Potential Triggers for Instability:
1. Interest Rate Normalization: Even a modest rise in interest rates could dramatically increase debt servicing costs.
2. Inflation: Sustained inflation could erode the real value of government bonds, potentially triggering a sell-off.
3. Loss of Confidence: A shift in domestic sentiment could lead to reduced willingness to fund government debt.
4. External Shocks: Global economic disruptions could expose the fragility of Japan’s fiscal position.
Conclusion:
Japan’s fiscal situation represents a unique economic experiment, testing the limits of modern monetary theory and fiscal sustainability. While the yen has shown remarkable resilience, the underlying fundamentals suggest this stability is increasingly tenuous. The potential for a sudden loss of confidence or external shock to disrupt this equilibrium remains a significant risk, akin to opening Schrödinger’s box and collapsing the wave function of Japan’s economic stability.
Citations:
[1] https://www.reuters.com/breakingviews/japan-has-ways-avoid-sovereign-debt-crunch-2024-06-07/
[2] https://www.spglobal.com/ratings/en/research/articles/240227-sovereign-debt-2024-asia-pacific-central-government-borrowing-stabilizes-at-close-to-us-4-trillion-13009511
[3] https://www.mof.go.jp/english/policy/budget/budget/fy2024/02.pdf
[4] https://www.aljazeera.com/economy/2024/4/30/why-is-japans-yen-so-weak-against-the-us-dollar
[5] https://www.goldmansachs.com/insights/articles/the-japanese-yen-will-likely-remain-weak-for-months-to-come
[6] https://www.elibrary.imf.org/view/journals/002/2024/118/article-A001-en.xml
[7] https://english.kyodonews.net/news/2024/05/6ab8cf772d00-japan-govt-urged-to-address-higher-debt-costs-fiscal-reform.html
Let’s be careful out there!


")

