
5,346.56
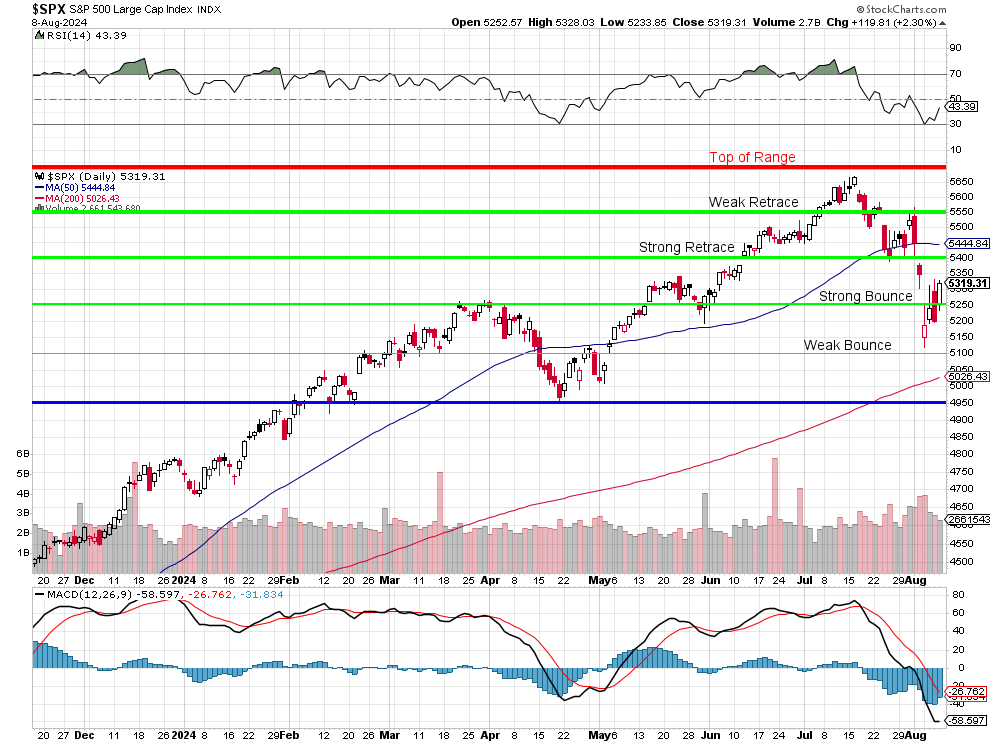
That’s where the S&P closed last Friday after a 30-point drop that day and it was down 100 from the day before but we started that week at 5,459.10 so really not much happened last week and yesterday we closed at 5,319 – so not much happened this week either – did it?
For the Nasdaq, last week we finished at 18,440.85 and the week before it was 19,023.66 so yesterday’s 18,413.82 close is nothing but stability by comparison. In reality, we’re testing that strong bounce line once again – just as we did in March – which did not end well, actually…
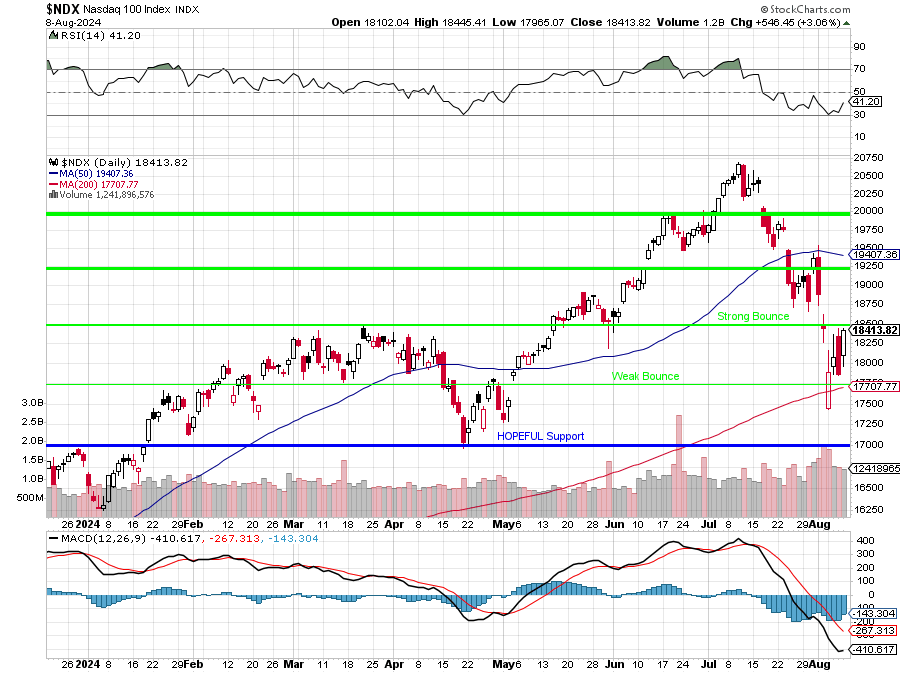
We do have support from that rising 200-day moving average, which has held like a champ this week and the MACD is oversold and RSI is oversold so we MIGHT make it over that Strong Bounce line before the 50 dma crashed under the Strong Retrace line at 19,250 and THAT would be a good sign. The big Nasdaq earnings are out of the way and there’s not a lot of economic data or even much Fed speak – so technicals are driving the bus right now.
For our Members, we aim to simplify the madness with our very easy-to-follow 5% Rule™ Spreadsheet, which shows where we are within our very-accurately predicted ranges:
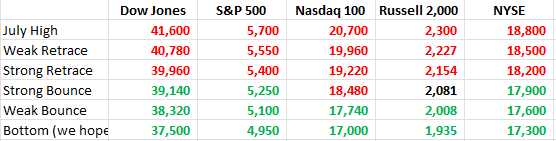
It’s pretty easy to follow, more green is good – more red is bad. Yesterday, the Nasdaq and Russell lost green boxes (black means on the cusp), so we doubled down on our hedges into the weekend – just in case. That’s what this summary chart is – a warning signal that gives us the current market trend – VERY USEFUL in times of crisis to give us an objective perspective.
The VIX is a more subjective perspective but certainly not one to be ignored. Though we’ve calmed down considerably from Monday’s highs – the Volatility Index is still 50% higher than is was in July or has been since the mini-market crash we had in April (-18%).
5,650 to 5,150 has only been 10%(ish), so far and our hedges protect us for a 20% drop from here – all the way down to 4,250 – which is well below the major support line the 5% Rule™ predicted on the Nasdaq chart we’ve been tracking since the 2022 crach and, as you can see, it’s still nailing those consolidation points – 2 years later!
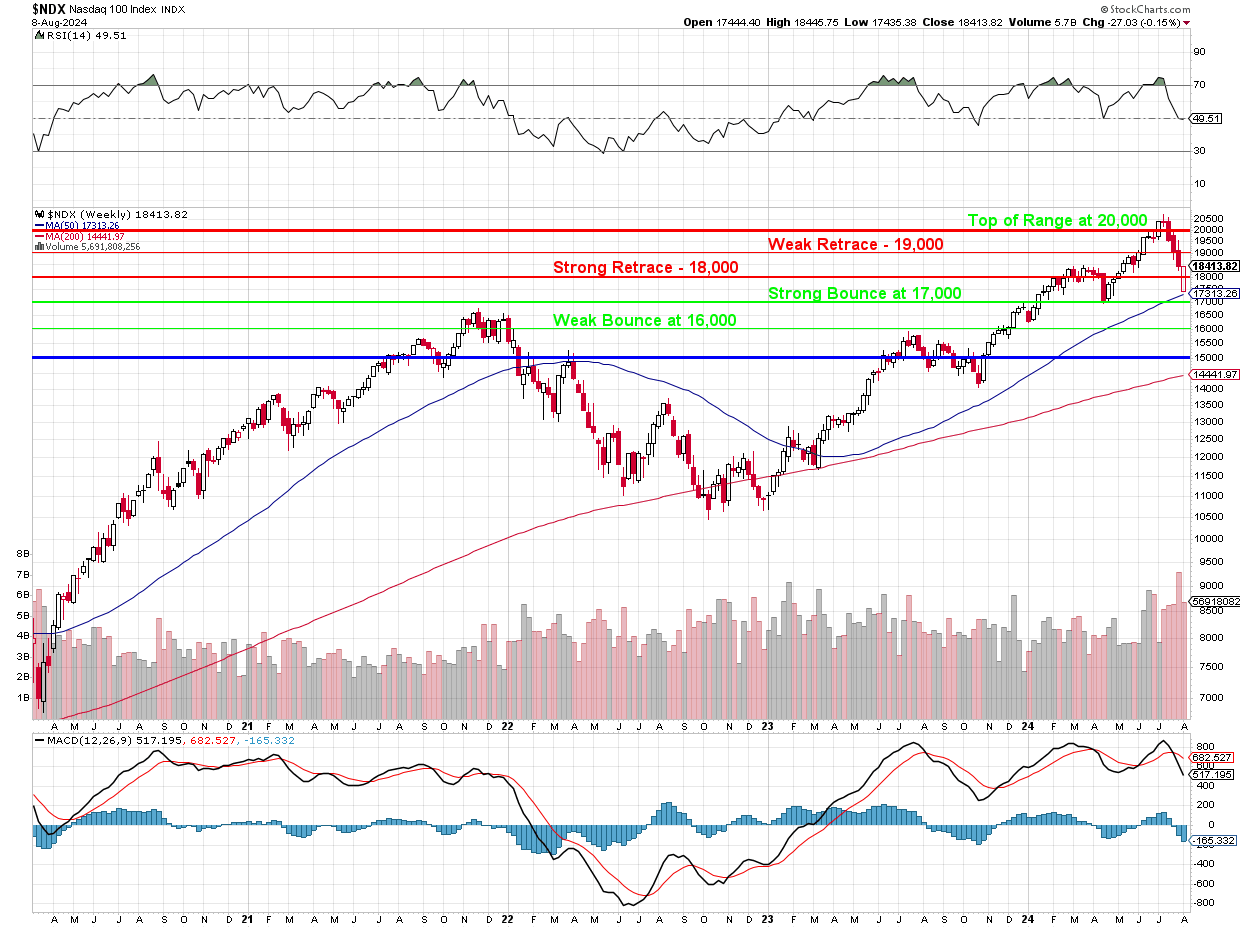
So, in the BIG picture, all this nonsense is just a Strong Retrace of the massive rally from 10,000 to 20,000 (the blue 15,000 line was the midpoint) and AI brought the Nasdaq along faster than we expected but it didn’t change the core valuation – it just accelerated it. Inflation had a more profound effect as it makes it SEEM that companies are making more money but, adjusted for Inflation – they are clearly making less – which is why we were, fortunately, extremely cautious around the top.
The Bounce Chart keeps us from mistaking a bounce for a rally – and that is critical when we have these market corrections and I do believe this is a CORRECTION – which means we are now at the CORRECT levels and not likely to rocket back to 20,000 – we could even drop another 10% and still be in a bullish market, and that is why we revised our Watch List last month – so we’d have plenty of target stocks to buy when they went on sale.
As we wrap up this turbulent week, the markets appear to be taking a much-needed breather. After a series of wild swings, the S&P 500 is poised to end the week just a half percent below last week’s closing level. Despite the volatility, there’s cautious optimism heading into Friday, with chipmakers like TSM and NVDA giving the Nasdaq a boost in premarket trading.
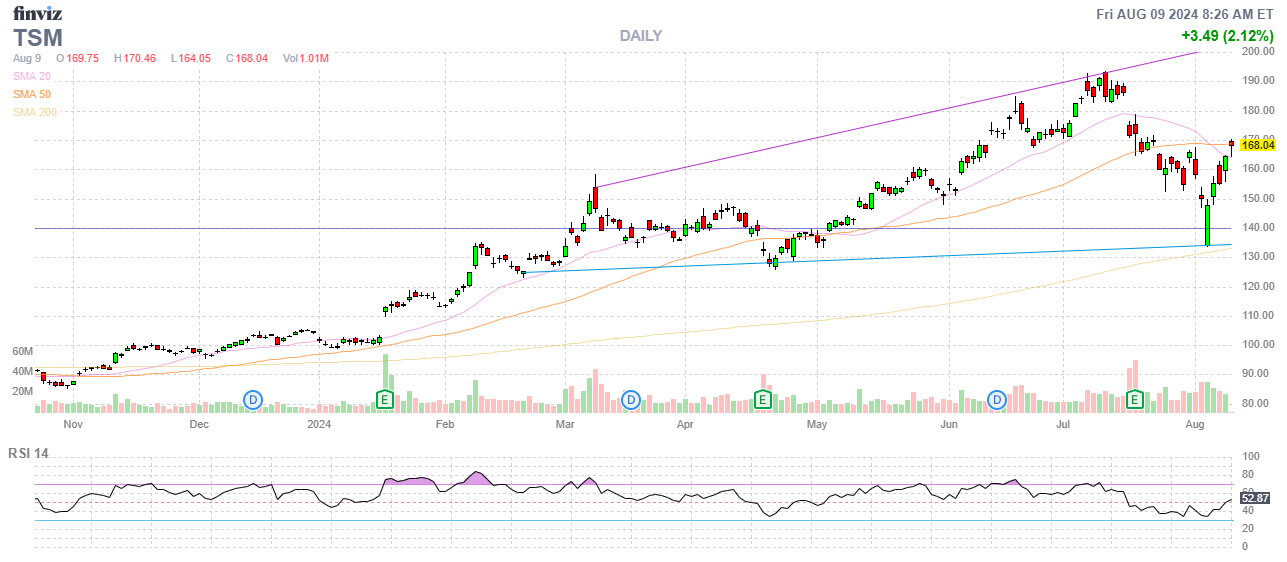
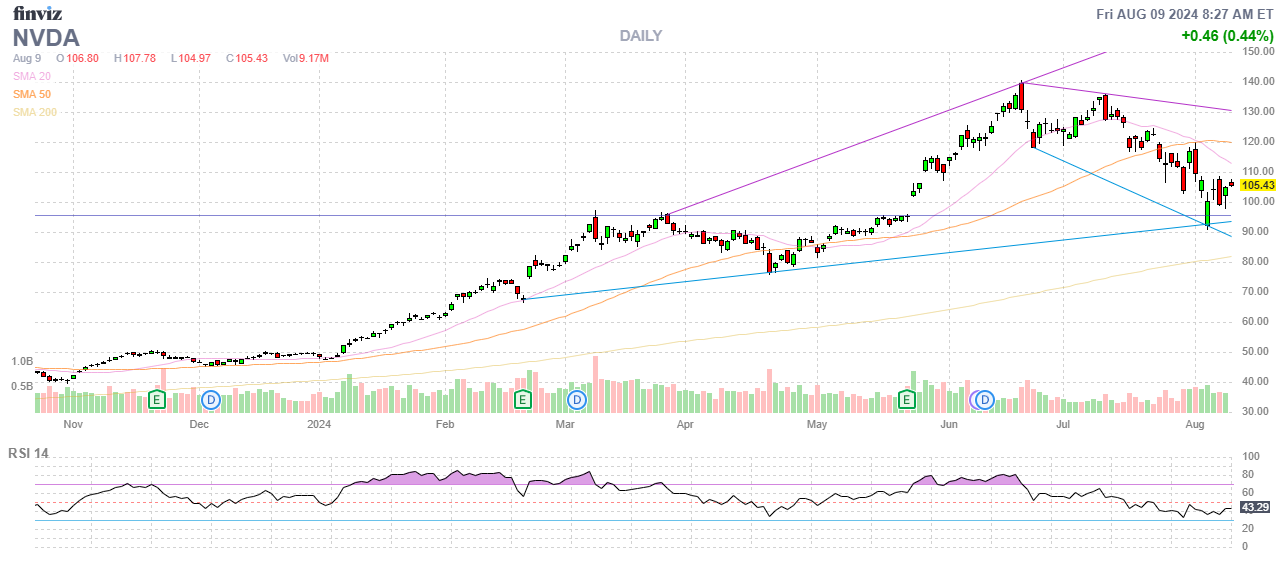
TSM’s 45% year-over-year revenue jump in July has reignited interest in AI-related chipmakers. This has bolstered the likes of NVDA, AMD, and MU, driving the Nasdaq higher. The strong performance of these chipmakers suggests that the AI hype, while questioned by some, is still propelling significant investment in the sector. This optimism helped counterbalance the broader market’s jitters earlier in the week.
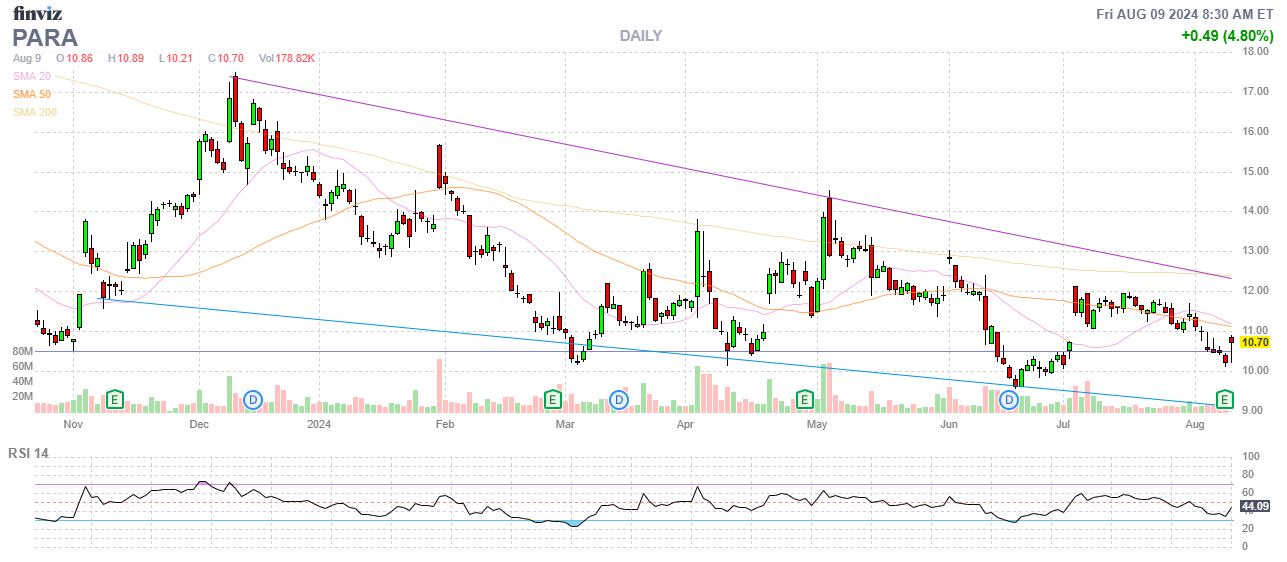
PARA announced significant layoffs and reported an operating loss of $5.3 Bn for Q2, coupled with a nearly $6 Bn Goodwill Impairment charge. Despite the grim news, Paramount’s stock rose in off-hours trading as investors feel the worst is in and now look forward to their pending acquisition at, supposedly, $15/share!
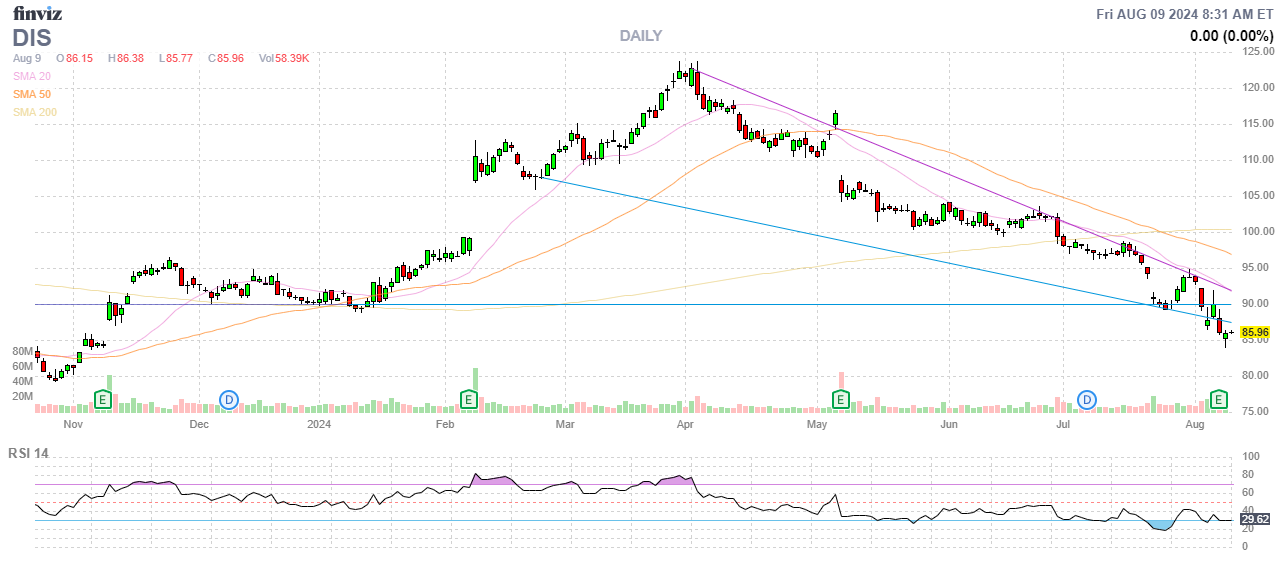
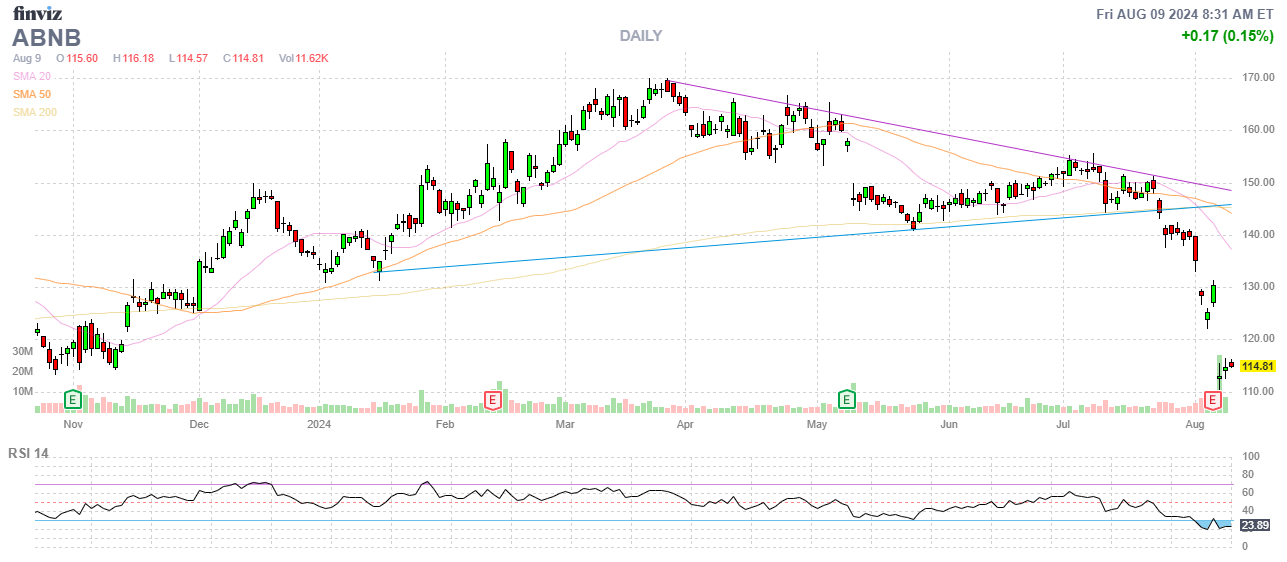
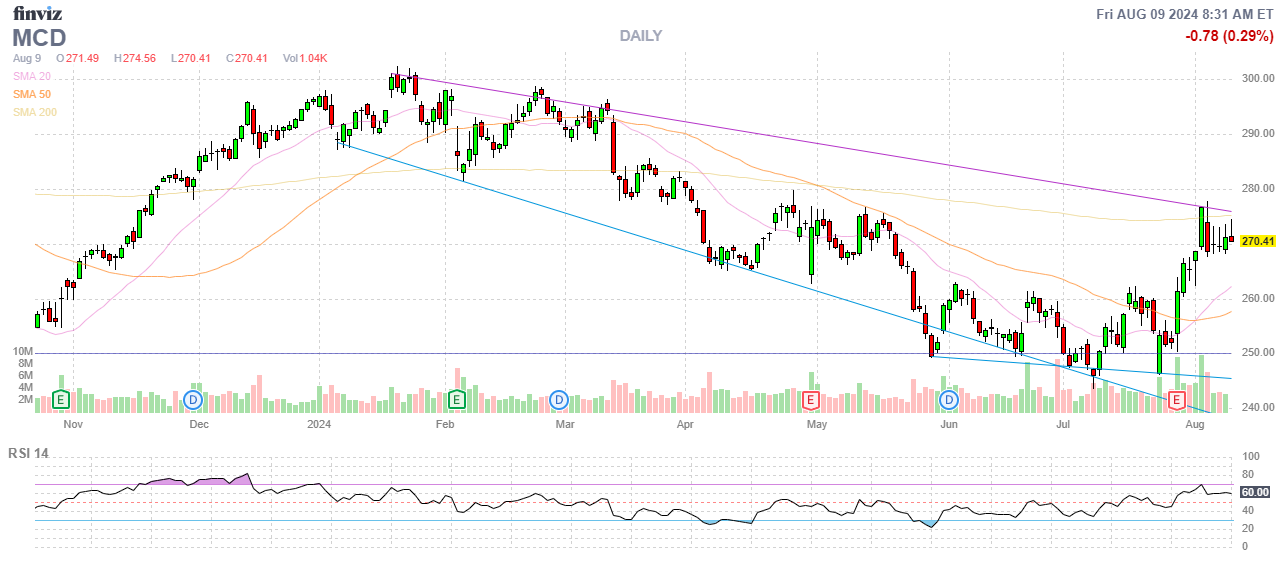
DIS reported softening demand at its theme parks, attributing the decline to ongoing economic uncertainty and perhaps an end to Consumers’ ability to borrow money for non-essentials. This mirrors broader concerns about consumer spending, especially as companies like ABNB and MCD, who also flagged similar issues.
Indeed the U.S. economy appears to be at a crossroads. While inflation has been somewhat tamed (and we have CPI and PPI next week to see if that’s so), the recent slowdown in Hiring and rise in Unemployment have rattled Investors. Companies across various sectors have reported softening demand, raising concerns about whether the economy can achieve a soft landing or if a recession is imminent.
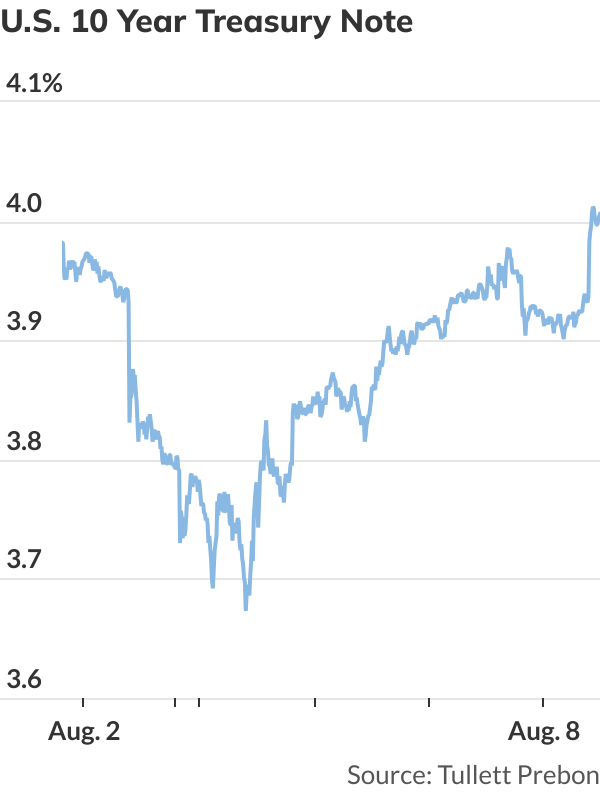
Despite the jobless claims boost, the U.S. Treasury’s 30-Year Bond Auction was less than stellar, signaling potential concerns about long-term economic stability. This reflects a complex environment where investors are weighing the prospects of rate cuts against underlying economic vulnerabilities.
Consumers are certainly exhibiting caution, cutting back on discretionary spending and delaying major purchases. This behavior is crucial as Consumer Spending accounts for two-thirds of the U.S. economy.
Despite crashing after last week’s Fed Meeting and Powell’s comments, Wall Street’s anticipation of a rate cut by the Fed in September has once again reached a fever pitch, especially after the mixed economic data this week. The odds of a 50 basis point cut have surged, indicating that markets are pricing in a significant slowdown in economic activity. So, yay, I guess…
As earnings season draws to a close, the market is left grappling with mixed signals. The tech sector’s resilience, particularly in AI-related stocks, offers a glimmer of hope, but the broader economic landscape remains murky. Rate cut fever has gripped Wall Street, but this enthusiasm is tempered by the realization that aggressive cuts might be a harbinger of deeper economic troubles.
For investors, the key takeaway this week is the importance of staying nimble. The market’s recent volatility underscores the need to balance optimism with caution, particularly as we await more economic data and the Fed’s next move. Next week will be critical as investors digest new inflation data and prepare for Jerome Powell’s remarks at the upcoming economics forum. The ongoing earnings reports from major retailers like Walmart will also provide further insights into consumer behavior and the health of the U.S. economy. While the roller coaster may have paused for now, the ride is far from over.
Have a great weekend,
-
- Phil


