I finally finished the Portfolio Reviews!

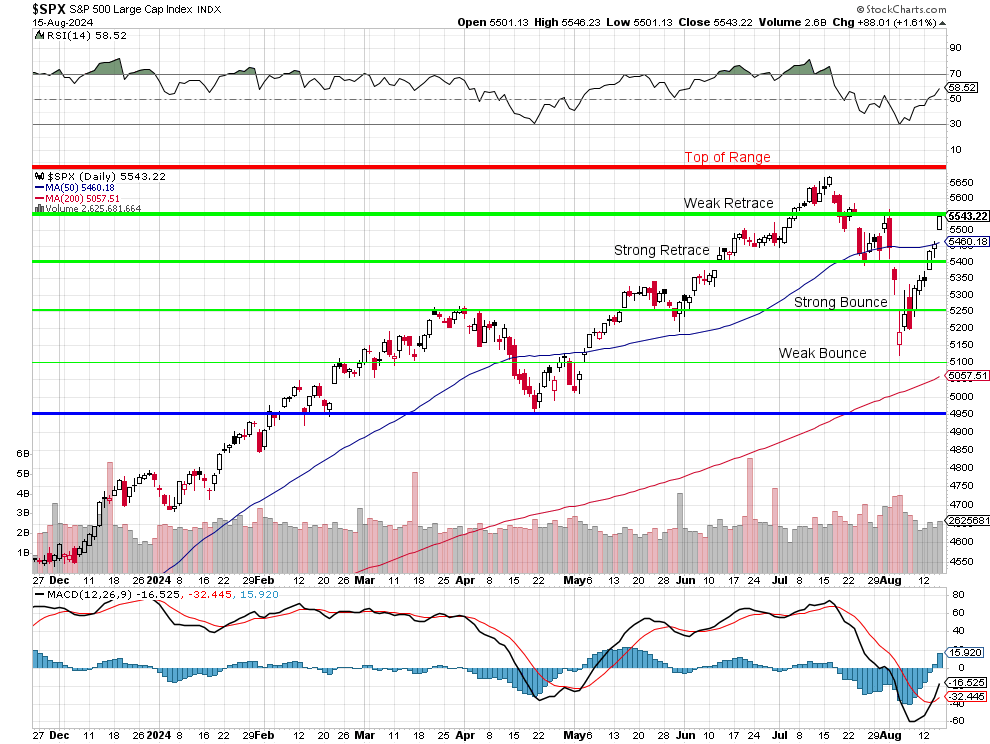
The S&P chart says it all, we collapsed right after doing our July reviews on the 16th and then had this spectacular recovery in August and, here we are – pretty much back where we started – now what?
I was actually surprised with how many bullish adjustments I was making but our portfolios handled the dip pretty well (battle-tested!) AND we began our review by bringing our Short-Term Portfolio (STP) hedges back to $1,290,850 – so I feel like we’ve got a pretty good insurance policy for our long portfolios.
Also, very fortunately, on July 16th we sold $140,000 worth of short calls in the Long-Term Portfolio (LTP) and we didn’t buy too many back so we’re pretty well-covered against another short-term dip and I DO NOT like how rapidly the RSI has jumped back to 65 (70 is too high). We are almost certainly going to be rejected by the Strong Retrace line this morning but the 50 dma will be support – so I’m not too worried about this weekend but which way we break between those lines will tell the story for the rest of August.
In the WSJ, James Mackintosh argues that U.S. stock markets, particularly large-cap stocks like those in the S&P 500, are currently overvalued according to several well-established valuation tools. The article highlights three key metrics: the Cyclically Adjusted Price-to-Earnings (CAPE) ratio, the forward Price-to-Earnings (PE) ratio, and the Fed Model. All three suggest that current stock prices are high relative to historical norms, and this could mean that the recent market rally might be a “fools’ rally” rather than a sustainable recovery.
-
CAPE Ratio:
- The CAPE ratio, developed by Yale professor Robert Shiller, is currently at 35 times the average of the past decade’s earnings, adjusted for inflation. This level is the third highest in history, surpassed only by the peaks seen before the 1929 crash and during the dot-com bubble.
- The high CAPE ratio suggests that the market is “wildly expensive” compared to historical standards. If history is a guide, such high valuations could precede a significant market correction.
-
Forward PE Ratio:
- The forward PE ratio, which is based on analysts’ earnings estimates, also indicates that stocks are highly valued – less expensive than in 2000 or late 2020, but still at elevated levels.
- One of the criticisms of the forward PE ratio is its reliance on Analysts’ forecasts, which can be overly optimistic or influenced by short-term market trends.

3. Fed Model:
-
- The Fed Model compares the earnings yield of stocks (the inverse of the P/E ratio) to bond yields to determine whether stocks are cheap or expensive relative to bonds.
- Currently, the Fed Model indicates that stocks are very expensive compared to Treasuries, similar to levels last seen before the 2002 market downturn.
Mackintosh’s analysis suggests that the recent rebound in the stock market could be precarious, with several indicators pointing towards overvaluation. Historically, high CAPE and PE ratios have been followed by periods of lower returns, and the Fed Model’s current reading adds to the cautionary outlook – especially when that model may also tip the Fed to hold off on policy easing if they believe the stock market is still over-heated!
So CAUTIOUSLY optimistic is what best describes our positions at the moment but that will change quickly if 5,400 (Strong Retrace Line) fails us again – that could be the signal for another 10% correction – all the way back to our blue line at 4,950.
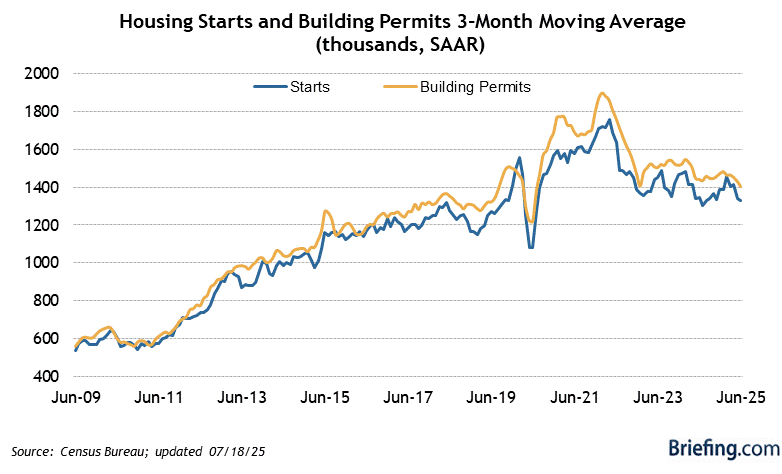
 Housing Starts are a DISASTER at just 1.238M as hurricanes have put a damper on job sites in the last couple of months. There are 110M homes in the US and that’s a replacement rate of once every 100 years and, if you can’t see your home being livable in 100 years – you can see where the problem is. The problem is we’re also short 5M homes so we need more like 2M homes to be built every year for 10 years just to catch up – we’re miles off that target, which means we’re falling further behind and housing prices will continue to inflate due to lack of supply.
Inflated land cost, high interest rates, materials, labor costs (no immigrants!) and weather are hammering the building industry and no one starts building homes they can’t sell so, if the costs can’t be passed on to the consumers – the builders just don’t build – that’s where we are at the moment.
Multi-Family housing starts INCREASED 19.6% in June – so our children will be renters and not owners of their homes – that’s the future we are building at the moment…
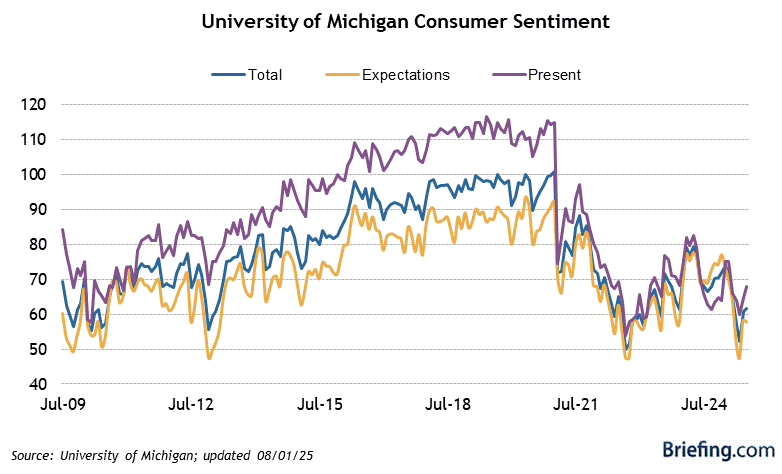
We have Consumer Sentiment at 10 and we’ll see how that looks but, recently, it’s looked like a Recession is not coming – it’s already here – and that is true for the bottom 60%, who are paying more and more for rents as homes get further and further out of their reach.
 In fact, according to Refin, 8.5% of the homes in the US are now priced over $1M. Even worse, the MEDIAN (half above, half below) price of homes is now $442,525 and that is up 77% from $250,000 10 years ago. That’s actually great for the “wealth” of that generation of home-buyers but they are finding that it’s only paper wealth – because no one can afford to buy their homes and they can’t afford to buy a better home with their profits – even if they do sell.
How many homes were over $1M 10 years ago? 1%. Detroit, Cleveland, Pittsburgh and Kansas City, Mo are the only major metro areas left with less than 1% of the homes valued over $1M and that’s bound to change so maybe a nice investment opportunity in those cities?
Harris is proposing a $40Bn fund to help local Governments develop solutions to increase the housing supply and I’m working with a hedge fund in New York that plans to build low-income housing around the country. There should also be an expansion of the Low-Income Housing Tax Credits – which give developers incentives to build low-income housing so good timing for the fund!
Last month, Biden called for legislation that would withhold key tax breaks from landlords who control properties with more than 50 units if they don’t agree to limit rent increases to a maximum of 5% and, of course the GOP freaked out – so hopefully there will be changes in Congress this November as we can’t afford to fall 4 more years behind on the housing crisis.
Have a great weekend,
-
- Phil


