
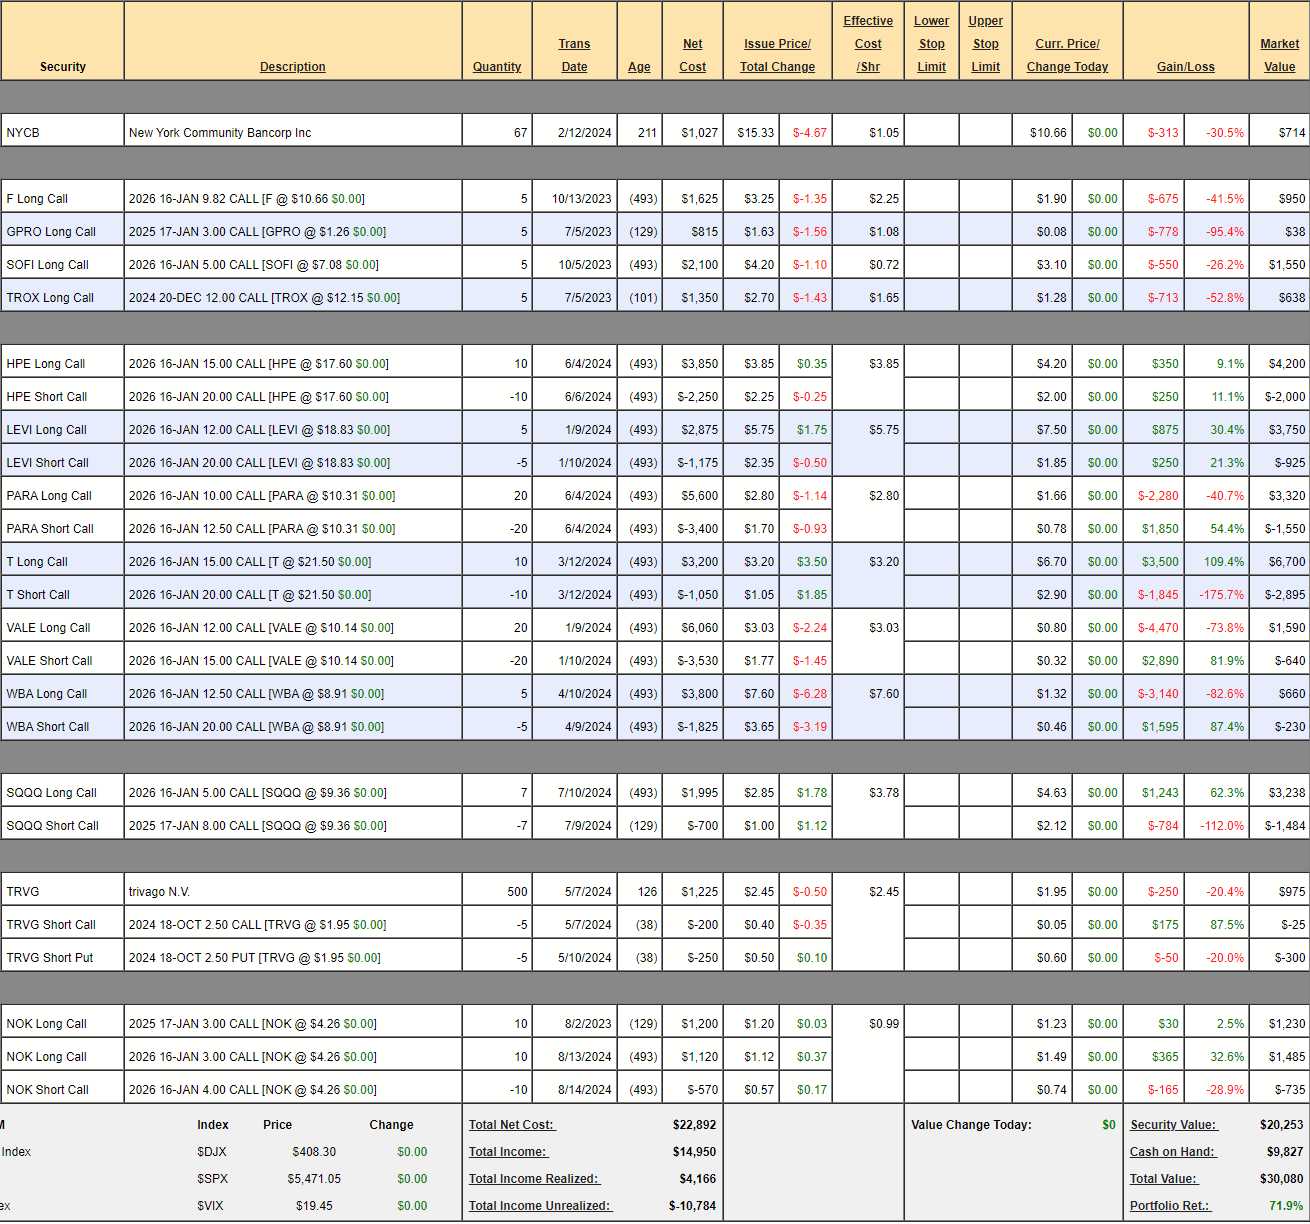
 $30,080!
That is up $4,080 since July 9th(but includes 2 more $700 deposits) so a gain of $2,680 (10.3%) during a pretty rough period in the markets makes me very, very happy indeed. Overall we’re up 71.3% from our (25 x $700) basis of $17,500 and we have $9,827 in CASH!!! – so we have room to go shopping but first we’ll see if we need to make adjustments.
We did do an August 13th Review – it just wasn’t a stand-alone but with our regular August Portfolio Reviews. We were at $27,836 then, so it’s been a pretty steady rise from $26,000 to $30,080 – despite all the market madness. That’s just the way we like it for our conservative, wealth-building portfolio.
If you haven’t been following for the past two years, we’re still on track to turn $30,800 into $1,000,000 and, at this pace, we’ll be doing it by 2036 – not 2052 as we originally planned. Realistically, I don’t think we’re that likely to sustain 35% annual returns as this is a pretty conservative portfolio but who knows – maybe AI will give us a 10-year run – like we had in the 90s (hopefully without the massive crash!).
So let’s first take a look at our positions and see if we have any adjustments to make:
-
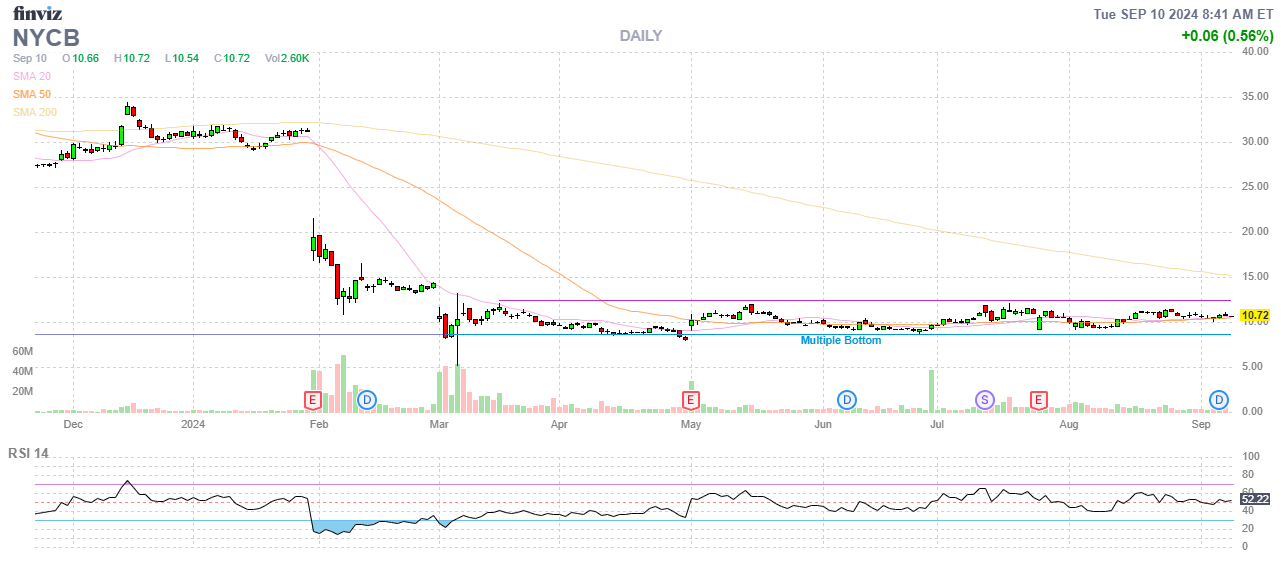
- NYCB – We bought back the short calls ahead of earnings and they weren’t great but $10 held nicely so I do think they are done going down. I’d like to see a bit of a run before selling short calls again.
-
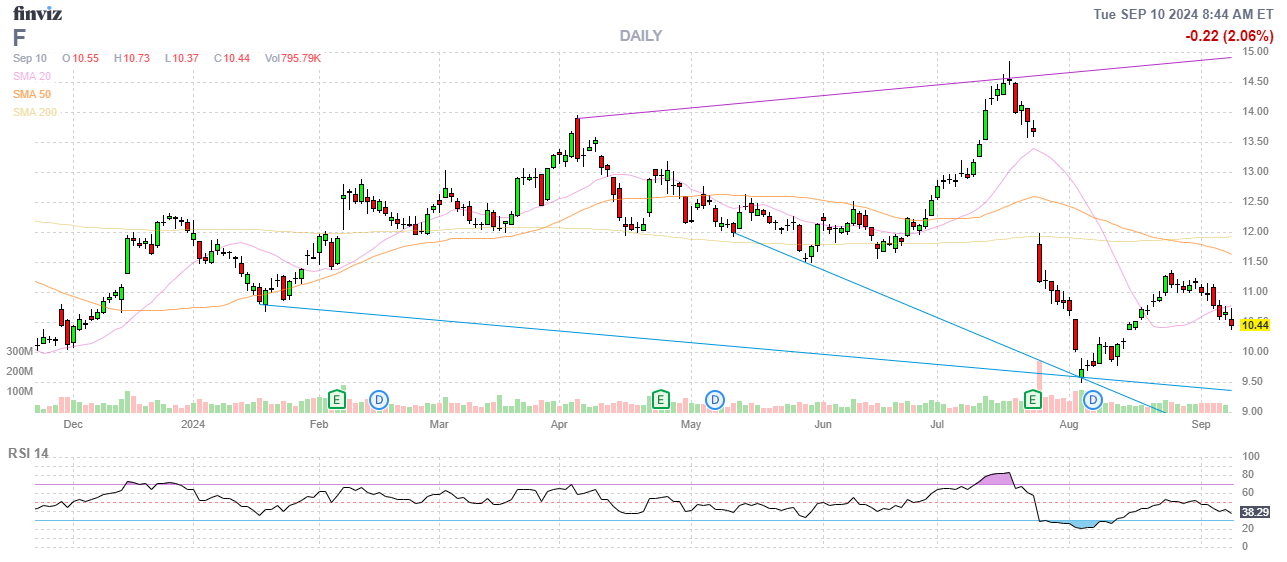
- F – Also uncovered and things were going well and then we pulled back. Earnings took a hit but that was in part due to the hack attack (the dealers, not Ford) and revenues should shift into Q3 so let’s roll our 5 calls ($950) to 7 of the Dec 2026 $8 ($3.25)/11.82 ($1.55) bull call spreads at $1.73 ($1,211) so we’re spending net $261 to move to a $3.82 ($2,674) spread that’s half in the money with $1,463 (99.3%) upside potential at $11.82 – where the 5 $9.82 calls would have only paid $2 ($1,000) at $11.82. So a more realistic target and we’re covering the calls as a hedge.
-
- GPRO – We are just hoping to get 0.20 to close these.
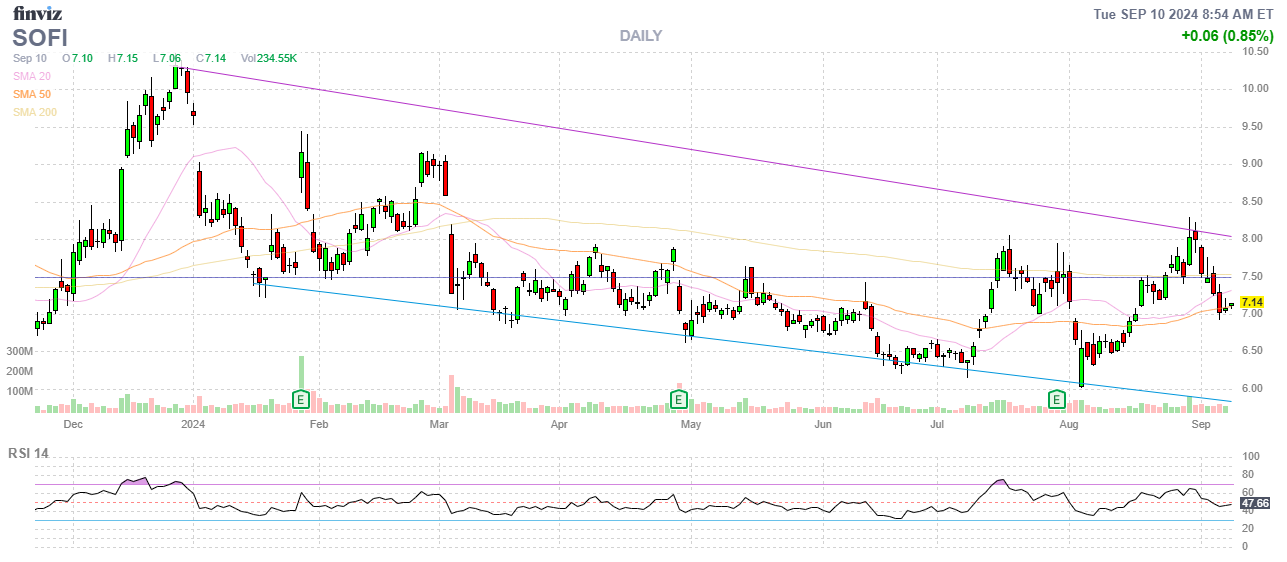
- SOFI – Always depends what day you catch them! They beat on Revenue and are growing very nicely so I’d like to give them a chance before covering.
-
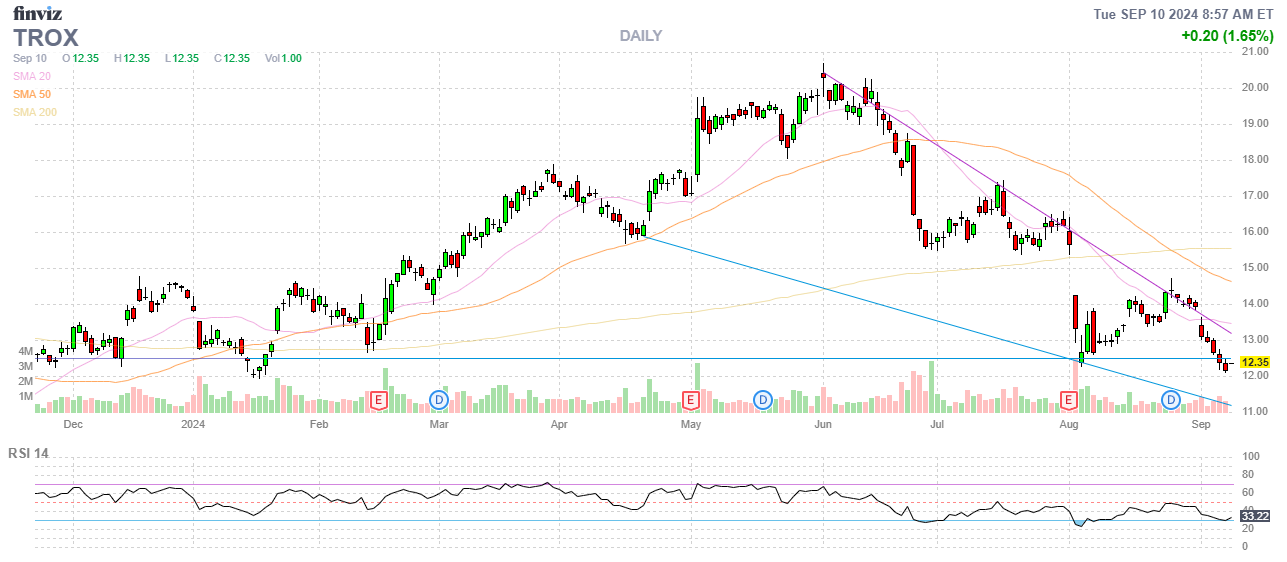
- TROX – That one hurt as they got crushed on earnings but I think $12 is a solid floor so silly to cover now. Options only go out to Feb so not quite worth rolling yet either.
-
- HPE – I liked their earnings but the GAAP EPS was a 16% miss. Still, on track for our spread so no changes.
- LEVI – Well on track.
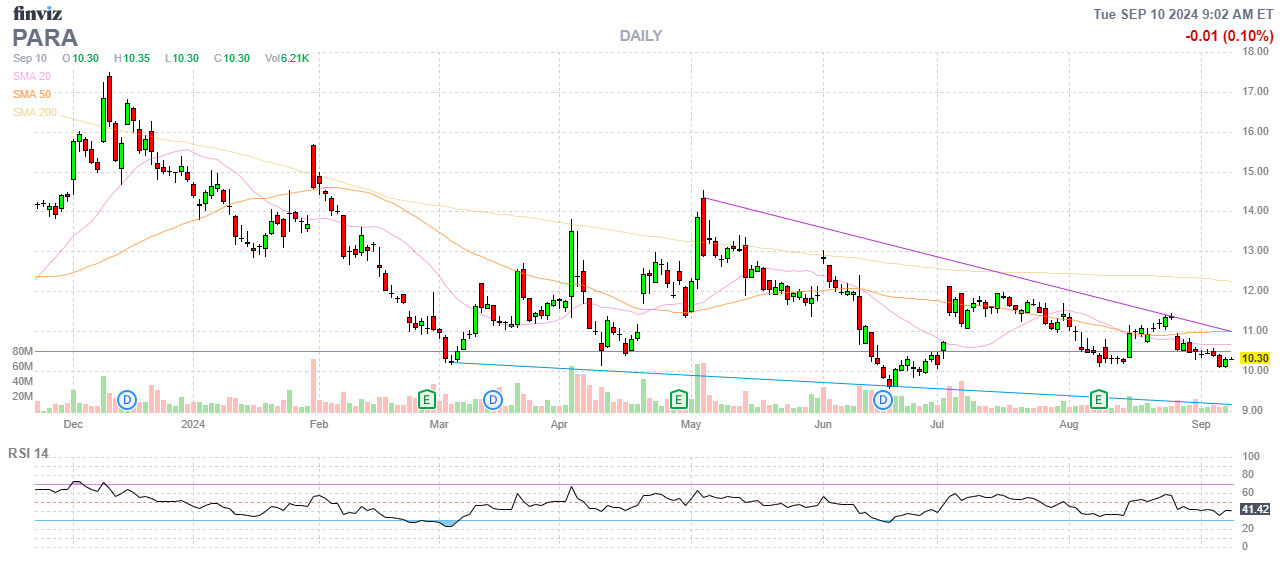
- PARA – We thought it was a conservative spread but PARA remains very stubbornly under the $15 buyout price. We have time. This $5,000 spread is only net $1,770 so there’s $3,230 (182%) upside potential in this trade alone!
-
- T – Already over our target at net $3,805 on the $5,000 spread and I’m very confident we’ll collect that last $1,195 (31.4%) over the next 17 months.
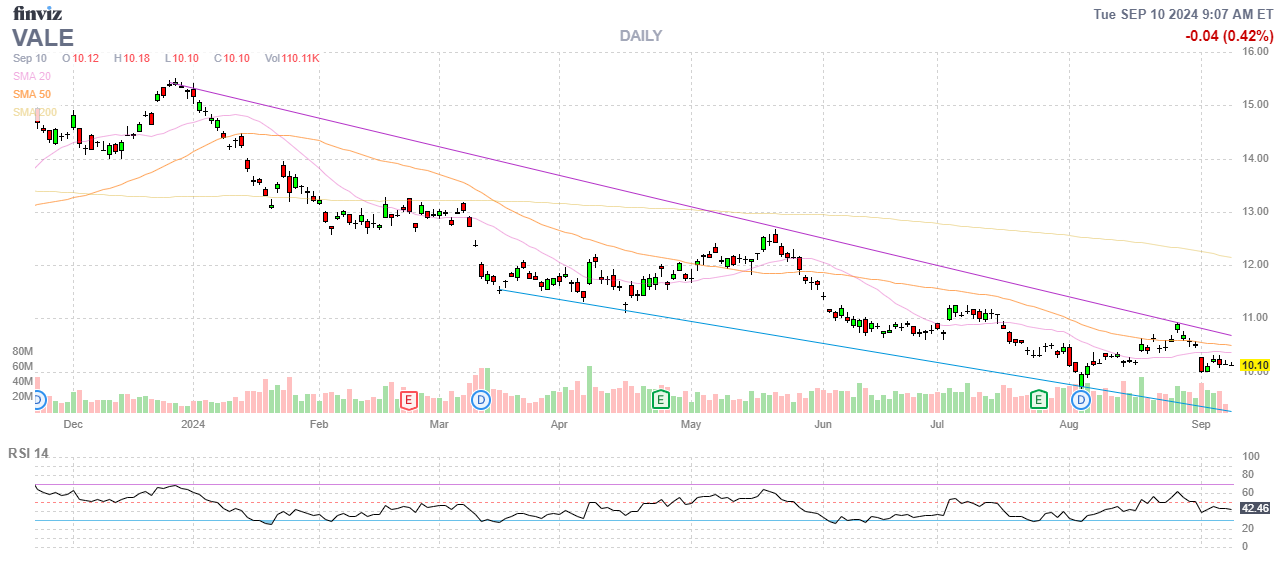
- VALE – Our trade of the year will hopefully come to life NEXT year but the collapse of China is NOT helping! Earnings were actually good (48% beat) but unresolved lawsuits (environmental) still hang overhead and guidance is very cautious due to a potential global recession. Otherwise I’d double down…
-
- WBA – So annoying! Next earnings are Oct 15th and they should make 0.51, which is $2 for the year, which means the p/e is 4.25 – ridiculous!
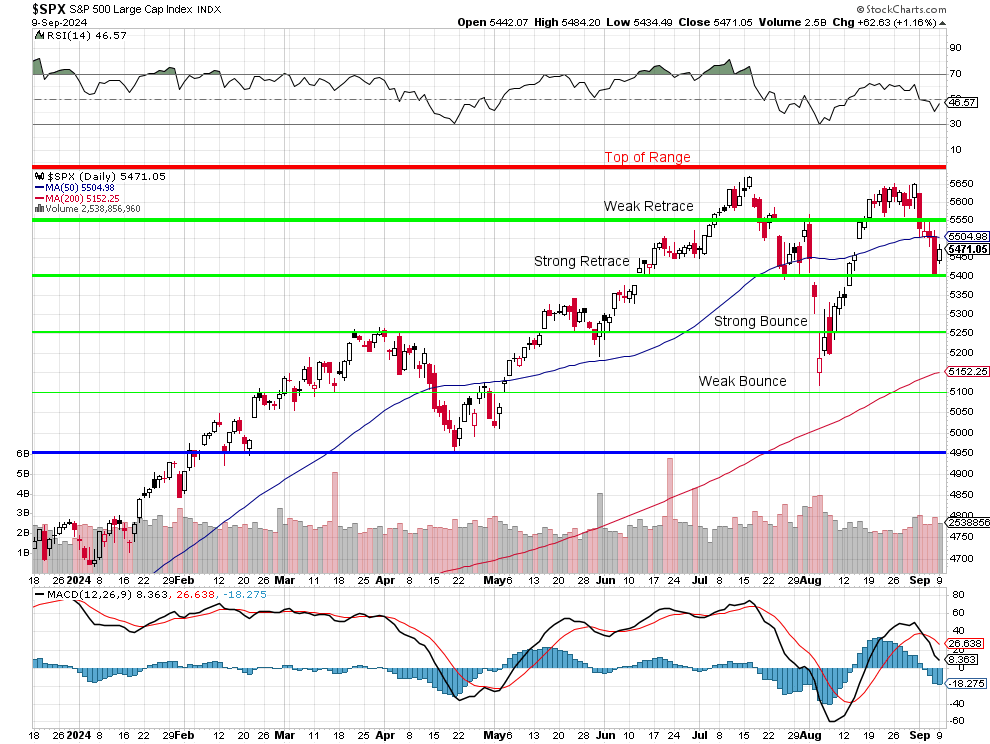
- SQQQ – We took the profits from 3 of our longs so now just a basic hedge that’s net $1,754 that will pay $2,100 UNLESS the S&P goes up at least 5% by January – in which case our longs should do well – so it’s a very nice hedge…
- TRVG – The Oct short calls will go worthless and the Oct $2.50 puts are 0.60 and the April $2.50 puts are 0.75 so we’ll roll there and collect 0.15 and we’ll sell the April $2.50 calls for 0.30 and that’s 0.45 ($450) collected against out net $775 spread so 58% for 7 months is good for me!
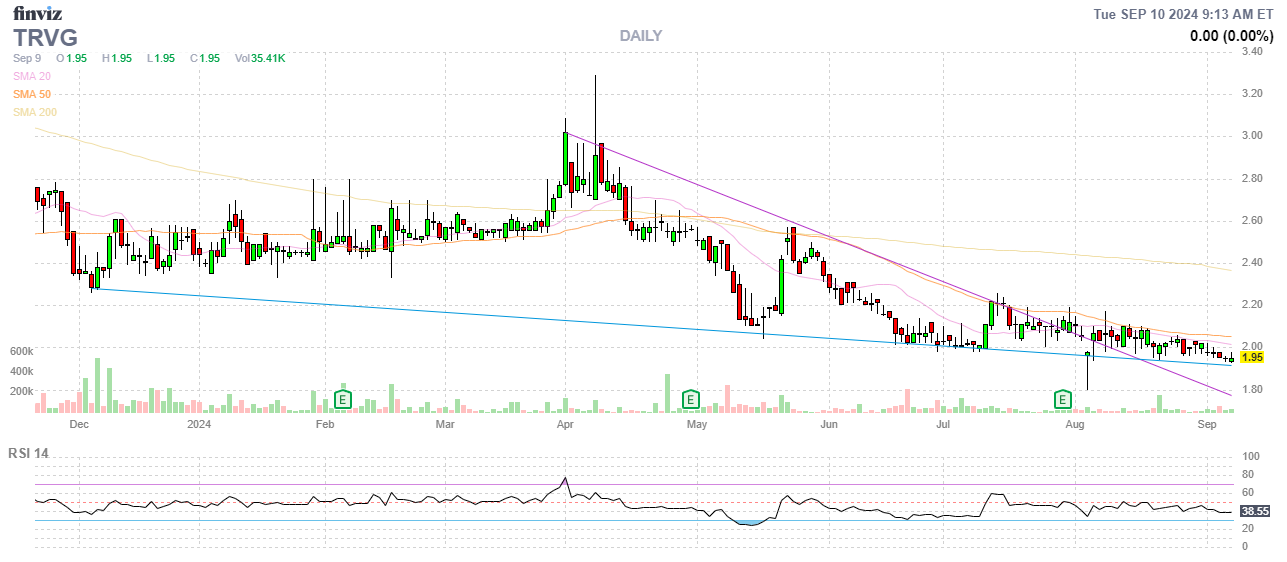
Keep in mind that, if we can turn the entire portfolio into positions that generate 58% in 7 months – we’ll have $1M by 2030!
-
- NOK – Just added the 2026 spread last month and it’s off to a good start – over our target already at net $750 on the $1,000 spread with $250 (33.3%) upside potential. We are LUCKY our original $3 calls recovered so let’s cash those out for $1,230 and rely on the remaining spread.
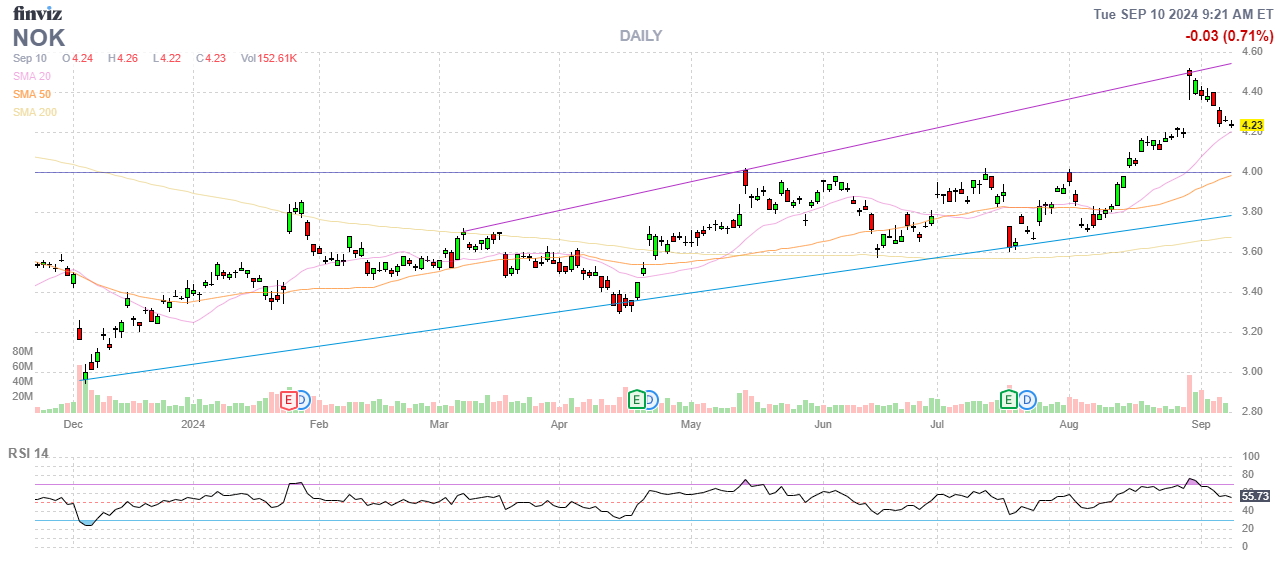
This is exactly why we took the new spread – so we could sell the naked calls with no regrets on a recovery. Unfortunately, we missed the chance to sell at the top of the channel but this is still a good outcome.
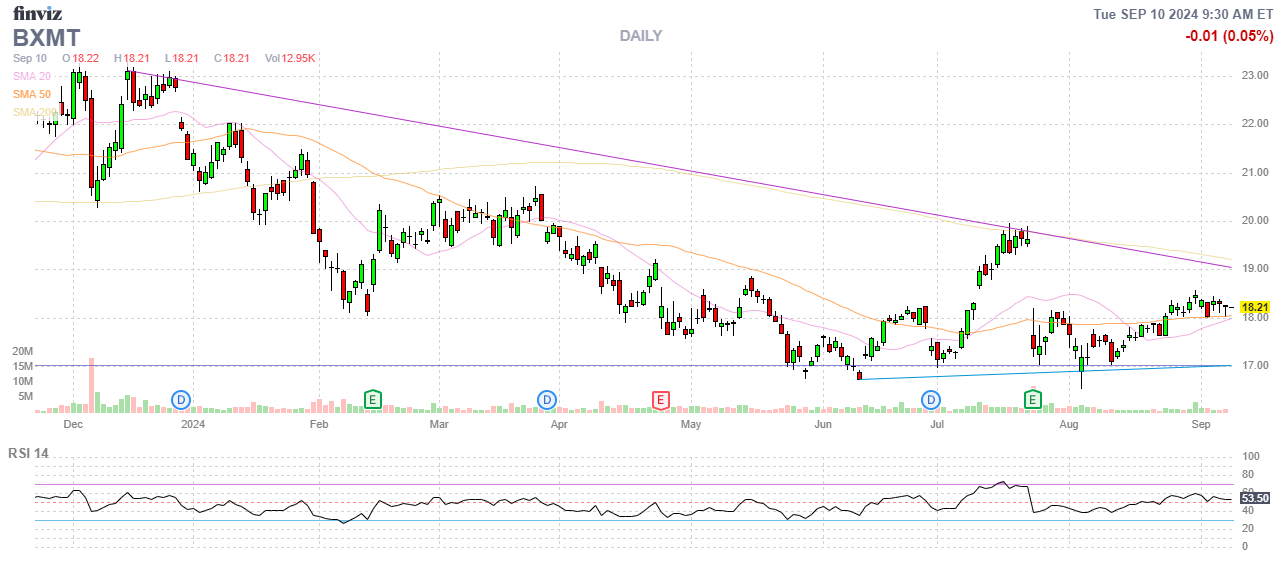
And, with that cash out, we have added net $1,419 to our CASH!!! pile with our adjustments so now we have $11,246 to go shopping with but the debate is tonight and the Fed is next week so, from our Watch List, let’s add BXMT, who are a nice dividend-payer ($1.88) at $18.22 and their earnings were decent (2% beat) with 90% of their portfolio performing and strong reserves and $1.6Bn to spend as their competition struggles.
Let’s add the following:
-
-
- Buy 100 shares of BXMT for $18.21 ($1,821)
- Sell 1 2026 $18 call for $1.65 ($165)
- Sell 1 2026 $20 put for $4.80 ($480)
-
That’s net $1,186 on the $1,800 spread so there’s $624 (52.6%) upside potential at $18 in 17 months and we have 6 dividends ($282) which is another 23.7% to collect so our net in Jan 2026 will be $904 and we either get called away with a double or assigned 100 more shares at $2,000 and then we’ll have 200 shares at $14.52 – a 20.2% discount to the current price is our WORST CASE…
$2,000 will be tied up in margin (assuming a 401K/IRA and really it’s net of the $480 we saved as a cash outlay) but we have plenty and it’s good practice to see how this sort of trade works over time.
I think that’s plenty of excitement for now, we’ll see what happens after the Fed next week, while reviewing our other portfolios.
")


