
 $32,823!
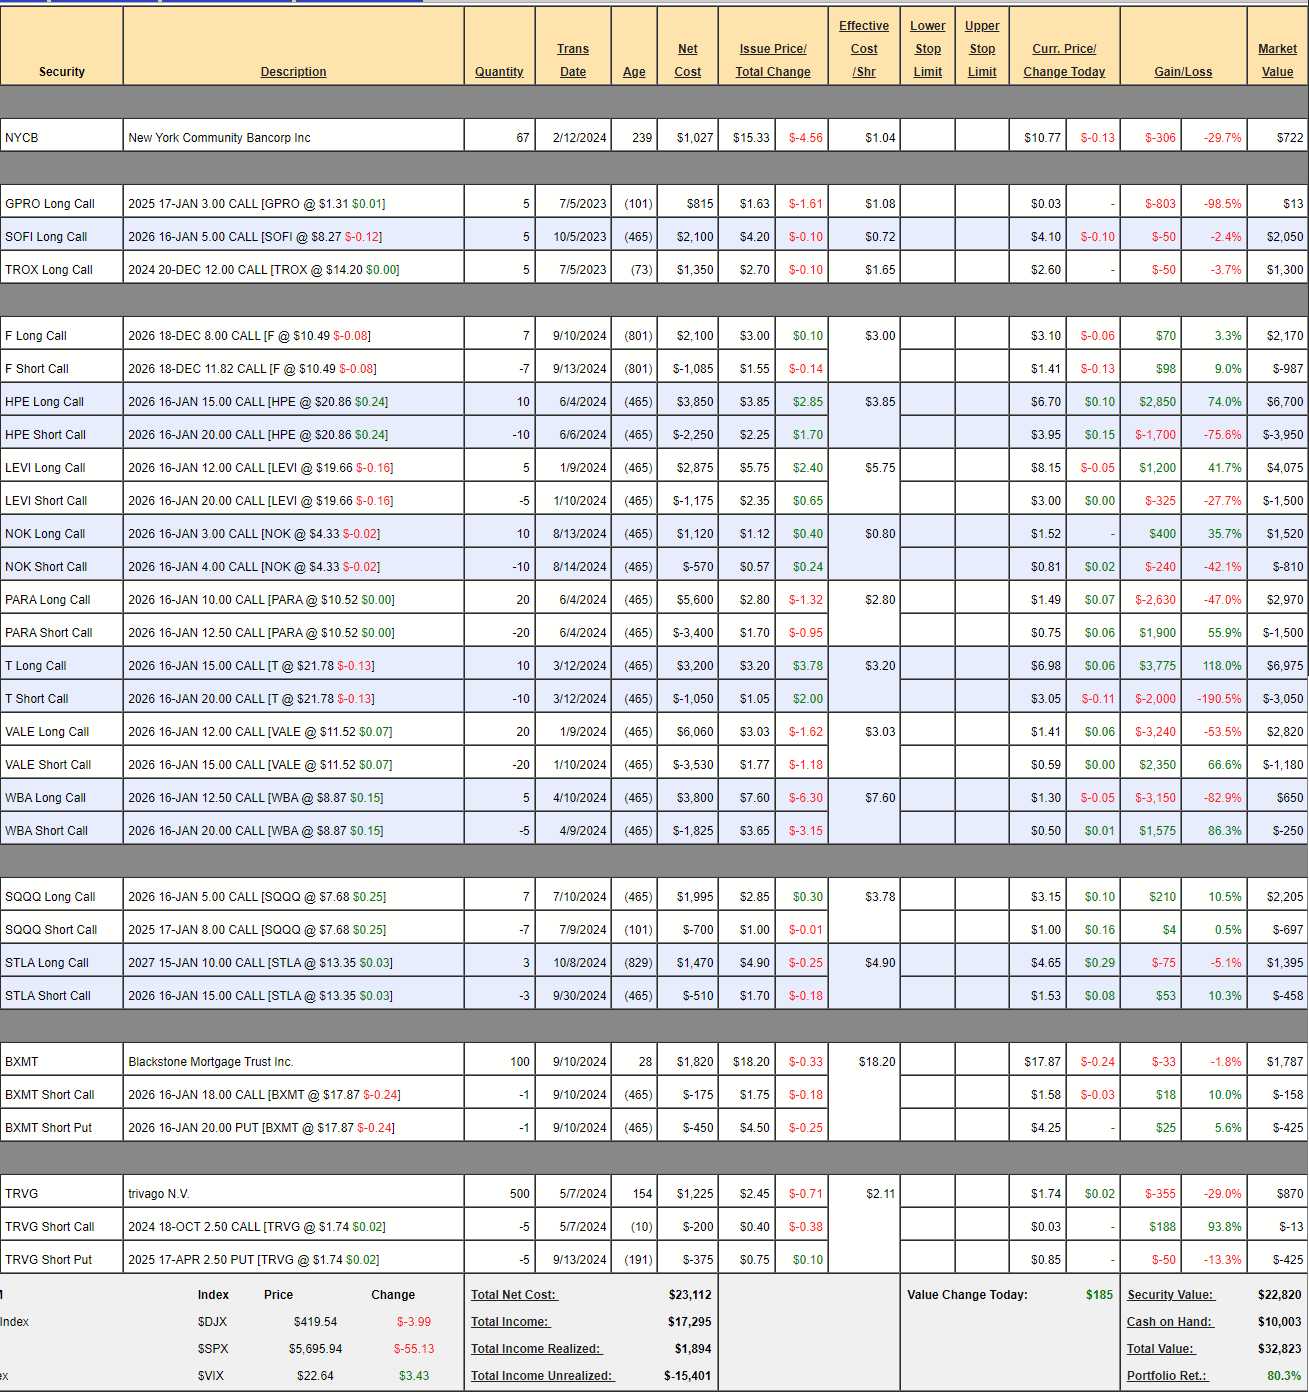
That’s up $2,743 (9.1%) since our Sept 10th Review(and includes our new $700 deposit) and, overall, we’re up 80.3% and THAT, I am totally thrilled about – as were were “only” up 71.3% overall last month and THAT is the progress we care about – because that’s our total gain on cash deposited.
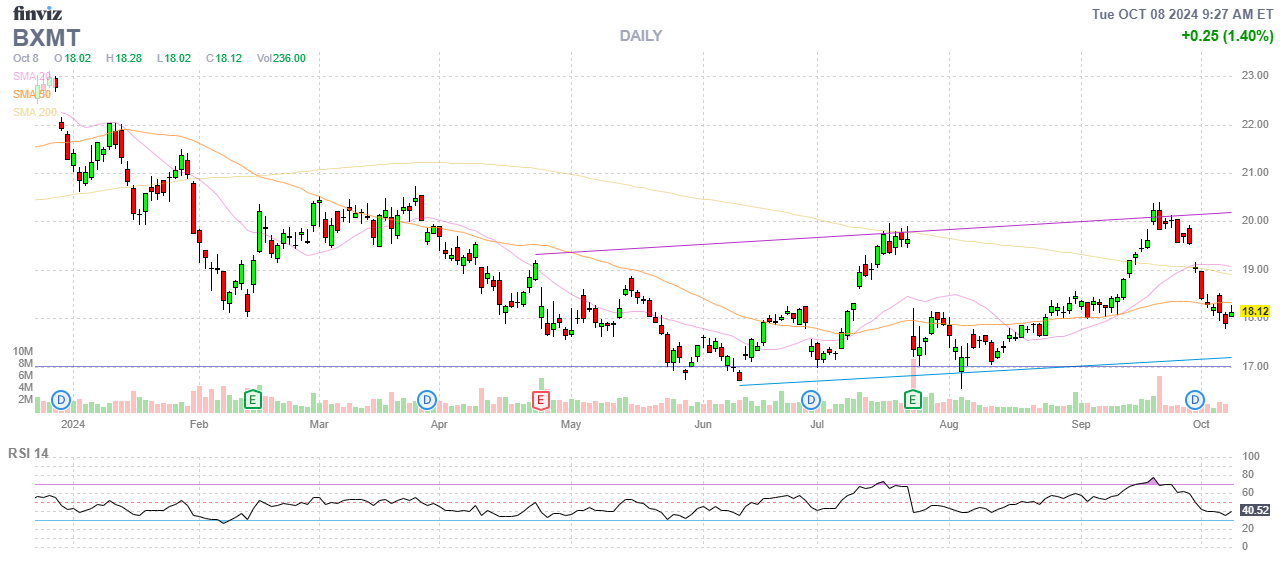
When I looked at the total this morning, it was 79 point something and I thought “aw” but then I checked BXMT and it turns out they were kind enough to pay us a dividend of $235 last Monday – and that’s 0.7% of the portfolio right there! That’s why dividend stocks are so great – it doesn’t seem like a lot but it adds up to a lot over time. Dividends are bonus money – reliably adding to our performance.
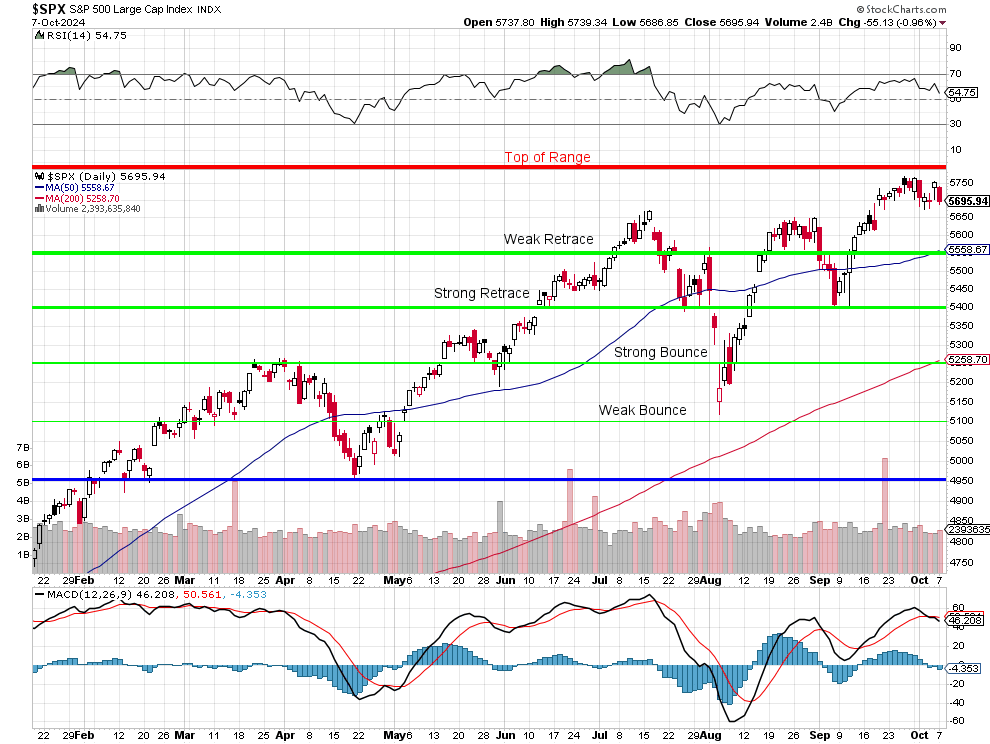
It’s a good sign that the 50-day moving average has now crossed over the Weak Retrace line at 5,550. It means that line is likely to provide solid support so we’re not likely to get caught by surprise by a big dip in the S&P, which means we can get a little more aggressive. The 200 dma has also crossed over our Strong Bounce line – which means it’s now very unlikely we get more than a 7.5% correction (5,250) without a strong bounce (5,450) so we’re going to be looking hard for opportunities this month – especially with $10,003 in CASH!!!
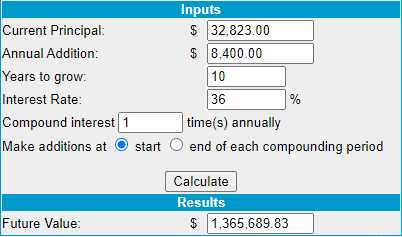 If you haven’t been following this portfolio for the past two years, we’re still on track to turn this $32,823 into $1,000,000 and, at this pace, we’ll be doing it by 2034 – not 2052 as we originally planned. Realistically, I don’t think we’re that likely to sustain 36% annual returns as this is a pretty conservative portfolio but who knows – maybe our team of AI/AGI assistants will give us a 10-year run – like we had in the 90s (hopefully skipping the massive crash at the end!).
If this kind of stuff doesn’t get you excited – I don’t know why you are investing. The premise of this portfolio has been very simple. We started with $700 on Aug 25th, 2022 and, each month, we saved another $700 and put it to work in the portfolio. We used no margin – like an IRA or a 401K – where the gains are tax-free and the deposits are deductible and, 26 months later – here we are, already up 80.2% with $32,823 and on track to get to $1M in less than 10 years from now. THAT’S FANATSTIC!!!
In case you’re wondering, it’s $995,000 in 9 years – things compound nicely if you keep making 36% a year but, again, these are crazy gains – double what Buffett averages – so we aren’t going to assume this just keeps happening but, let’s go ahead and find out:
-
- NYCB – Well, we’re going to want to cover them when they go higher and we can’t cover 67 shares so we should definitely buy 33 more at $10.77 ($355.41). That will give us 1,000 shares at $1,382.41 or $13.82/share with the stock at $10.77. The 2027 $10 calls are $4 ($400) and that would drop the net to $9.82 but that’s no fun so let’s buy 133 shares for $1,432.41 and sell 1 2027 $10 call (half cover) for $400 and then we’ve spent net $1,032.41 plus our original $1,027 is $10.29/share and PRESTO – we have reduced our cost basis from $15.33 to $10.29, which is below the current price. That is called The Salvage Play! Aren’t options fun?
- I certainly think $15 is a realistic target and, at that price, we’d get called away from 100 at $10 ($1,000) and get $1,500 for the other 100 so $2,500 and the current net (after adding) is ($722 + $1,032.41 =) $1,754.41, so our upside potential is $745.59 (42.5%). Beats cashing out now and taking a 29.7% loss – SALVAGE!
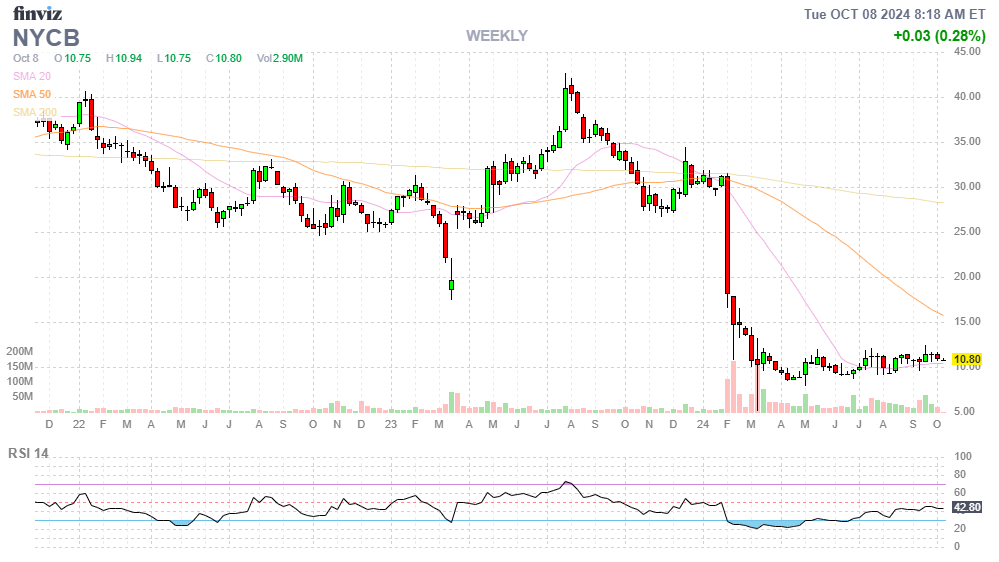
Of course, on this trade, if things are going well, we could roll the 1 short 2027 $10 call ($4) to 2 short 2027 $17 calls (now $2) and squeeze $500+ out of the first 100 and THAT is why I much prefer to leave this on the table.
-
- GPRO – They can’t all be winners. We are trying to sell on a bounce for 0.20 but no bounces yet.
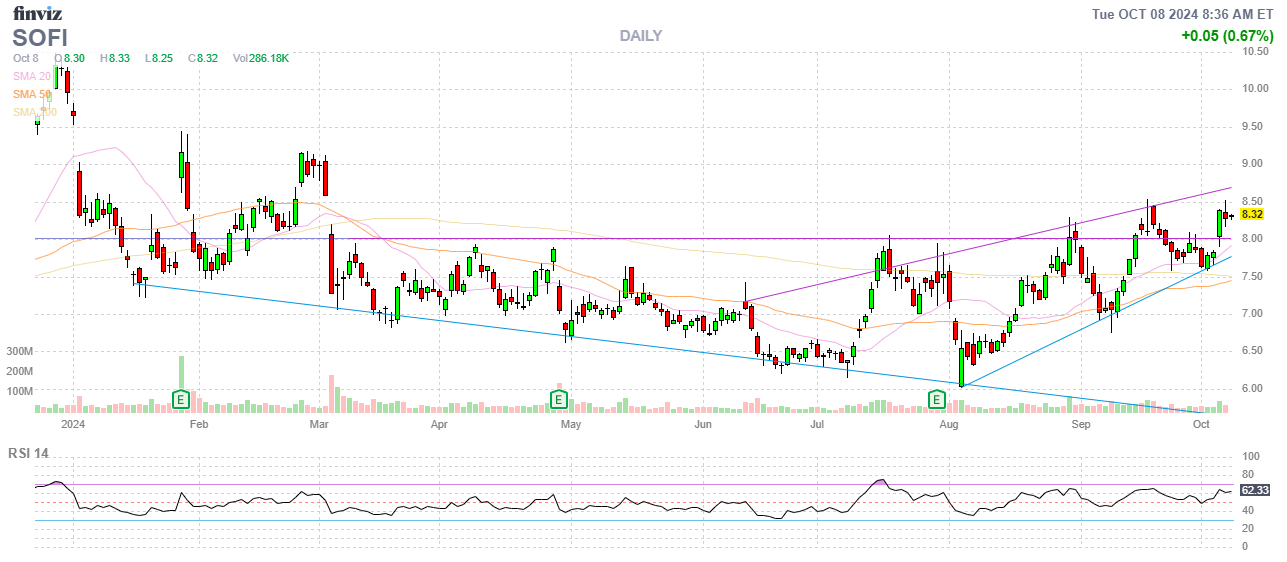
- SOFI – Waiting for a bit more gains to sell short calls. We bought back the first set on the dip. I expect $10 and we can sell 2026 calls for $2.25 (now $1.80), which would be $1,125 then called away at $10 would be $2,500 so $3,625 and currently $2,050 means we have $1,575 (76.8%) upside potential.
-
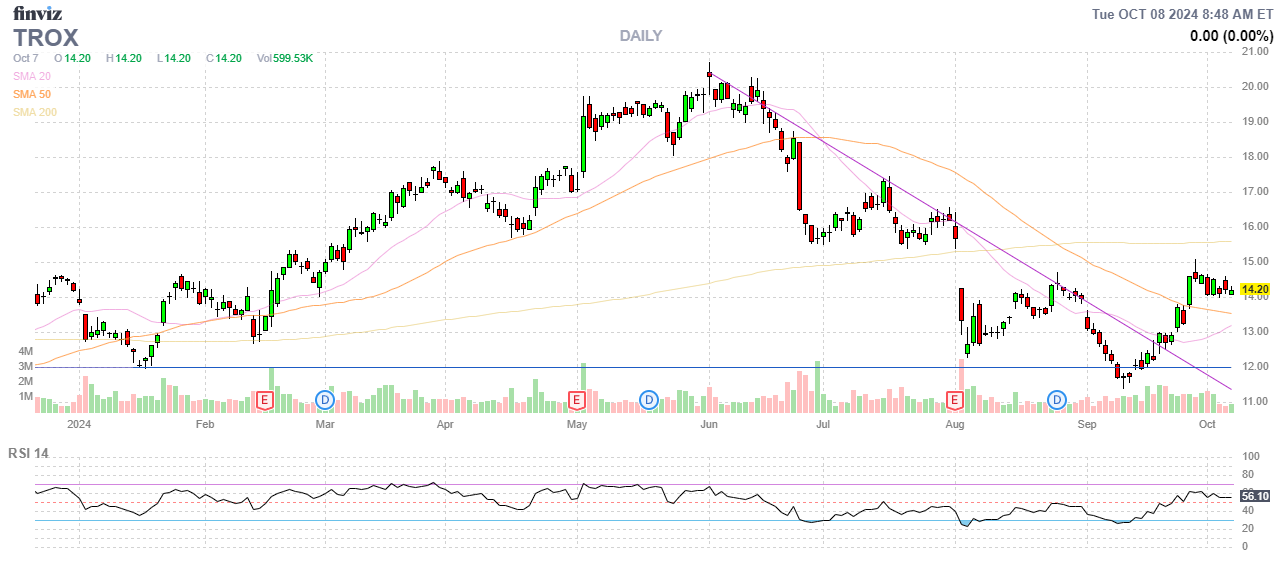
- TROX – May options came out so we may as well sell 5 May $14 calls for $2.25 ($1,125) which is almost all of the Dec $12s value off the table. In Dec, hopefully longer calls will be out and we’ll “leap frog” our calls to a longer month. At the moment, the May $12 calls are $3.30 and it would cost us 0.70 ($350) to make that roll for net ($1,300 (original cost) + $350 (roll cost) – $1,250 (short calls) =) $400 to end up in the May $12/14 spread with ($1,000 – $400) $600 (150% of $400) upside potential. Sounds good to me!
-
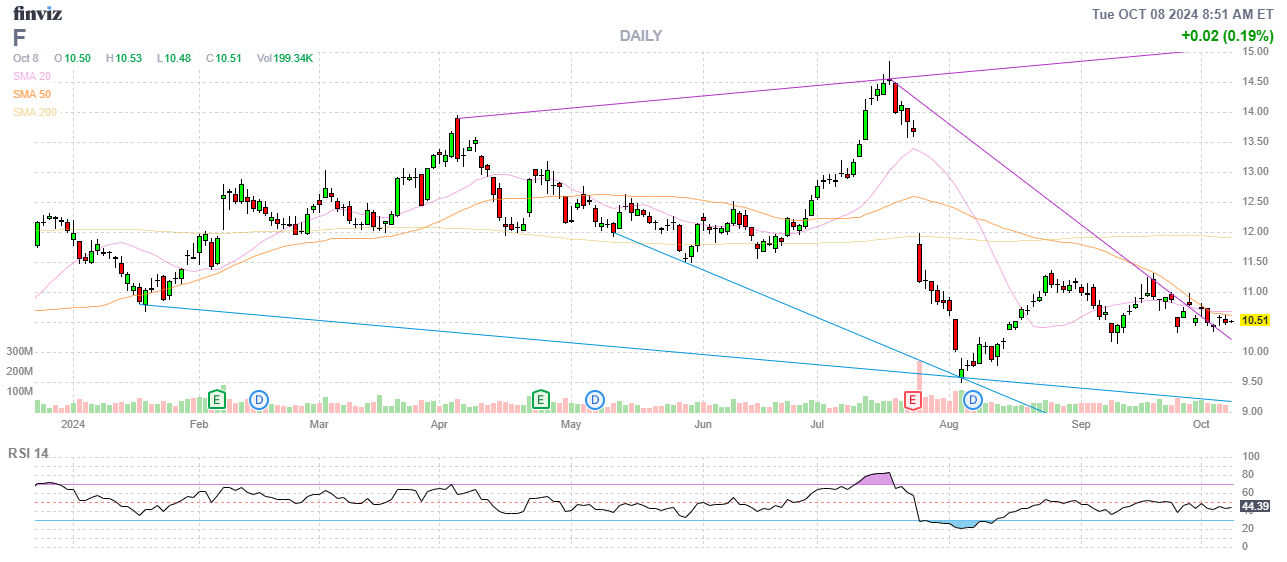
- F – Gosh I have to keep fighting the temptation to sell puts! On track for net $2,674 from the current net $1,183 has $1,491 (126%) of upside potential. Gosh, I don’t think we’ll find something better to do with our money than double down on this one!
-
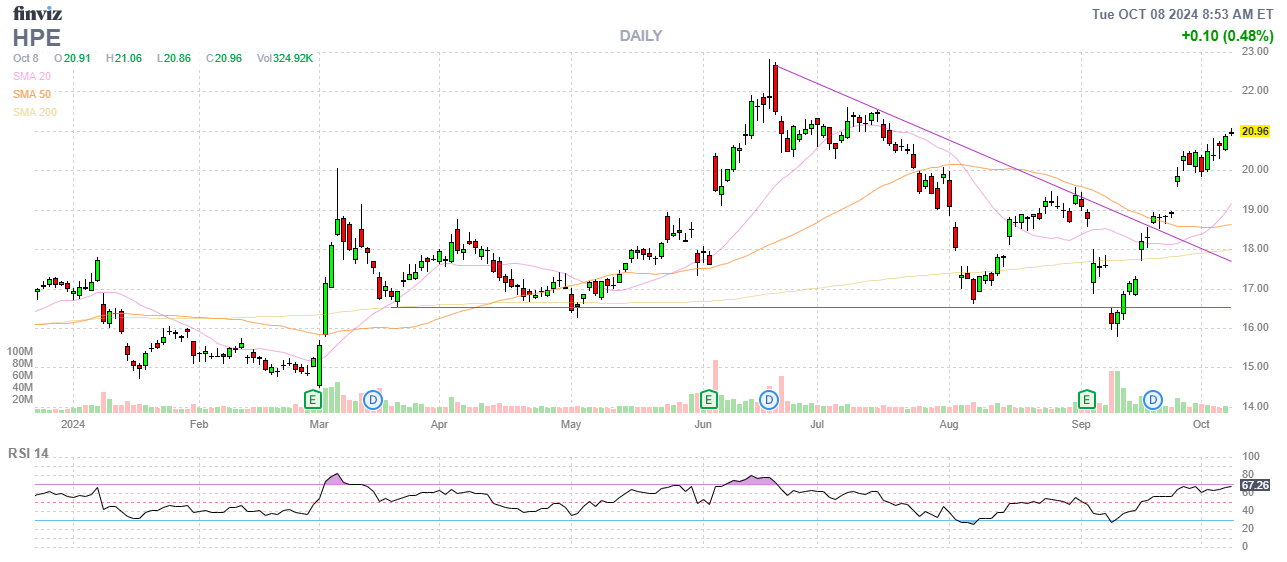
- HPE – Wow, they exploded higher! We’re in the money already at net $2,750 on the $5,000 spread so there’s still $2,250 (81.8%) left to gain!
-
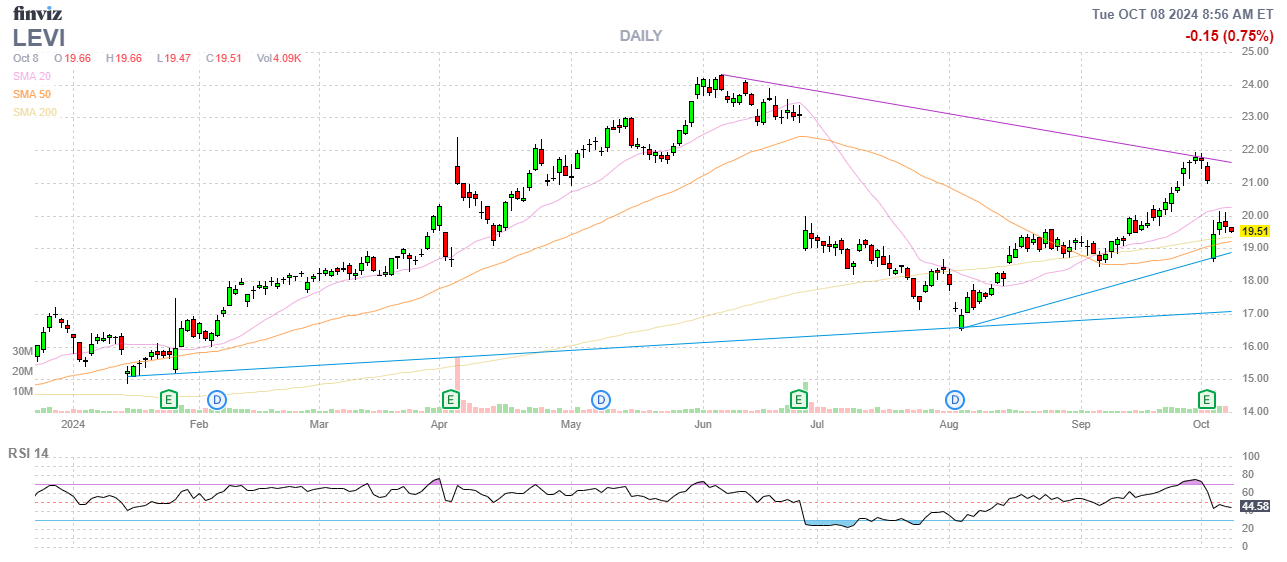
- LEVI – Also in the money at net $2,575 on the $4,000 spread so we have $1,425 (55.3%) left to gain. They cut guidance – otherwise I’d buy back the short calls but let’s play it safe and wait for next earnings.
-
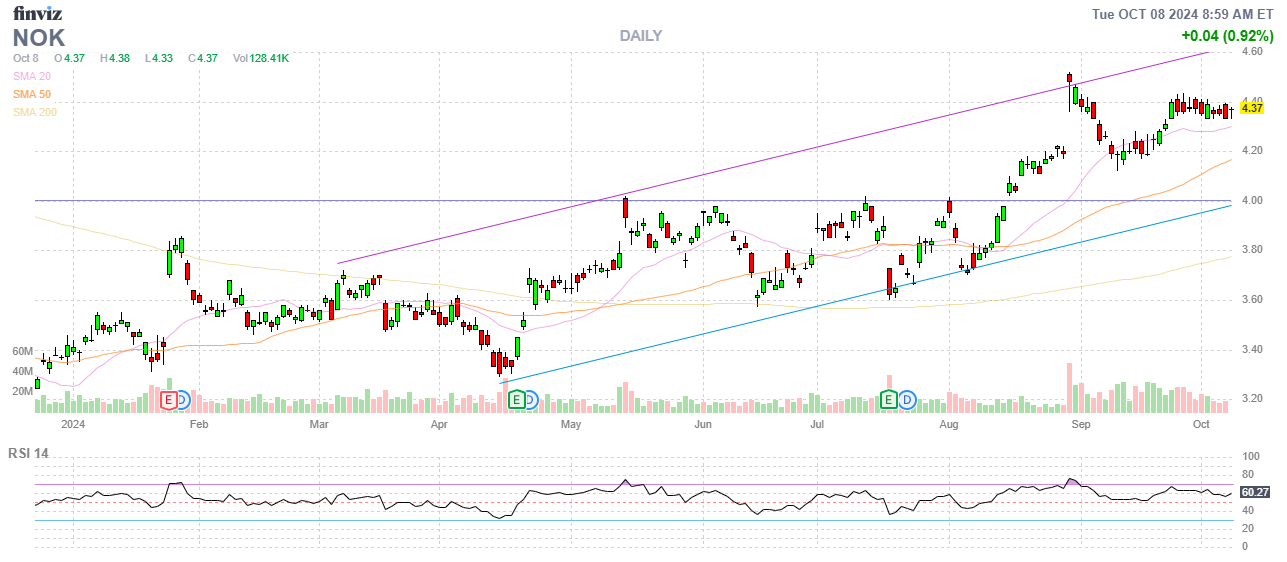
- NOK – Already in the money at net $710 on the $1,000 spread so we have $290 (40.8%) left to gain in 16 months.
-
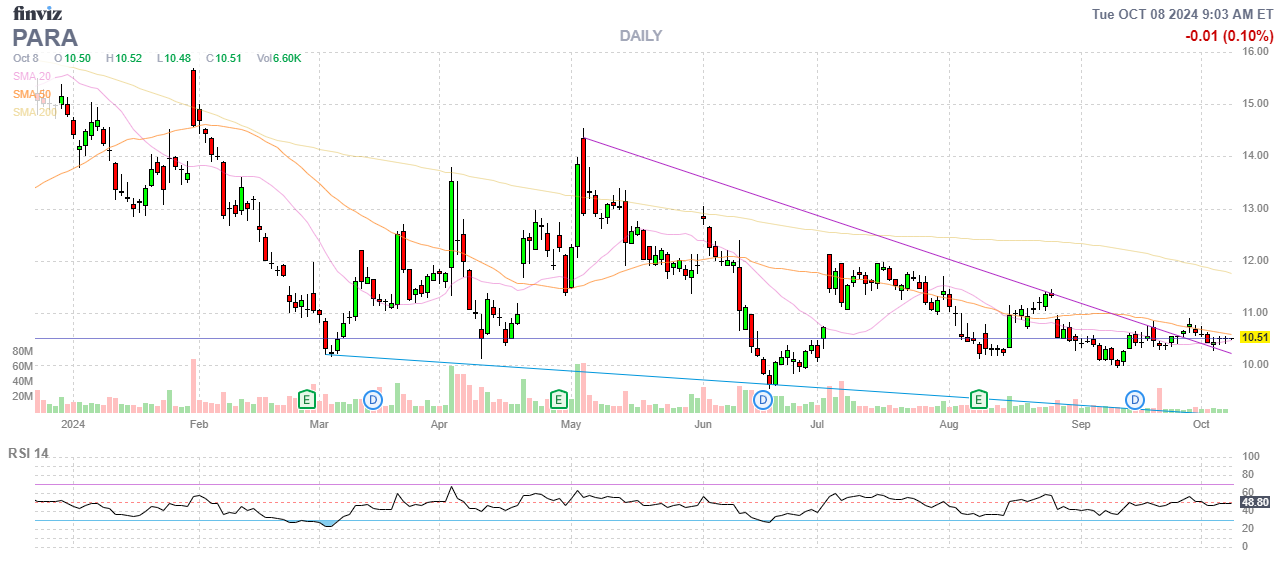
- PARA – I find it impossible to believe we won’t end up over $12.50 on the buyout yet the stock is still at $10.50! Very frustrating (they even beat on earnings!). It’s net $1,470 on the $5,000 spread so there’s $3,530 (240%) left to gain and I’d make this the whole portfolio if it hadn’t defied logic so far. So we’ll wait and see….
-
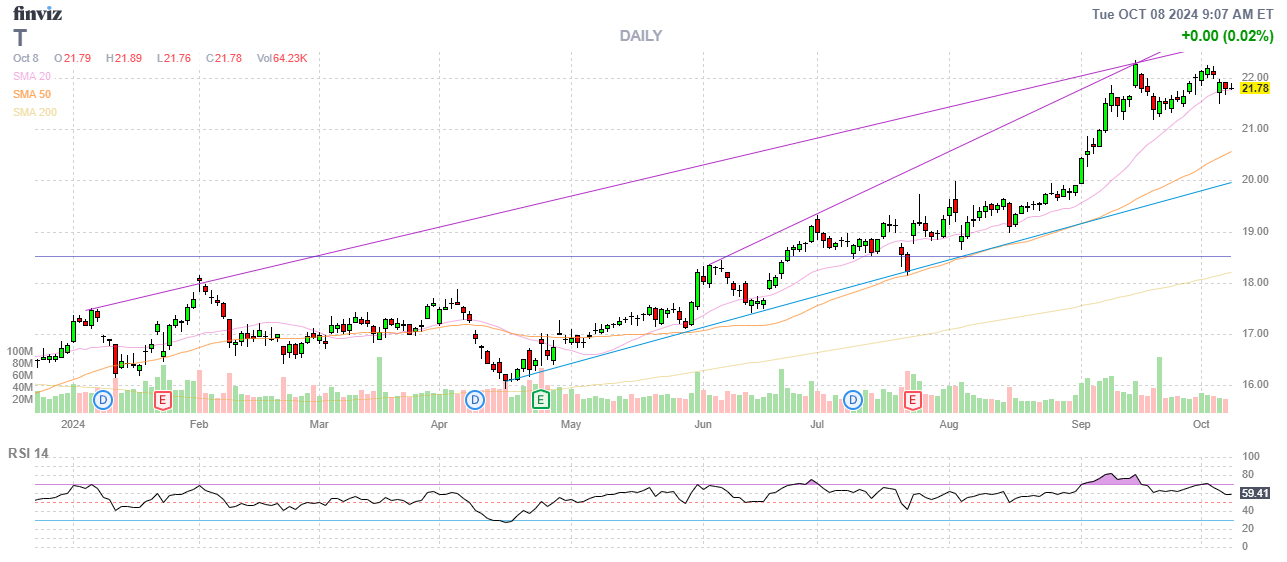
- T – All of a sudden, people agree with me (that it was STUPIDLY undervalued at $17). Now we’re in the money at net $3,925 on the $5,000 spread with $1,075 (27.3%) left to gain.
-
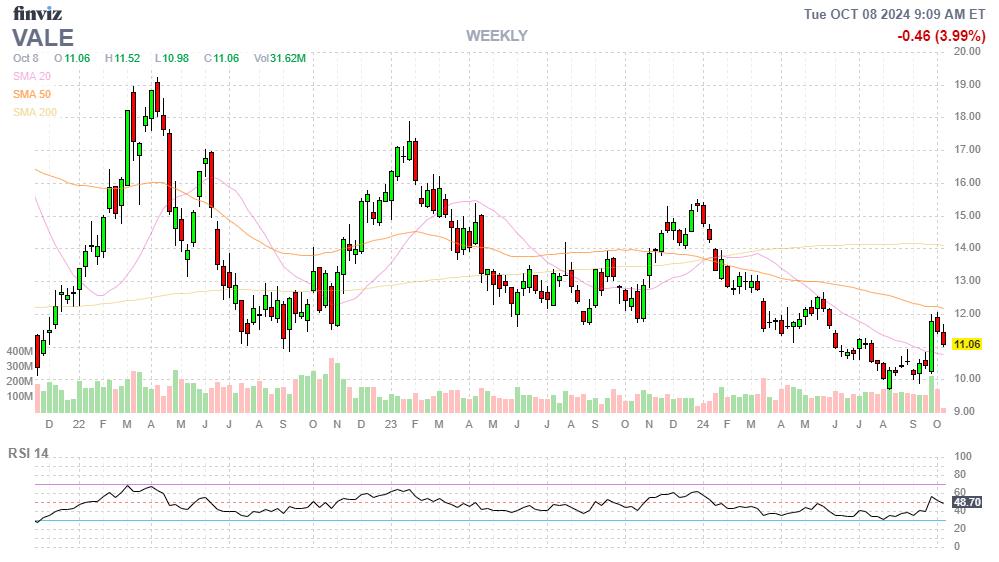
- VALE – Cheaper than where we came in, also after beating on earnings. Another one I’d add more to but here it’s unresolved lawsuits that we’re waiting for – earnings are amazing! Net $1,640 on the $6,000 spread has $4,360 (265%) upside potential at $15, which I think is realistic.
-
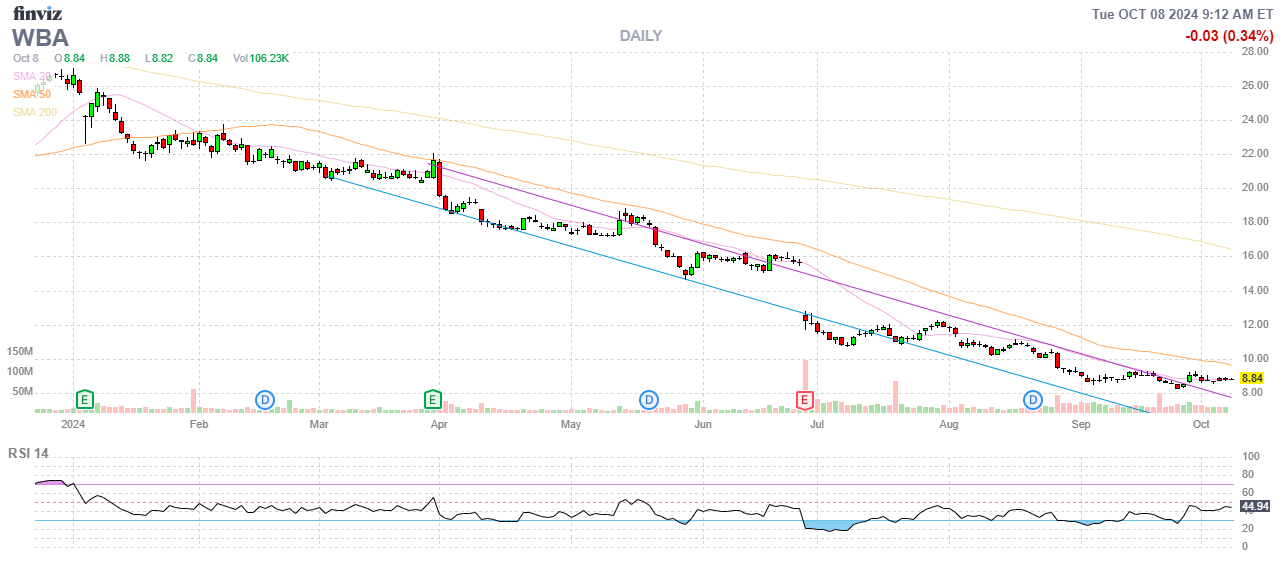
- WBA – Earnings are on the 15th and, if they don’t show us something, we might pull the plug. Not going to count any upside potential until we see how they plan to turn something around with their new COO (named yesterday). STILL – since pulling the plug would involve buying back the short 2026 $20 calls ($250) and since there’s very little they are likely to improve from here with 16 months to go – there’s no major risk in buying those back ahead of the news – so let’s do that.
-
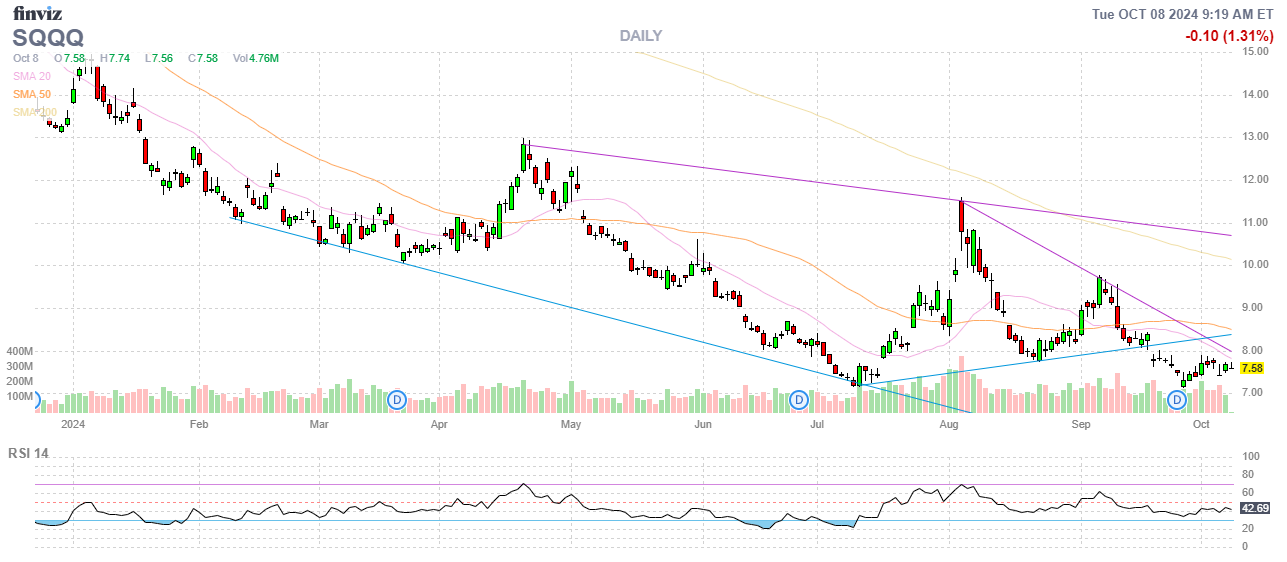
- SQQQ – Our hedge is holding it’s own at net $1,508 on the $2,100 spread so we have $592 (39.2%) of downside protection and they are pretty much at the money – so we only lose money if the Nasdaq gains ground, which would be great for our other positions. Also, our longs are 2026 so we get to roll or sell more short calls for income – so it’s a much better hedge than it looks with that math…
-
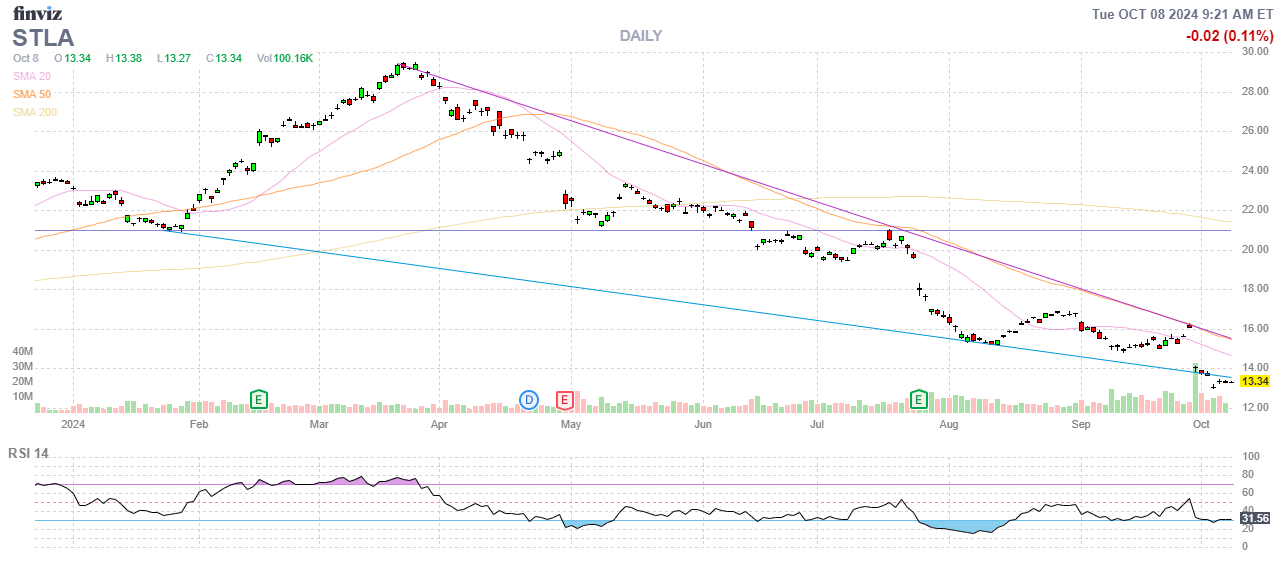
- STLA – Our new addition this month (the date is wrong on the calls, it was the 30th) and it’s net $937 on the $1,500 spread with $563 (60%) upside potential.
-
- BXMT – We added these at the last review and it’s net $1,204 (+$2,000 in margin) on the $1,800 spread so there’s $596 (49.5%) left to gain but, as noted above, we just pulled $235 (19.5%) for our quarterly dividend! So, even against cash and margin of $3,204, we expect 5 more dividends ($1,175) and the call-away profit of $596 is $1,771 or a 55.2% return against cash and margin. Not only that but, since we just collected $235, you could argue that our basis is now $969 and will be less than zero when this cycle completes! So I love this trade!
-
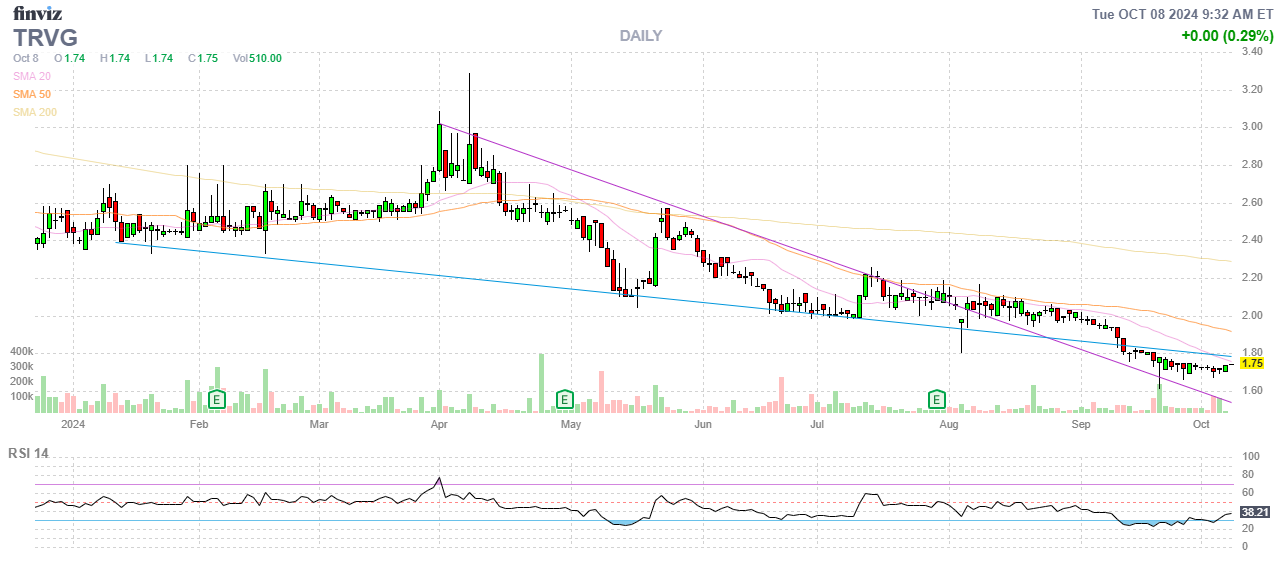
- TRVG – Headed lower and the Oct $2.50 calls will go worthless and last earnings were a beat so I think we’ll wait until next earnings (end of month?) to decide about re-covering. As it stands, it’s net $432 and we’ll have $1,250 at $2.50 for a potential $818 (189%) gain and we probably won’t get there by April – but I think we will eventually.
So we’ve spent $3,590.41 on our adjustments, leaving us with $6,412.59 to spend. Our current positions have $19,318.59 (58.85%) of upside potential, most of it within 16 months so, at the moment – I don’t think we NEED a new trade – let’s see how earnings go and hopefully there will be something we can swoop in and buy.
Slow and steady wins this race. If you are new to trading, each review links back to the previous one and you can follow our path from $700 to $32,823 in 26 months and that will let you see how we’ll just continue to do what we do here as we continue on our very rewarding path to $1,000,000.
It is definitely not to late to join us on this adventure!
— Phil
[ctct form=”12730731″ show_title=”false”]


")