During yesterday’s Webinar, we had Warren analyze the Fed’s upcoming decision (2pm, EST):

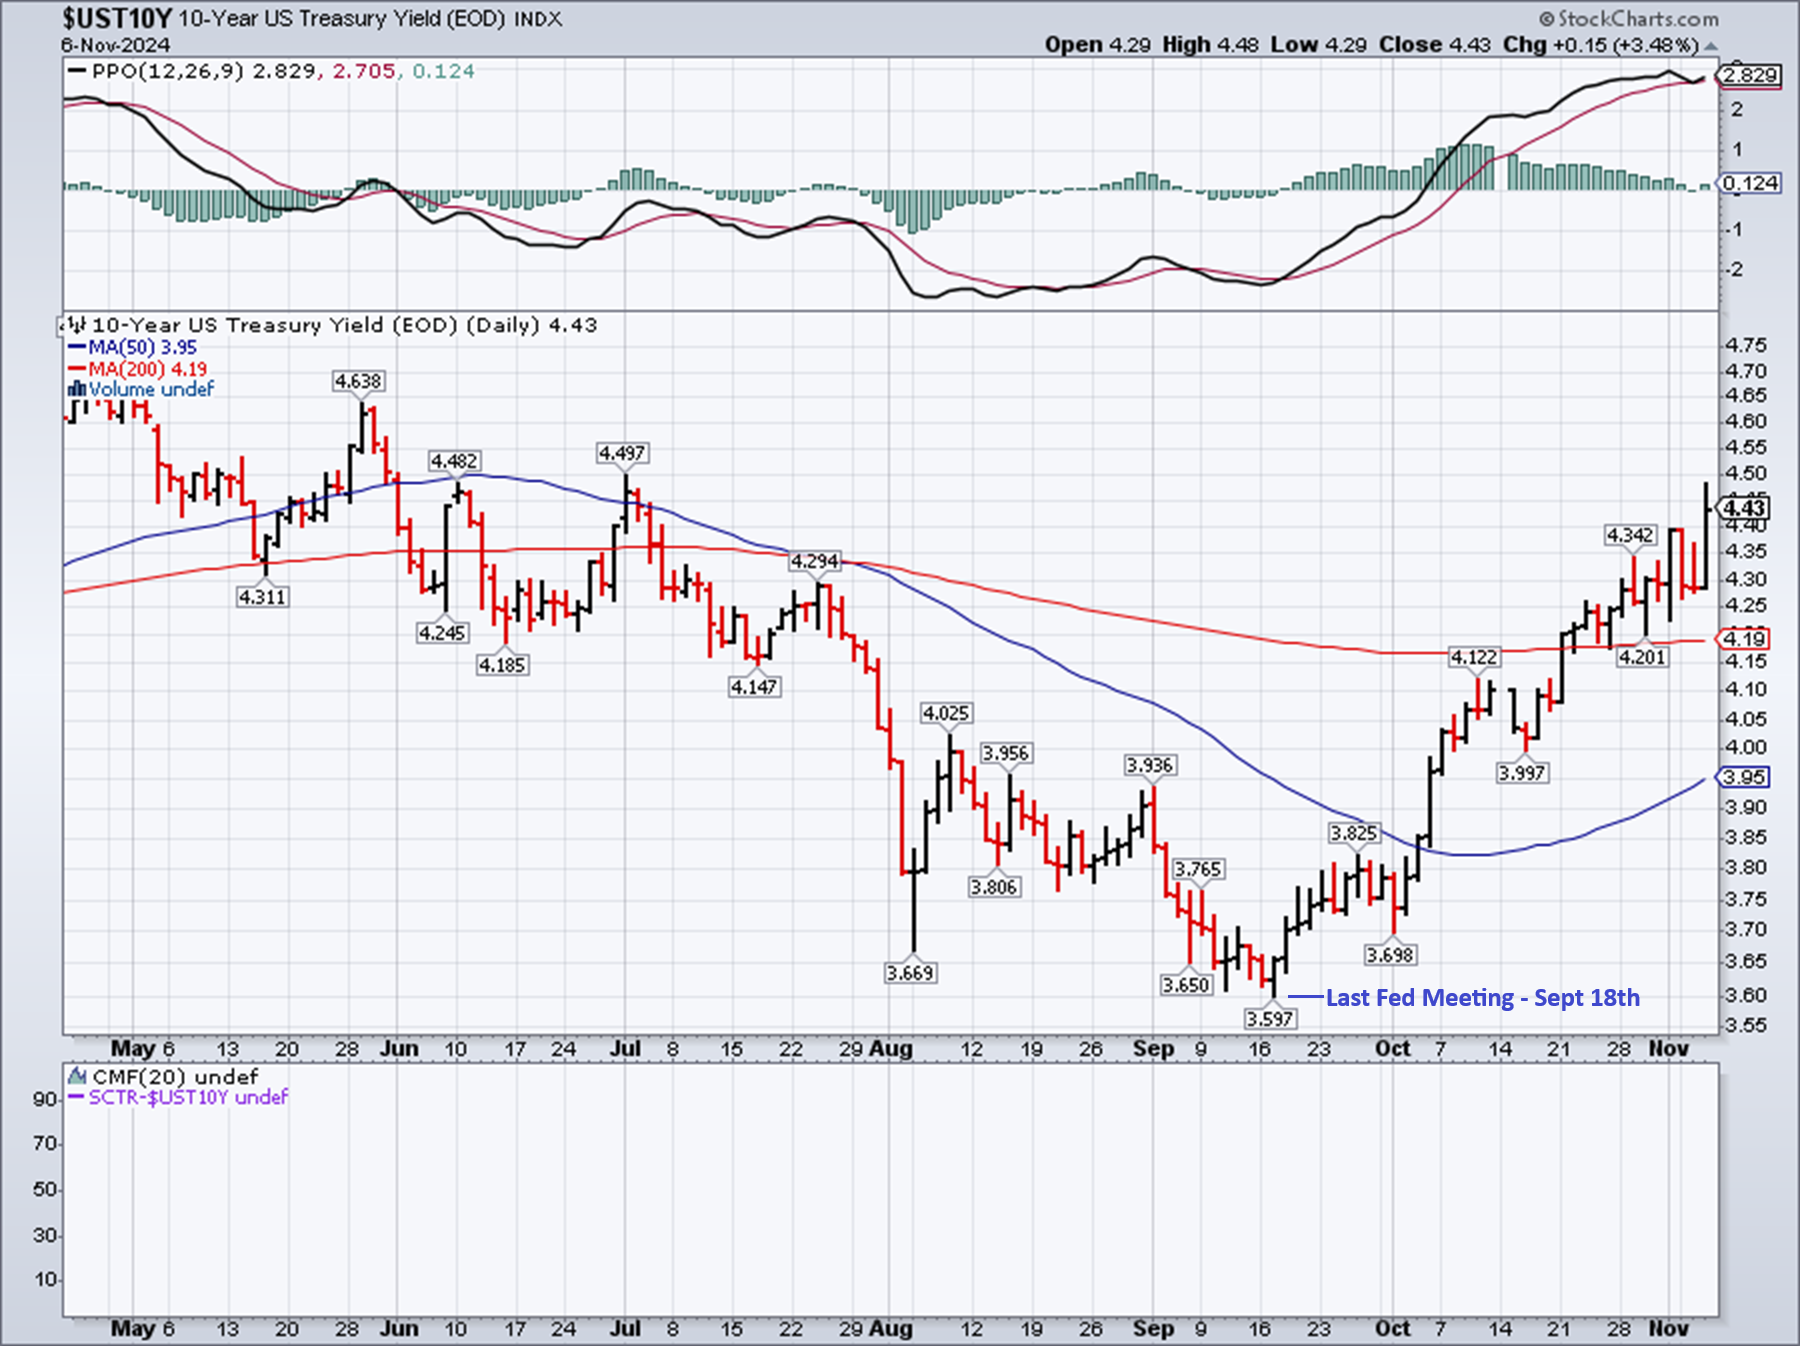
🤖 The spike in the 10-year Treasury yield from 3.6% to 4.4% since the Fed’s September rate cut is indeed a significant development, especially considering the weak demand at recent auctions. Here’s how the Fed is likely to interpret these shifts and what it could mean for their policy stance:
1. Market Sentiment on Long-Term Rates:
- The jump in the 10-year yield reflects several forces: expectations of persistent inflation, concerns over federal deficits and debt levels, and potentially higher term premiums (the extra yield investors demand for holding longer-term debt amid uncertainty).
 Investors may be pricing in a risk premium due to concerns about future fiscal stability, inflationary pressures, and global uncertainties. The weak auction demand suggests that investors want higher compensation for taking on duration risk, meaning they see more persistent inflation or even potential structural budget concerns over the long term.
2. Signals of Tight Financial Conditions:
- Higher long-term rates increase borrowing costs across the economy—from mortgages to corporate loans. This tightens financial conditions independently of Fed policy, essentially adding an implicit level of restraint to the economy.
- The Fed could see this as a reason to temper further rate cuts. Given the 10-year yield is now well above Fed short-term rates, additional rate cuts might provide only limited economic support because long-term borrowing costs would still weigh on investment and spending. This may cause the Fed to focus more on stabilizing expectations rather than aggressively cutting further.
 3. Implications for Inflation and Economic Activity:
- Inflation expectations are likely being scrutinized carefully, as higher 10-year yields can indicate that investors see persistent inflationary risks or that they believe the Fed’s current policy may not fully resolve inflationary pressures.
- The Fed may interpret the higher yields as a reason to keep an eye on long-term inflation expectations and may refrain from additional aggressive cuts to avoid stoking further upward pressure on yields.
 4. Potential Actions and Communication:
- The Fed could address this by slowing the pace of rate cuts, perhaps opting for a 25-basis-point reduction instead of a larger cut at the November meeting. This move would signal that the Fed is cautious about adding too much liquidity that could keep long-term yields elevated.
- In its communication, the Fed may stress its commitment to a gradual and conditional easing stance, emphasizing that further cuts depend on clear signals of sustainable inflation decline and labor market stability.
- Additionally, the Fed might highlight that it’s monitoring fiscal conditions and auction performance as a factor in its long-term policy outlook, acknowledging that the interplay of government debt dynamics could influence its options for monetary easing.
Bottom Line for the November Meeting
Given the rise in 10-year yields and weak auction demand, the Fed may adopt a measured approach at the upcoming meeting, opting for a smaller rate cut or even signaling a potential pause if inflation expectations remain elevated. They’ll likely underscore a data-dependent path, emphasizing that they are prepared to adjust based on evolving financial conditions, including the demand for Treasuries and overall long-term rate stability.
This approach could stabilize market sentiment and reinforce the Fed’s dual commitment to controlling inflation and supporting the economy without overextending its easing measures.
So that’s the outlook for this afternoon’s Fed Meeting. The problem the Fed is having is that the bond buyers aren’t buying the Fed’s plot-projected 3.5% rate (2025) and lowering the current Fed Funds Rate to 4.58% when the bond buyers are offering a long-term 4.4% is only going to make the Fed look MORE ineffective and THAT is a risk the Fed may not be willing to take…

Investing is about making choices – where are you likely to get the best returns, what asset classes are safe and which ones are risky. We have to be keenly aware in the risks around political transitions – like the one we are now going through in the US – the anticipation of policy changes 2 months before Donald Trump is sworn in as President (again) will have a powerful effect on all asset classes.
The Bank of England cut their rates by 0.25% this morning but they cut it to 4.75% – which will be higher than the Fed is offering if they lower their rates this afternoon. Clearly the BOE expects the Fed to cut rates or it is they who will look ineffective as it will be very hard to sell British Bonds at 4.75% when US Bonds are 4.83%.
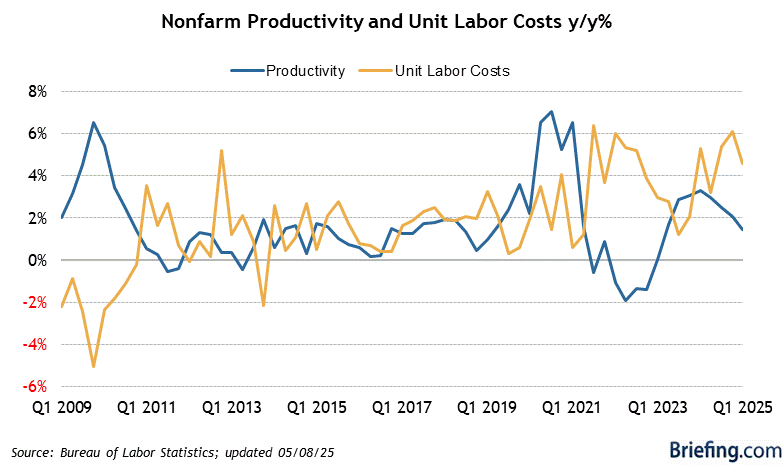
Speaking of having no control of the Economy: Productivity just came in at 2.2%, which is down from 2.5% in Q2 but that’s OK because Q2 has been REVISED to 2.1% so 2.2% is now UP 0.1% from last quarter – isn’t that clever? Yes, it is all complete and utter BS – get over it!
Much more importantly, our Leading Economorons expected Unit Labor Costs to come in at 0.5%, up slightly from 0.4% in Q2 but SURPRISE! Unit Labor Costs are up 1.9% but that is DOWN from Q2s REVISED 2.4%. Yes, that’s right, Q2’s Labor Costs were actually 2.4% and NOT the 0.4% we were originally told and that is, in layman’s terms A HUGE F’ING DIFFERENCE (500%) IN A CRITICAL PIECE OF DATA!!!

Unit Labor Costs (500% more than we thought) are a key leading indicator of inflation. Remember when we said the 0.4% number made no sense? Well, we were right! As I noted at the time, you don’t get massive labor strikes when labor conditions are tight and you don’t see massive wage settlements from huge companies like Boeing affecting hundreds of thousands of workers and magically have 0.4% ULC increases. Now we know…
I’m a huge skeptic and even I couldn’t imagine the data was THAT far off! This means other inflation readings will have to be revised up as well and Bond buyers (remember them from before) are NOT going to be willing to lend us money at low rates when we’ve CLEARLY been misrepresenting our Inflation Data. Shame, shame, shame…
Cooling Labor Costs were the Fed’s ENTIRE premise for lowering rates at the last meeting. Overall Unit Labor Costs are up 3.4% from last year and THAT is only because we’ve had great productivity improvements (thanks AI!) but is that sustainable? The wages will keep going up but will the productivity keep pace or will Corporate Margins be squeezed?
 And there are red flags for Manufacturing already in these numbers as Output DECREASED by 0.2% in Q3 so we have falling Output and rising Labor Costs and we’re paying 30 TIMES earnings for these companies? REALLY??? Even more so than pointing out how ridiculously overpriced the US markets are – let’s keep in mind how UNRELIABLE US Economic Data is. This is truly shameful!
The takeaway is that the labor market remains much hotter than previously reported, with wage pressures significantly higher than understood just a quarter ago. This dramatically changes the inflation picture and likely pushes any potential Fed pivot further into the future.
1976!
[ctct form=”12730731″ show_title=”false”]


 Investors may be pricing in a risk premium due to concerns about future fiscal stability, inflationary pressures, and global uncertainties. The weak auction demand suggests that investors want higher compensation for taking on duration risk, meaning they see more persistent inflation or even potential structural budget concerns over the long term.
 3. Implications for Inflation and Economic Activity:
 4. Potential Actions and Communication:


