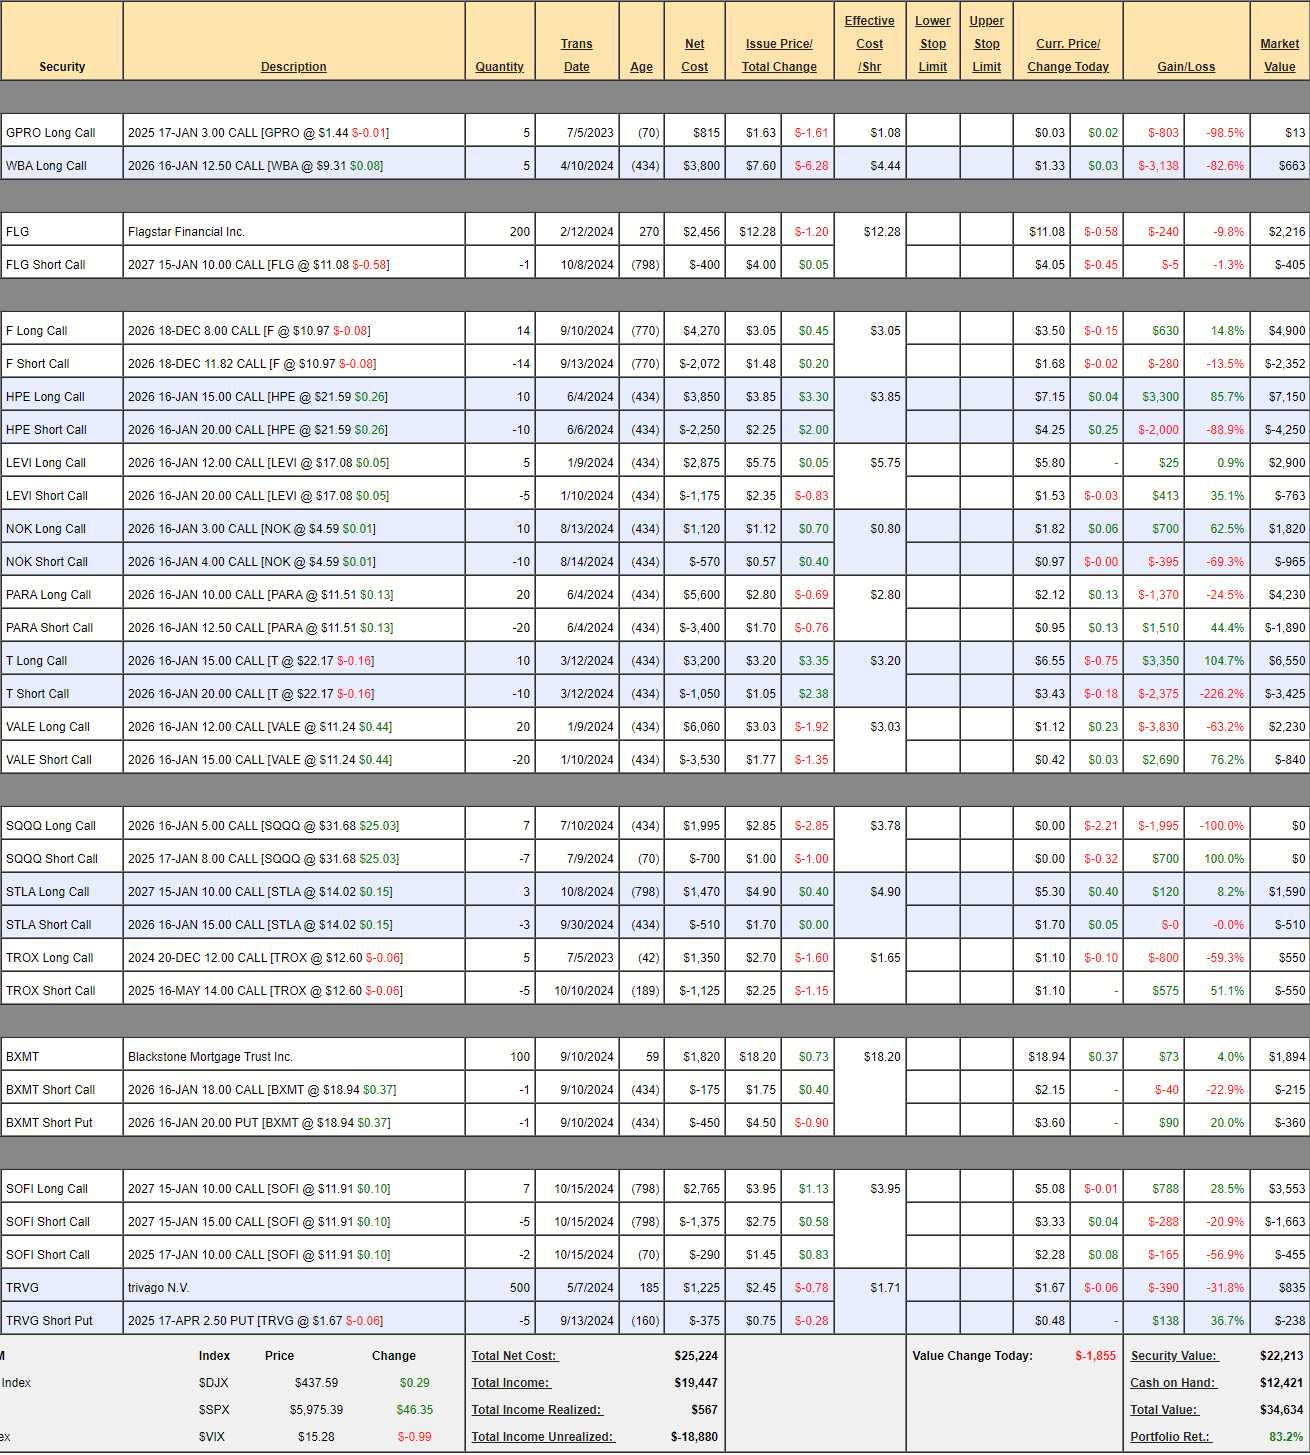
 $34,634!
That’s up $1,811 (5.5%) since our October 8th Review(and includes our last $700 deposit) and we have now deposited $18,900 over 27 months and, overall, we are up 83.2% – MILES over our goal of making 20% per year in what is still a very conservative portfolio, overall.
Our $700 Portfolio follows a very simple concept of investing $700 every month (10% of the average family’s income) and then finding the optimal mix of positions to give us good long-term return that will grow our nest egg. Certainly, in recent months, we’ve been giving a hand by the S&P 500 but now it’s a bit toppy and we’re going to want to lock in these gains:
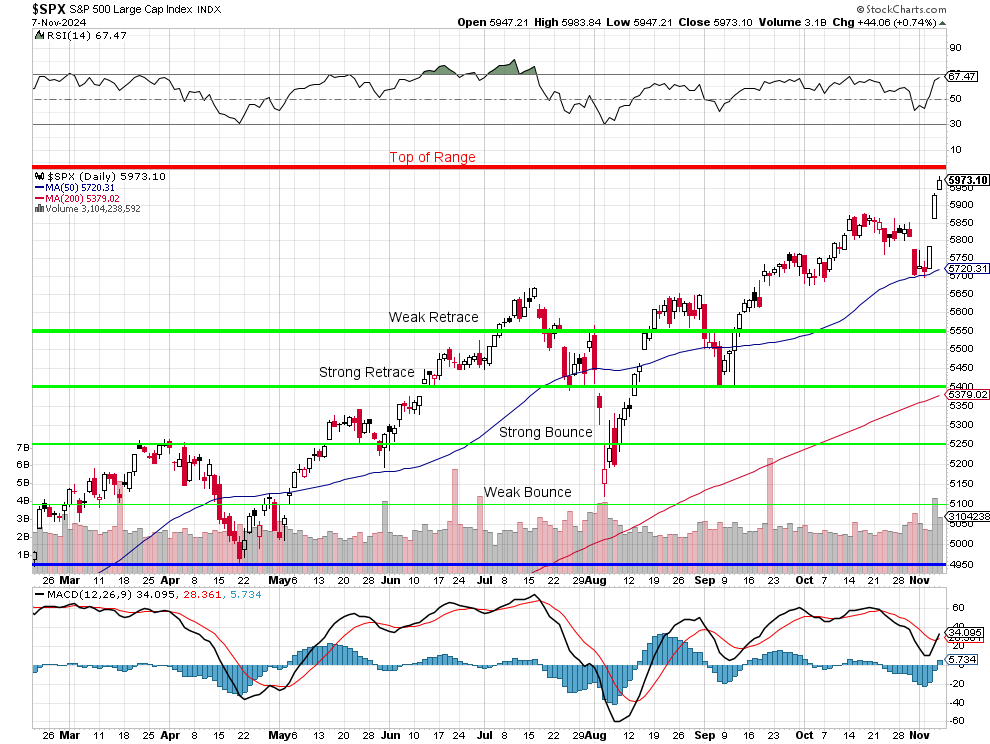
Notice that we are only at the “Top of Range” our 5% Rule predicted for 2024 – so we’re simply at our goal and now we need to consider what our target is for 2025. We have not seen, so far, a rise in earnings that would dictate raising our targets – especially when we consider that, without the Magnificent 7, 2024 earnings for the S&P 493 have been essentially flat.

In fact, earnings for the S&P 493 are tracking for -1% in Q3 (80% reported) and, while the Mag 7 are still putting up a very strong 19% growth, that has dropped off dramatically from the growth that has driven the market in the past 4 quarters.
This is a small portfolio, we can’t afford the Mag 7 and, even if we could – they are too volatile for us so we are limited to investing in the S&P 493 and the Russell 2000 after that. As you can see, EXPECTATIONS for Q4 are for a tremendous jump in our smaller stocks but I’m not hearing it in the earnings report or seeing it in the Q4 numbers – and we’re halfway through Q4 already.
So, with S&P 5,973, Dow 43,729, Nasdaq 21,101, NYSE 19,875 and Russell 5,973 I’m inclined to play it cautiously over the next month – especially with the RSI of the S&P 500 once again testing 70 – between that and our 6,000 line – I smell a rejection coming and, since we have run up from support at 5,400 – the weak retrace line is 5,880 and the strong retrace line is now 5,760 and that will be the 50 dma by the time we get there.
When will that be? Well that’s EASY to answer as the index is 53 points over the 50-day moving average so it’s pulling the 50 dma up by a point per day so 40 days from now, the 50 dma will cross over the strong retrace line at 5,760 (if the S&P stays strong) and that will be about Dec 31st (it’s market days).
 Between now and then, the S&P 500 is likely to drift between 6,000 and 5,720 (the 50 dma) and it’s not very likely to pop over 6,000 and, since it’s there now – there’s no sense in playing bullish into the holidays. If the S&P does pop over 6,000 – then we’re wrong and we adjust our strategy to be more bullish but you play it with caution when you are up 83.2%.
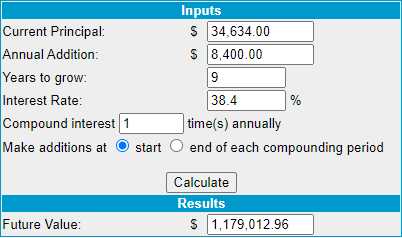
As you can see from the compound rate calculator, all we have to do is keep up this pace for 9 years and we hit our $1M goal – 19 years sooner than expected! This also means, by the way, that you can start following this portfolio now, with $34,634 and a commitment to add $700 a month for 9 years – and you’ll be right on track with us on our path to $1,000,000!
Last month, it was going to take us 10 years – that’s what a very tiny improvement in our performance yields us – a very good reason to buy more dividend stocks, I think. Let’s first go over our existing positions and make sure we feel safe. We raised a lot of CASH!!! last month and hopefully we can put some back to work:
-
- GPRO – We were hoping for a pop to 0.20 but now we should be lucky to get 0.05 off the table to close it.
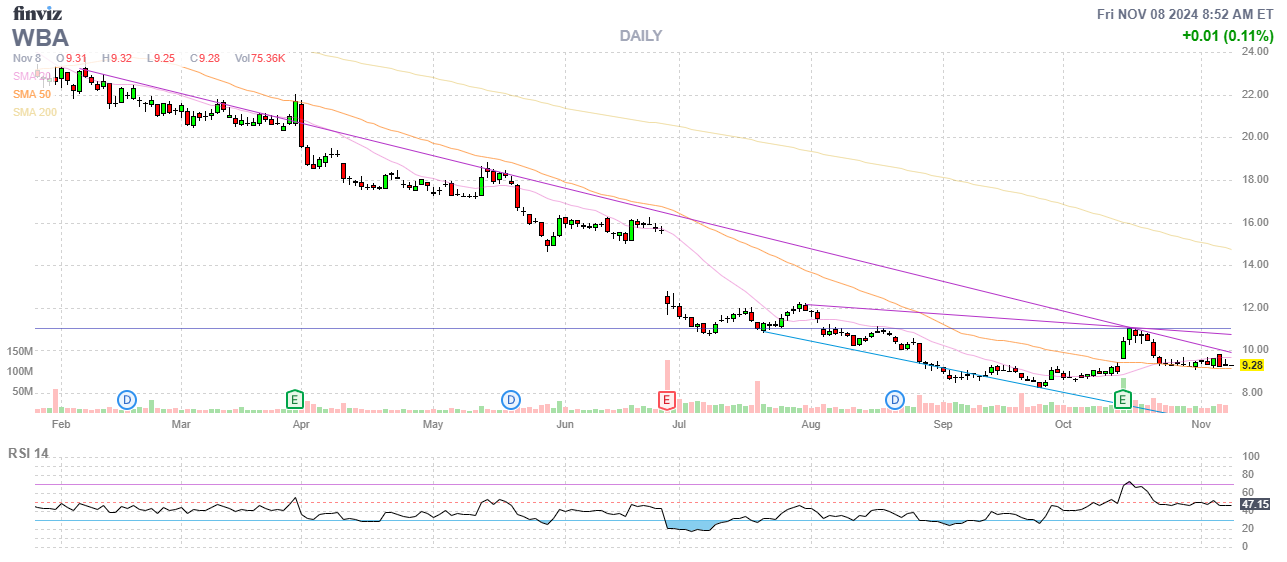
- WBA – Our worst position, though there have been offsetting short calls but we’re still about $2,000 underwater. Is there any point in continuing? Well we could take the $2,000 loss or we could roll the 10 2026 $12.50 calls ($663) to 10 2027 $7.50 calls at $3.75 ($3,750) and sell 10 2027 $12.50 calls for $2.10 ($2,100) and that will use net $987 of our cash to wind up in a $5,000 spread that’s $1,800 in the money with $3,350 (200%) upside potential on our $1,650 total investment. Yes, that seems better than just cashing in $663 and taking the loss, right? Great for a new trade, of course!
-
- FLG – Was NYCB and I guess they decided their name was mud, which is sad because they are a good bank. They won’t be making any money next year but I’m comfortable with our $10 target as we’re 10% over it at the moment. I think by next year, the turnaround story will be evident and we’ll sell a $12 call for $5 ($500) and then our net would be $1,556 and we’d cash out at $1,000 and $1,200 for a $644 potential gain (41%).
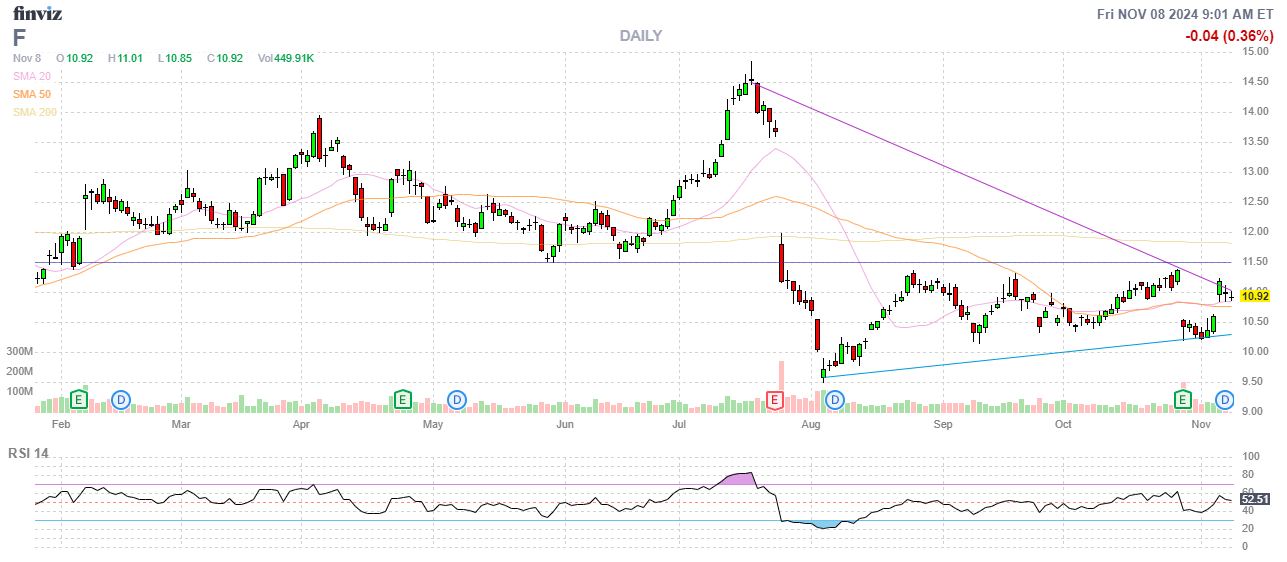
- F – We’re at $10.97 and our target is $11.82 ($5,348) and currently we’re at net $2,548 so this trade has $2,800 (109%) upside potential – also great for a new trade!
-
- Ford just paid out a 0.15 dividend and 0.60 per year is not bad against $10.92 (5.5%) but what if you bought 1,000 shares for $10,920 and sold 10 2027 10 calls for $2.45 ($2,450) and sold 10 2027 $10 puts for $1.60 ($1,600) (NOT an official play!). Then your net for 1,000 shares would be just $6,870 and that dividend would be 8.7% while you wait to be called away at $10,000 with a potential $3,130 (45.5%) profit. If F fails to hold $10, you would have to buy 1,000 more shares for $10,000 and now you’d have 2,000 shares for ($6,870 + $10,000 – $1,200 in dividends) = $15,670 or $7.83/share and that is 28% below the current price. That is your WORST case!
- HPE – Already in the money at net $2,900 on the $5,000 spread so we have $2,100 (72.4%) upside potential in just over a year – GREAT for a new trade!
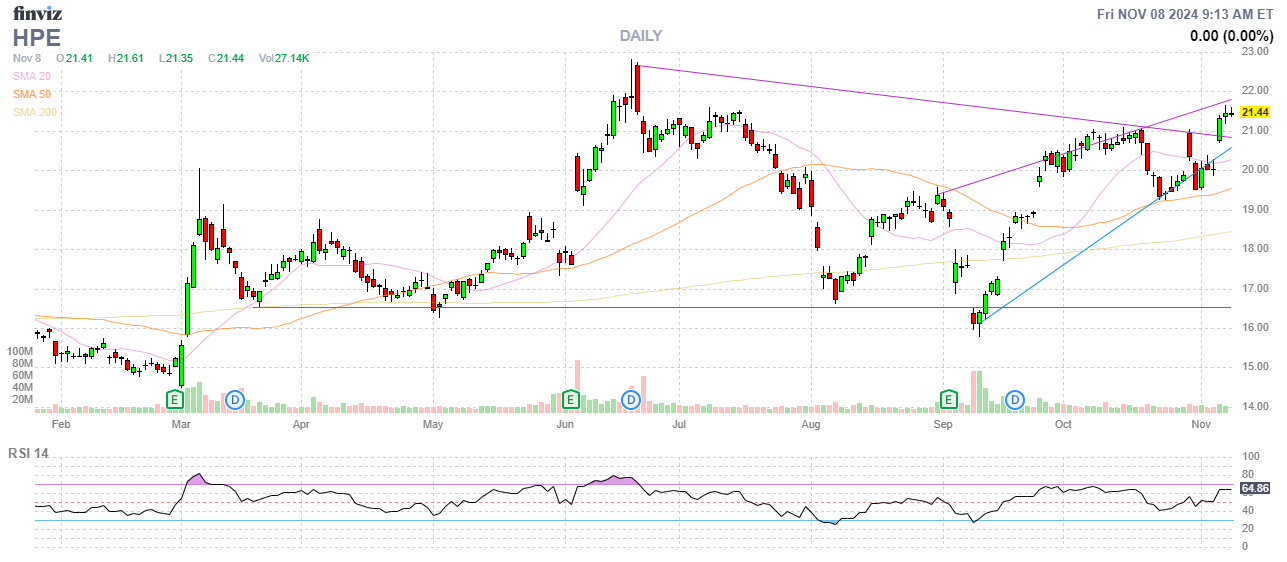
Boy, these trades are too good to take off the table or cover so far!
-
- LEVI – This one is on track but miles down from $22 pre-earnings (Oct 2nd) but we’re giving them a mulligan on Q3 and looking ahead to a good 2025. That being the case, let’s buy back the short $20 calls ($763) and lock in our 35% gain. We’ll sell more to cover on the next bounce. That puts us in for net $2,463 on the $2,900 long calls and our target of $20 remains valid so the upside potential is $1,100 (37.9%) in a year and we expect to improve that by selling a new $20 call for $1,000, which will drop our net to $1,900 and increase our upside to $2,100 (110%) and we’ll have that $1,000 to make a new trade with. Good plan?
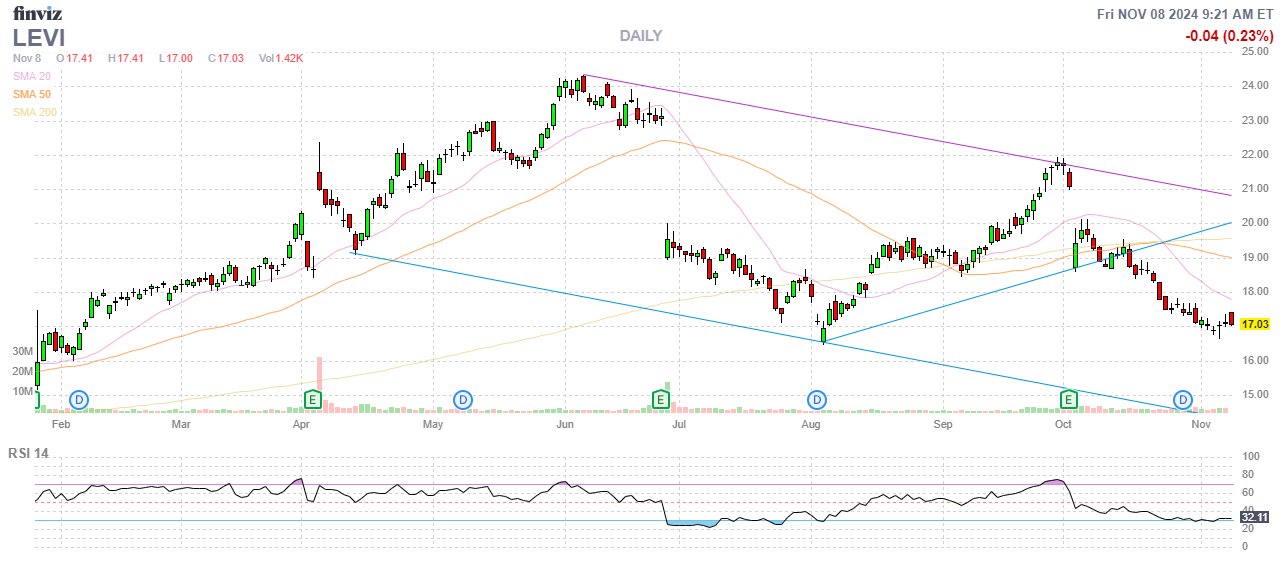
We initiated this trade last January, when LEVI dipped to $15 so now we have a chance to relive the run to $24 without a cover – very exciting! As value investors, we KNOW we’re willing to buy at this level – so it’s not a hard decision for us.
-
- NOK – Way over target already at net $855 on the $1,000 spread so only $145 (16.9%) left to gain but it’s such a high likelihood that there’s no reason to cash it in at the moment – since we’re not short on cash…
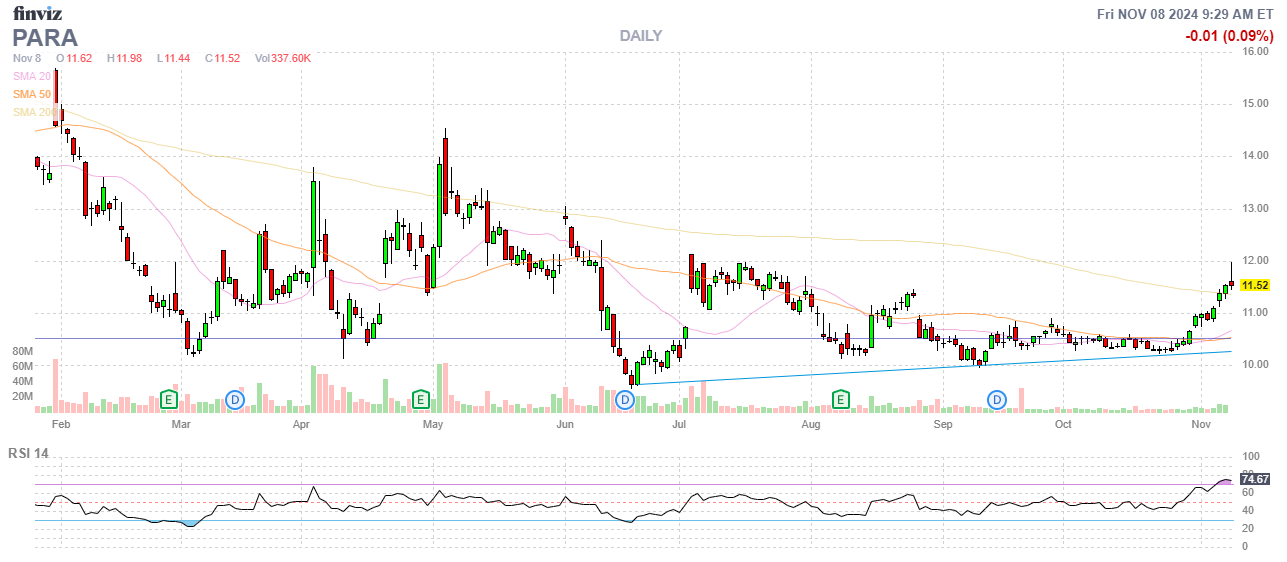
- PARA – Up more than 10% in the last month and right on track for our full $5,000 at net $2,340 so $2,660 (113%) left to gain and I’d double down on this one if Shari wasn’t such a lunatic. Great for a new trade!
-
- T – Who doesn’t have a phone? It’s probably the last thing you’d cut off if you were going Bankrupt, right? So I always like to buy T when they are low and they are still low at net $3,125 on the $5,000 spread that’s deep in the money with $1,875 (60%) left to gain in the next year. Great for a new trade, of course.
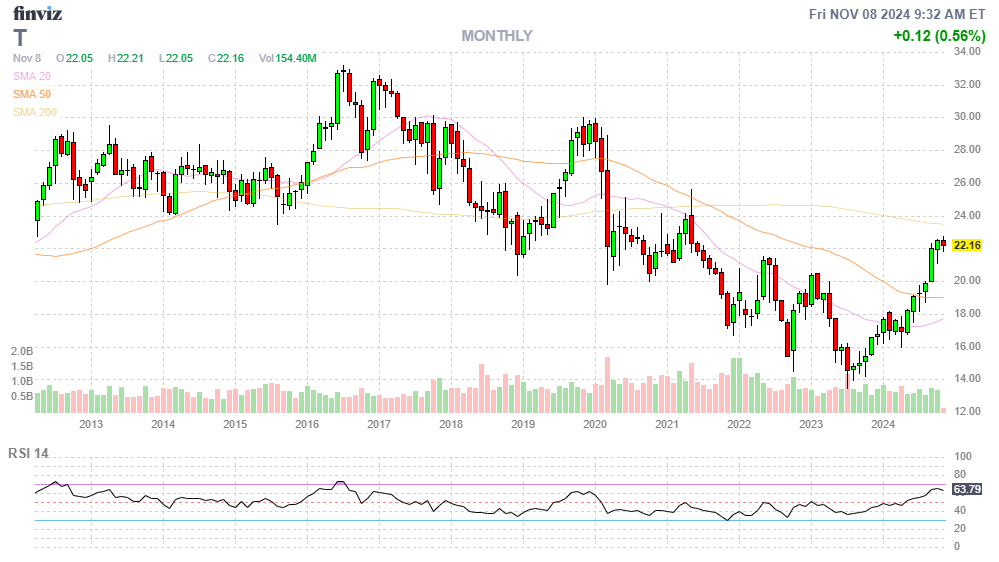
10x earnings!!!
-
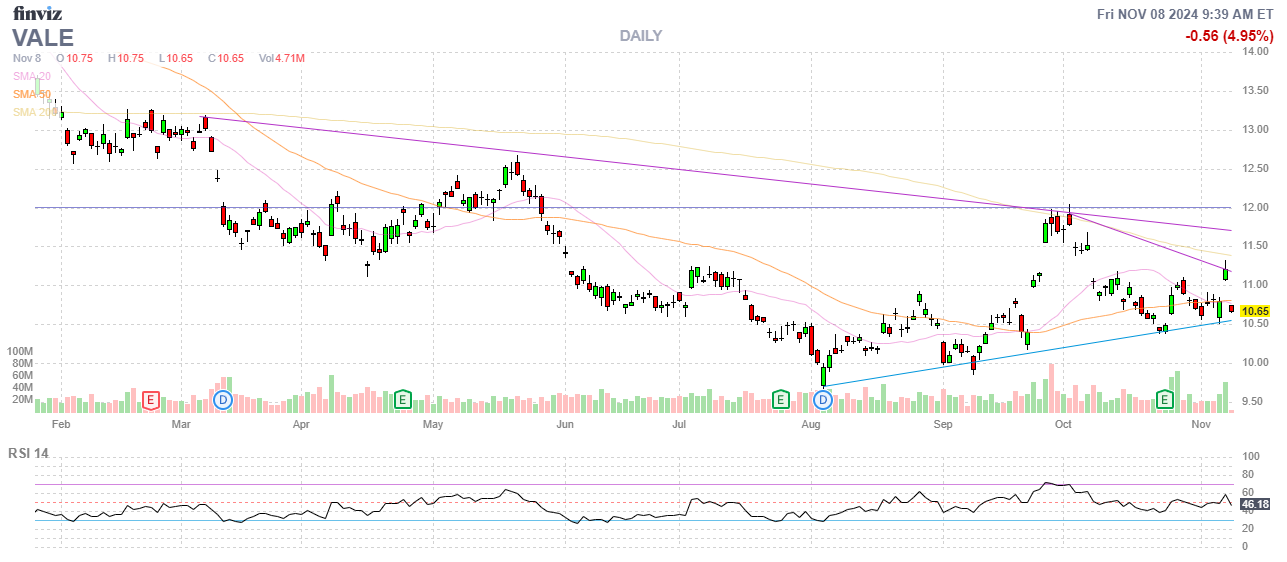
- VALE – Our slow-moving Trade of the Year. We’re still at a net loss at net $1,390 on the $6,000 spread that’s OUT of the money still. They are trading at 5x CURRENT earnings and next year should be about the same and now they have settled their lawsuit I’m looking for VALE to finally climb back to 10x ($21) over the next 12 months and our target is a modest $15 so let’s take advantage of today’s pullback and buy back the $15 calls ($350) and buy 10 of the 2027 $8 ($3.20)/12 ($1.20) bull call spreads for net $2 ($2,000) and let’s say we re-cover the 20 2026 $15s for $1 ($2,000) and then we’ll essentially have the new $4,000 spread for free! Net $350 spent would bring the total outlay to $2,880 on $10,000 worth of spreads with an upside potential of $7,120 (247%) at $15.
-
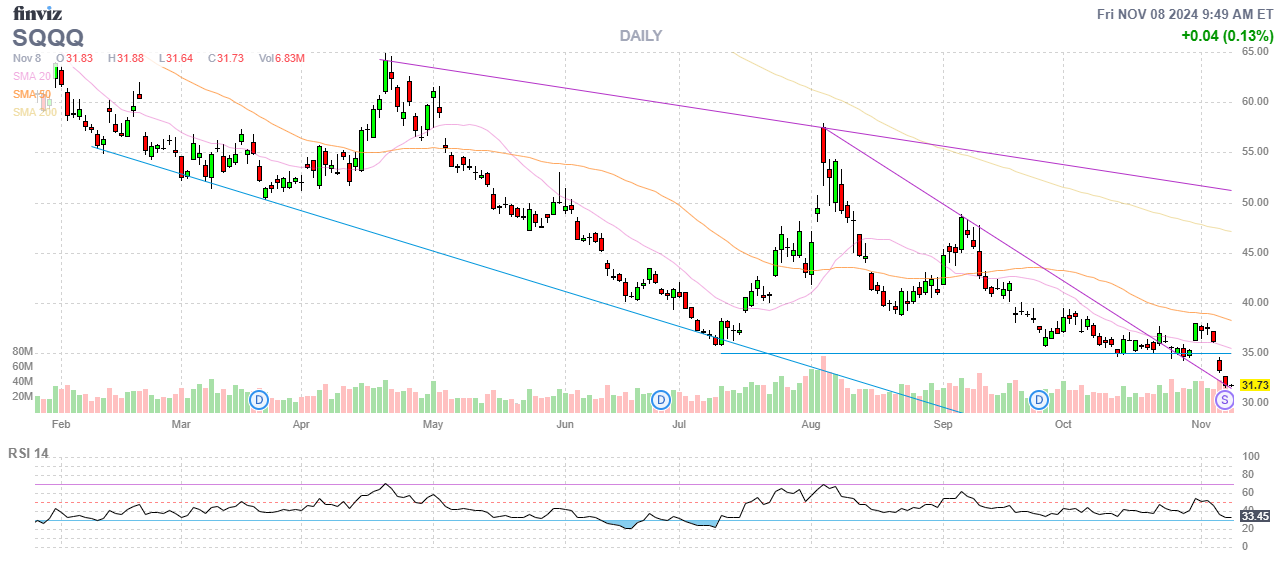
- SQQQ – Wow, the portfolio is doing better than we thought! I forgot that SQQQ had a reverse split (1:5) and these are temporarily showing $0. We now have just 1 $25/40 bull call spread and SQQQ is at $31.80 and we’ll have the cash difference back but let’s put it to work to have 2 of these spreads for up to $3,000 at $40.
-
- STLA – That’s why I didn’t add more F – we already have other auto shares. Here we’re on track for $1,500 at net $1,080 so $420 (38.8%) left to gain on this one.
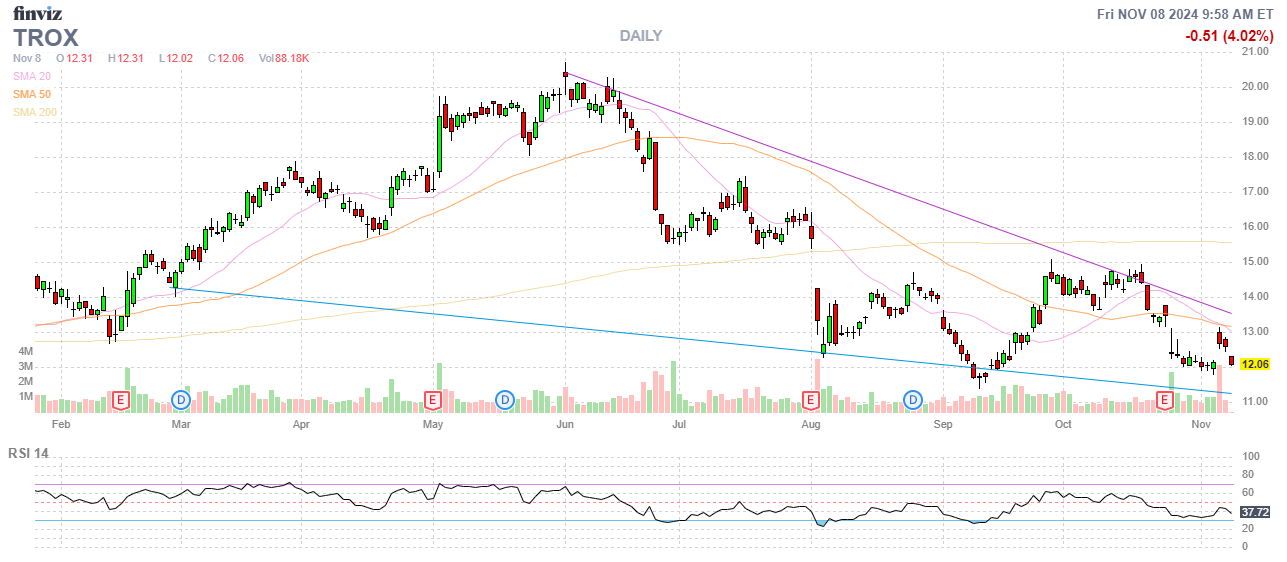
- TROX – Fortunately we sold the May calls. We’re hoping for a bounce but let’s buy 10 TROX May $8 ($4.40)/12 ($1.70) bull call spreads for net $2.70 ($2,700) and we’ll buy back the short May $14 calls as we already gained 51% on those. Hopefully we can recover $2 ($1,000) on the Dec $12s and that would make our net $2,475 on the $4,000 spread with $1,525 (61.6%) upside potential.
-
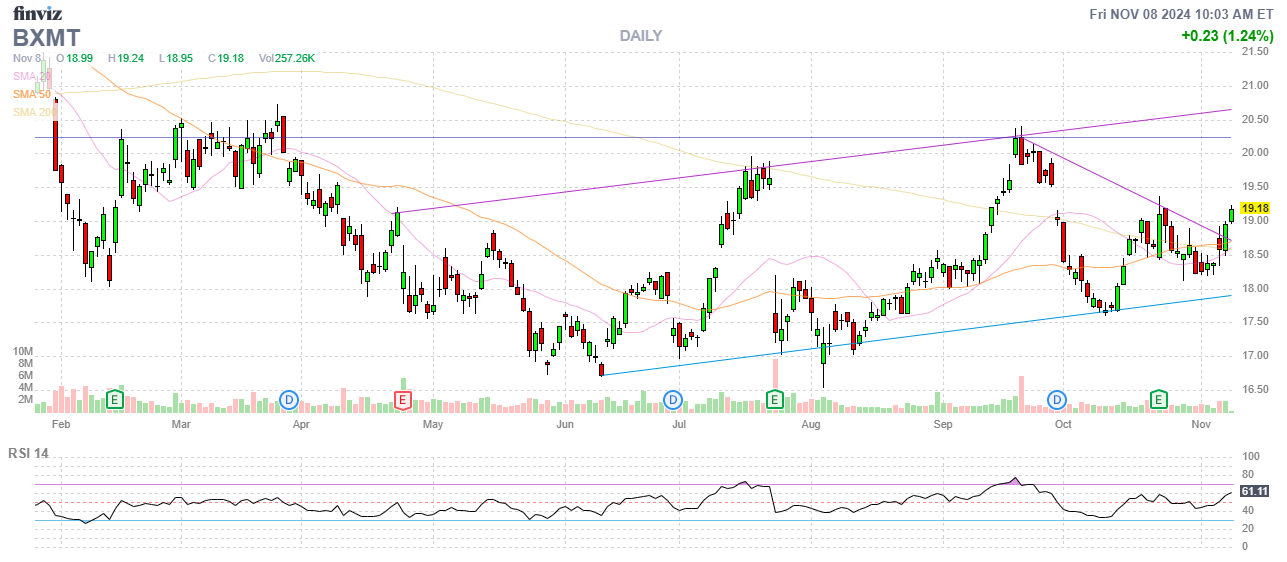
- BXMT – These guys pay a great 0.62 ($2.48/yr – 12.8%) dividend! They are right on track and all is well at net $1,319 on the $1,800 spread so there’s $481 (36.4%) left to gain PLUS 5 x $62 is $310 (23.5%) so net net $791 (59.9%) upside potential and, of course, we’ll roll it and just keep this money rolling in! Let’s double down on this one!
-
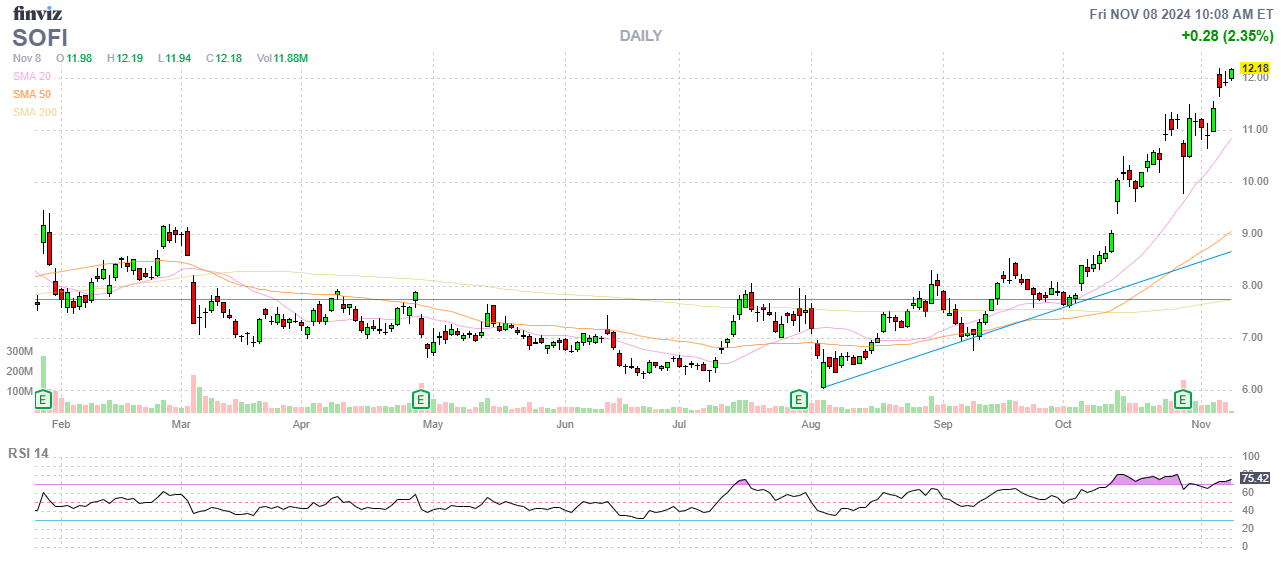
- SOFI – Finally taking off (told you so all year!) and, since our short Jan $10 calls are $2.28 and pretty much out of premium, let’s take the time to roll them ($455) to 2 short April $12 calls at $1.90 ($380) so we’re spending net $75 to buy $200 in position – good trade off! It’s a $3,500 spread at net $1,510 so $1,990 (131%) upside potential on this one.
-
- TRVG – Earnings were disappointing but our net entry was $1.70 and it’s at $1.67 so no reason to bail. Let’s see how next earnings go. EXPE had great numbers, so that’s encouraging.
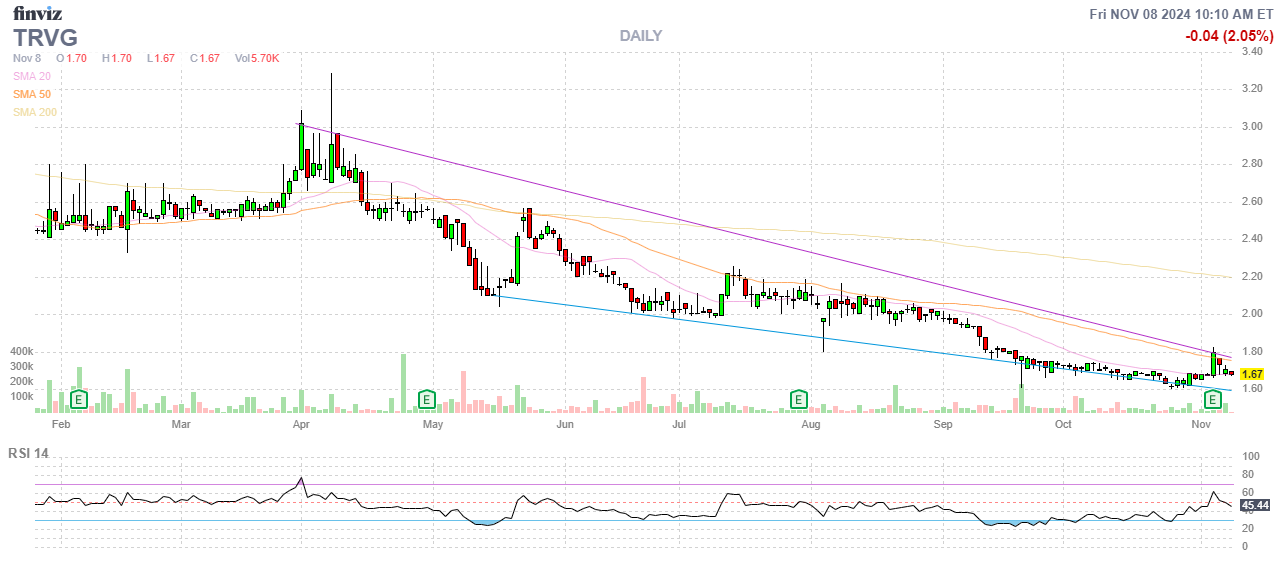
See, I only THINK I’m bearish until I review my portfolios and then I realize I have faith in my positions, which leads me to believe the macros aren’t as bad as I thought. Thank you, President Trump! We’re still two months away from that reality and we do have our SQQQ hedge (now doubled) – and we still have a good amount of cash on the side but I’m not going to add more positions at the moment (my cautious side) – but maybe in the next few weeks if things stay high.
Also, the 16 positions we have now have $29,650 of upside potential and that’s 85.6% of the entire portfolio by Jan 2027 so ahead of our current pace and, of course, we will add things along the way – so no pressure to find more ways to make money and we just spent $6,794 of our $12,421 in cash – I like cash so we should certainly not use all of it for no reason!
So we’ve made 83.2% in our first 26 months and, in the next 26 months, we expect to make another 85.6% on the road to ending up with over $1M in January of 2034 – what a fun trip to be on…
[ctct form=”12730731″ show_title=”false”]


