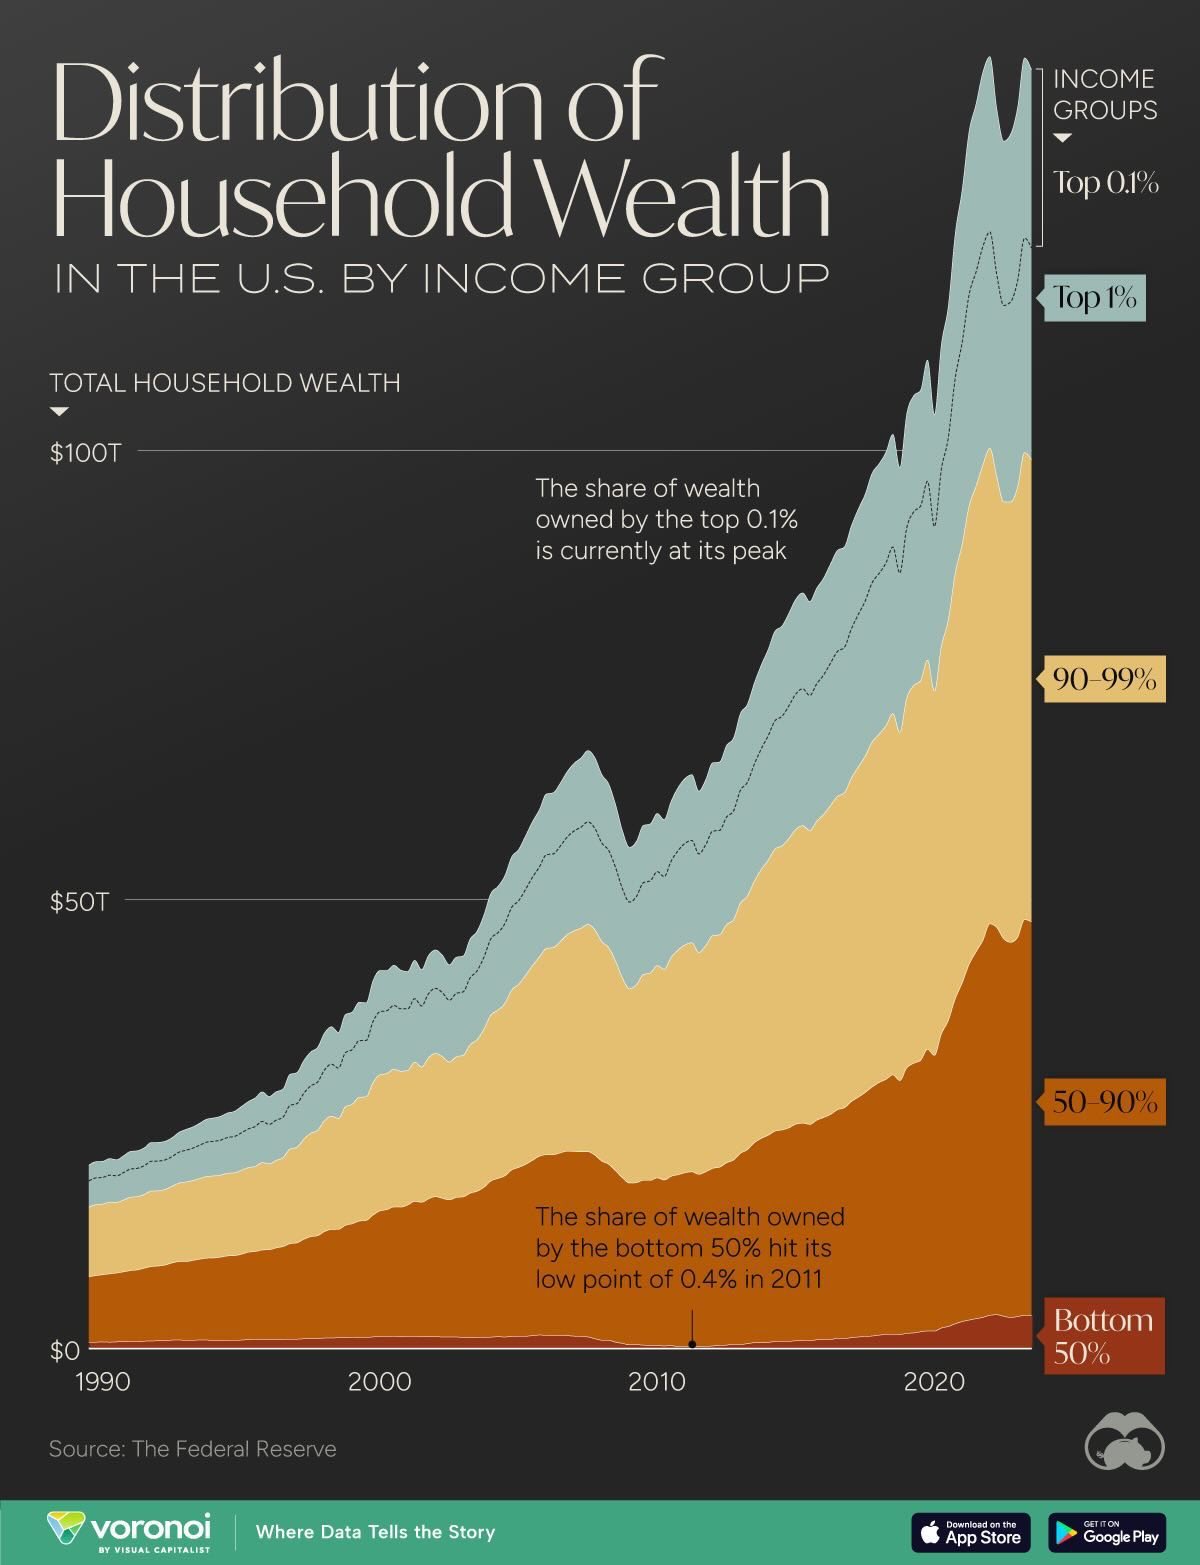
 Where are you on this chart?
As this year’s market rally has expanded the Nation’s wealth to almost $150Tn, the distribution of that wealth has become even more skewed as 80% of those gains came from the market and, as they say about the lottery – you can’t win if you don’t play!
Unless you are in the Top 0.1%, if you divide your personal wealth by $150,000,000,000,000 you will get a percentage that is so low, you will break your calculator. In fear of some sort of Democratic retribution, the Top 1% got very active this campaign season and spent a record $16Bn electing candidates who promised not to tax or regulation them and, since they made $16Tn this year, they will get a lot of bang for the buck from their $16Bn “tip”.
In fact, in the 2024 Presidential Campaign, less than 400 families accounted for half the total money raised by the candidates. “One man, one vote” has been replaced by “One Dollar, one vote” in America and the next 4 years will give us a test-drive to see how well this new policy works out for the other 126,999,600 families who contributed the other half of the campaign contributions. I wonder whose voices will be heard?

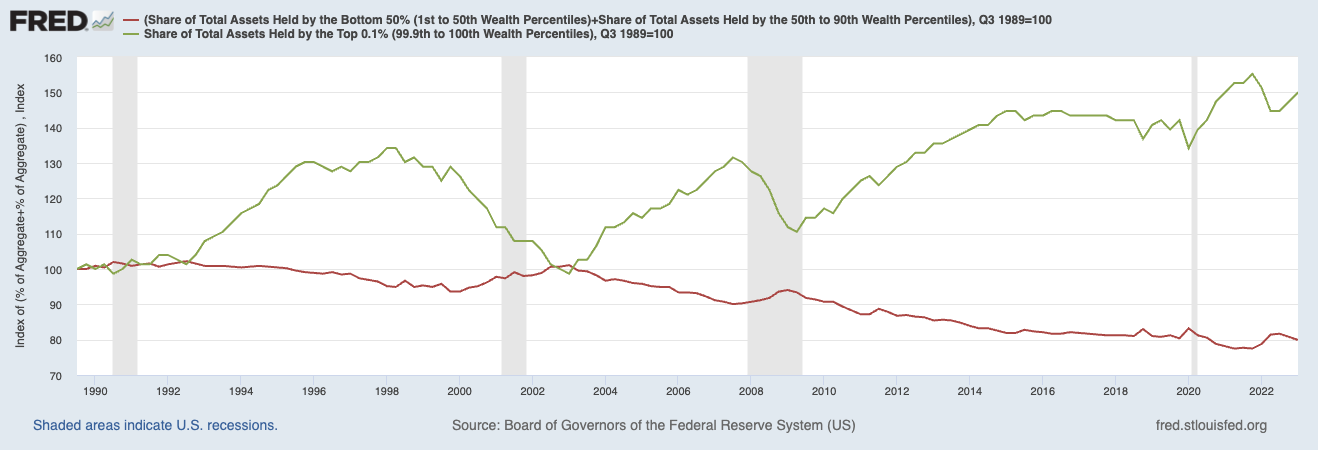
 As you can see from the chart above, in the past, when the Top 0.1% got too rich and the bottom 50% got too poor, Government would step in and, through policy, balance the scales a bit. This time around, the Top 0.1% got smart and elected a Government that has no interest in balancing the scales – I wonder how that will work out?
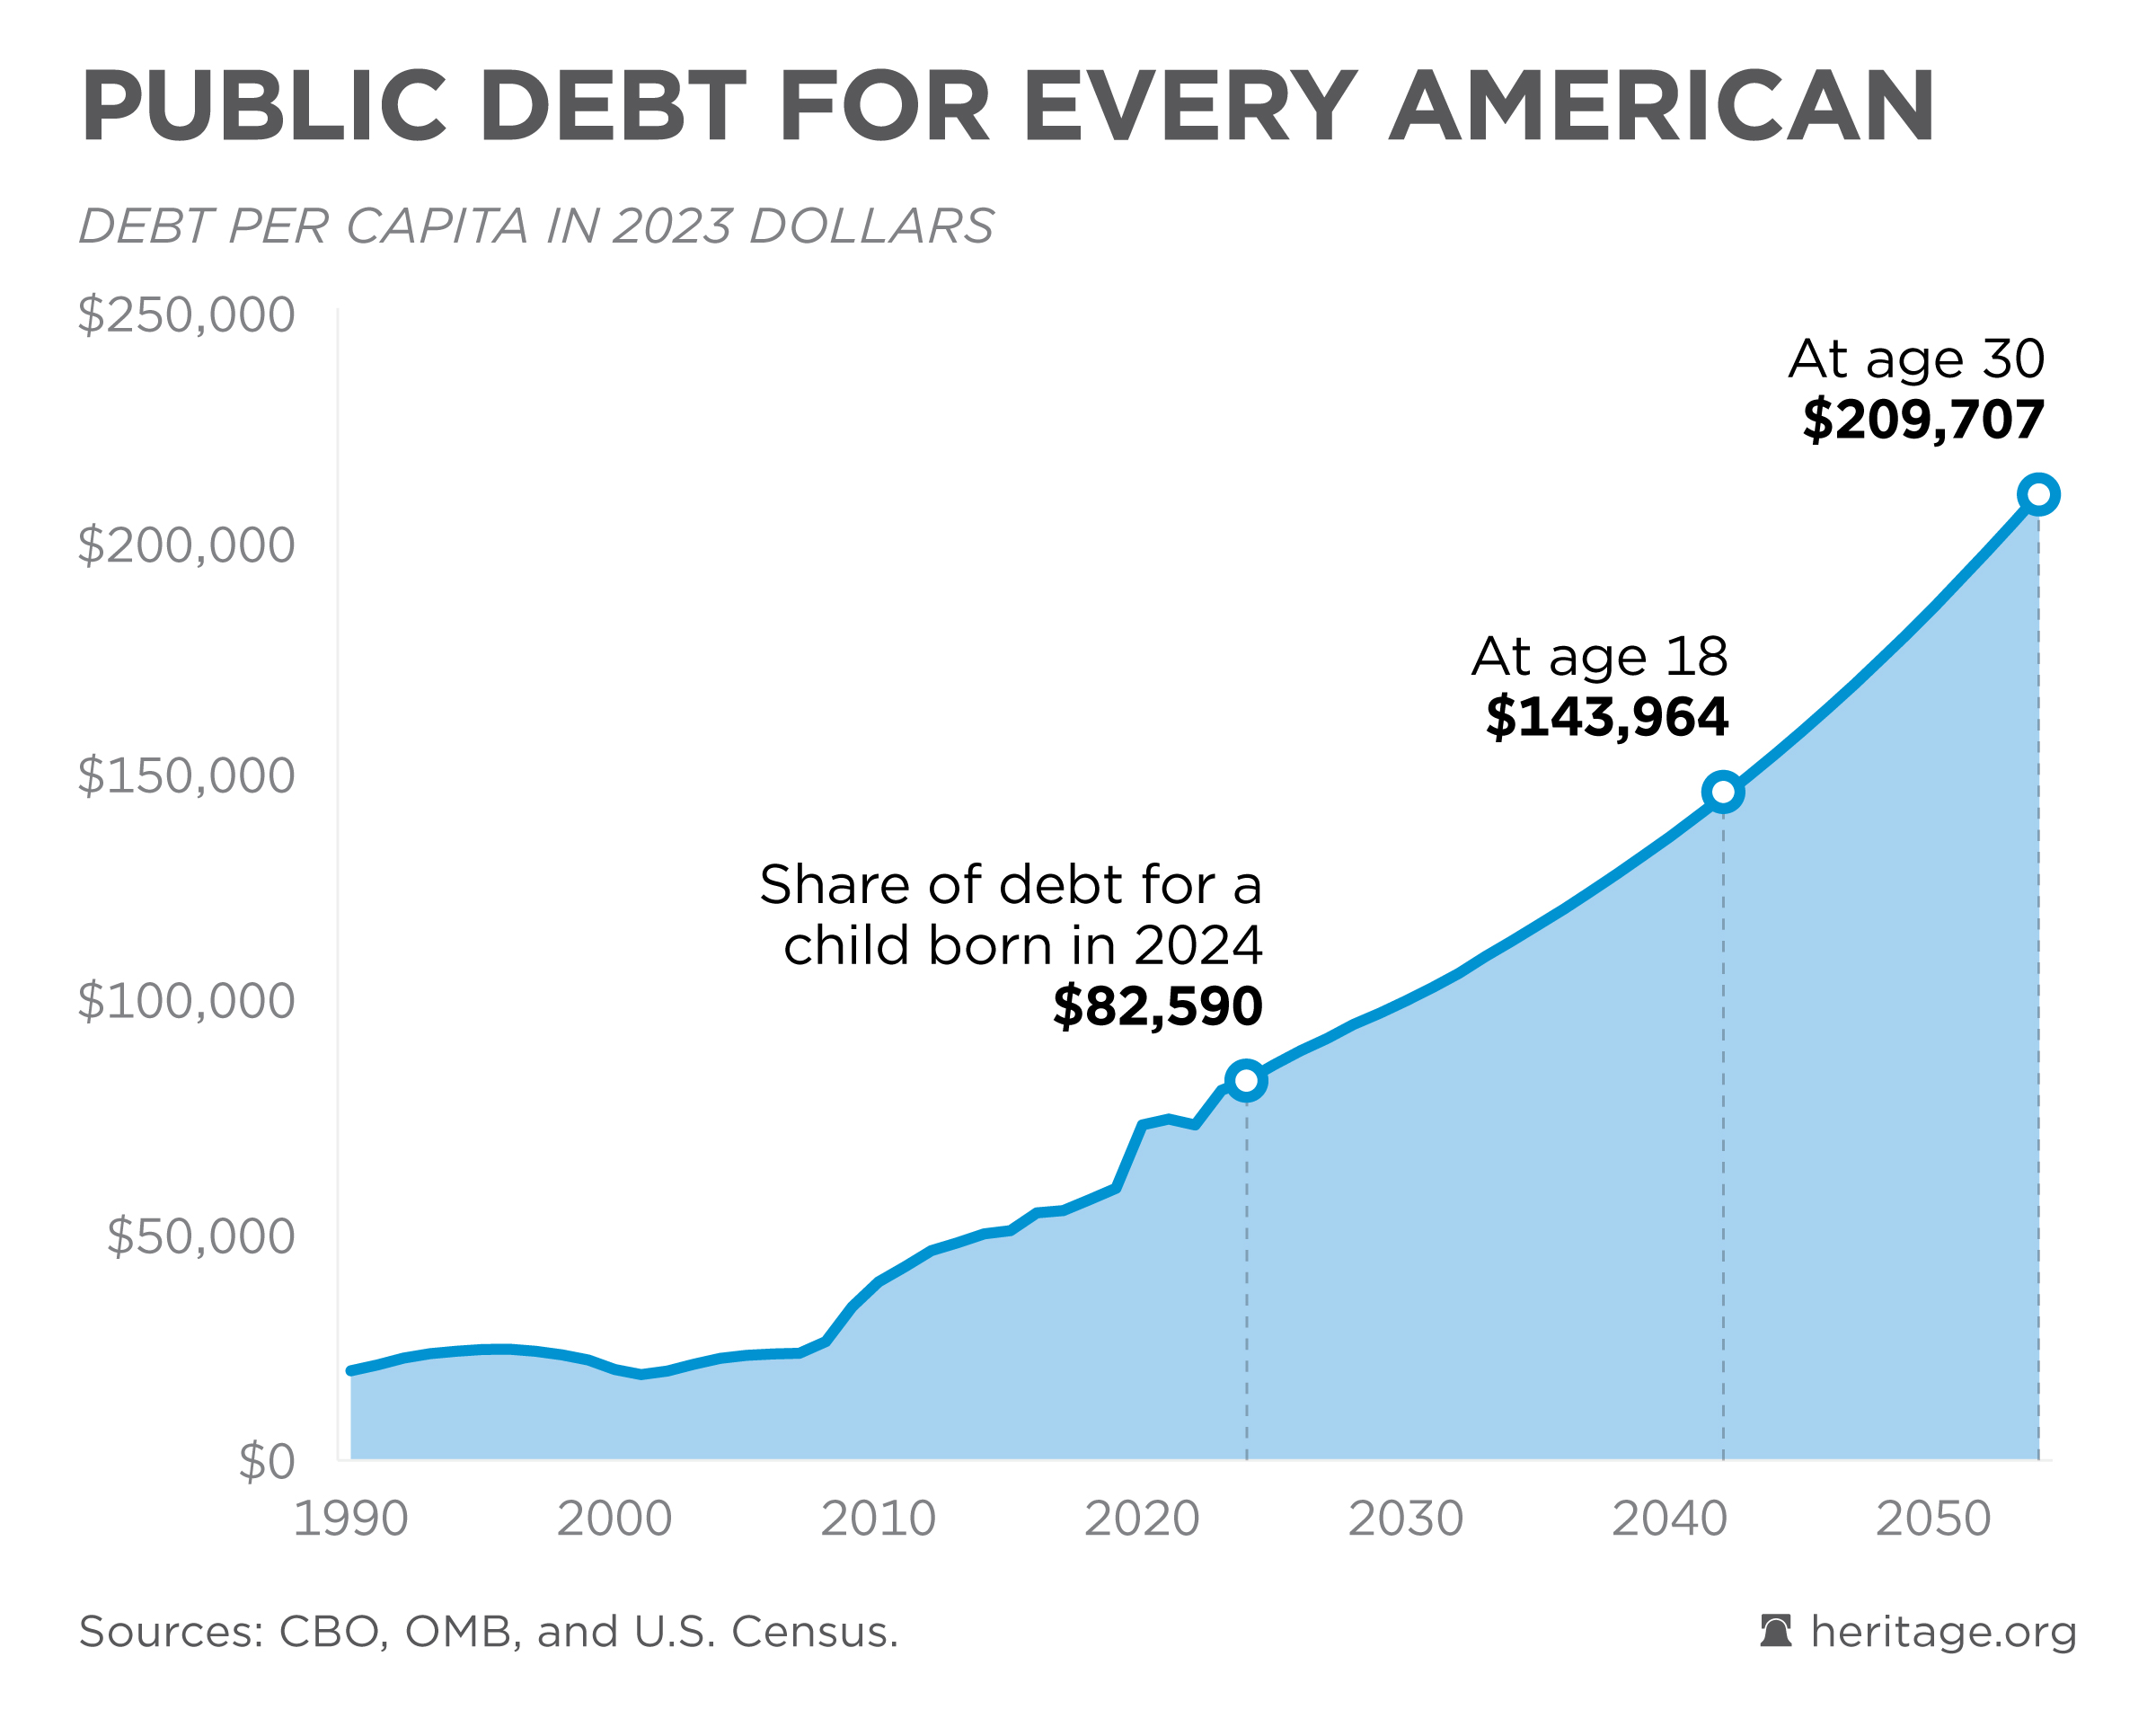
As you can see from our debt chart, not asking the Top 0.1% (including Corporations too!) to pay their fair share of taxes has some consequences. The wealth that’s accumulated at the top becomes a debt burden to those below and yes, every single American now owes $106,972 for what is now $36.2Tn in debt but $106,972 means different things to different people as the MINIMUM amount of wealth breaks down into these categories:
-
-
- $38 million for the top 0.1%;
- $10 million for next 0.9% (the rest of the top 1%)
- $1.8 million for next 9% (rest of top 10%)
- $165,382 next 40% (rest of top half)
- 0$ for the bottom 50%
-
So yes, the Top 0.1% owe the same $106,972 ($271,790 per family) that you do but, for them, it’s no more than 0.28% of their wealth while it’s 5.9% for even the Top 10% and, for the next 40%, it’s 64.6% of their total wealth. So Debt is distributed democratically and Wealth — is not…
Should the debt keep rising according to the projections (and these are very optimistic Heritage Fund projections), by 2042 Debt will wipe out the Wealth of all but the Top 10% but, REALISTICALLY, the Bottom 50% have no money and can’t pay off $106,972 no matter how mean you are to them so, in reality, the debt burden for the Top 50% is already $214,000 and all but the Top 10% are already under water.

Notice that $1.6Tn of Tax Revenues come from Payroll Taxes – that comes equally from all people UNTIL their salary goes over $110,000 – then it caps out so the people making $1Bn a year pay the same as the people paying $110,000 per year. Tariffs ad $84Bn to the collections and our beloved Corporate Masters contributed $479M out of $5Bn in taxes, a whopping 9.58% of the total! $4,000,000,000,000 of Worker Compensation came in above the Payroll cutoff – eliminating that cutoff alone would balance SS and Medicare for the rest of time with another $412Bn a year in Payroll Taxes!
Rather than do that, we will continue to kick the poor to the curb and those poor may include your parents and poor siblings and poor cousins as well, who all actually need that $2,500/month from the Government and medical care as they get older. If the Government doesn’t support them anymore – you will get the thrill of slamming your door in their faces directly – great again!
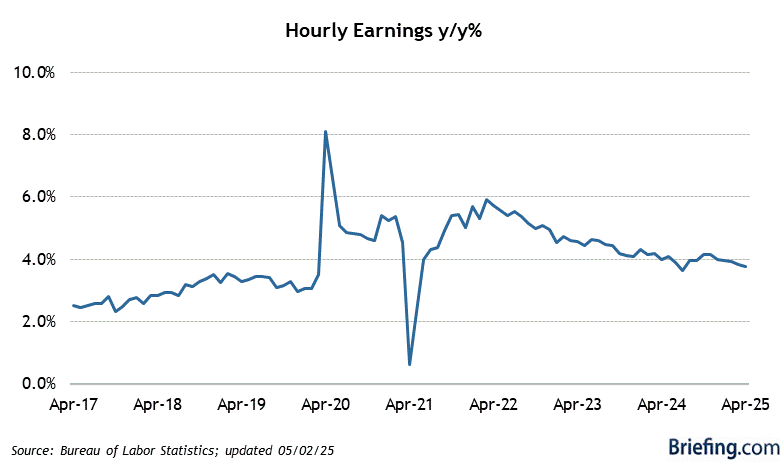
8:30 Update: Non-Farm Payrolls are UP 224,000 jobs and last month has been revised up from 12,000 jobs to 36,000 jobs and Average Hourly Earnings ticked up 0.4% vs 0.3% expected so job growth and wages are still running hot and the Fed is just two weeks away from their final rate decision of 2024.

The Average Work Week also ticked up to 34.3 hours from 34.2 and that also indicates continuing wage pressures. We’ll see what the Consumers have to say at 10am but the Futures seem happy enough with this report – ticking up on the release from negative territory.
- Oil (/CL) is testing $67.50 and we like that long into the weekend with tight stops below!

Have a great weekend,
-
- Phil
[ctct form=”12730731″ show_title=”false”]


