 $38,287!
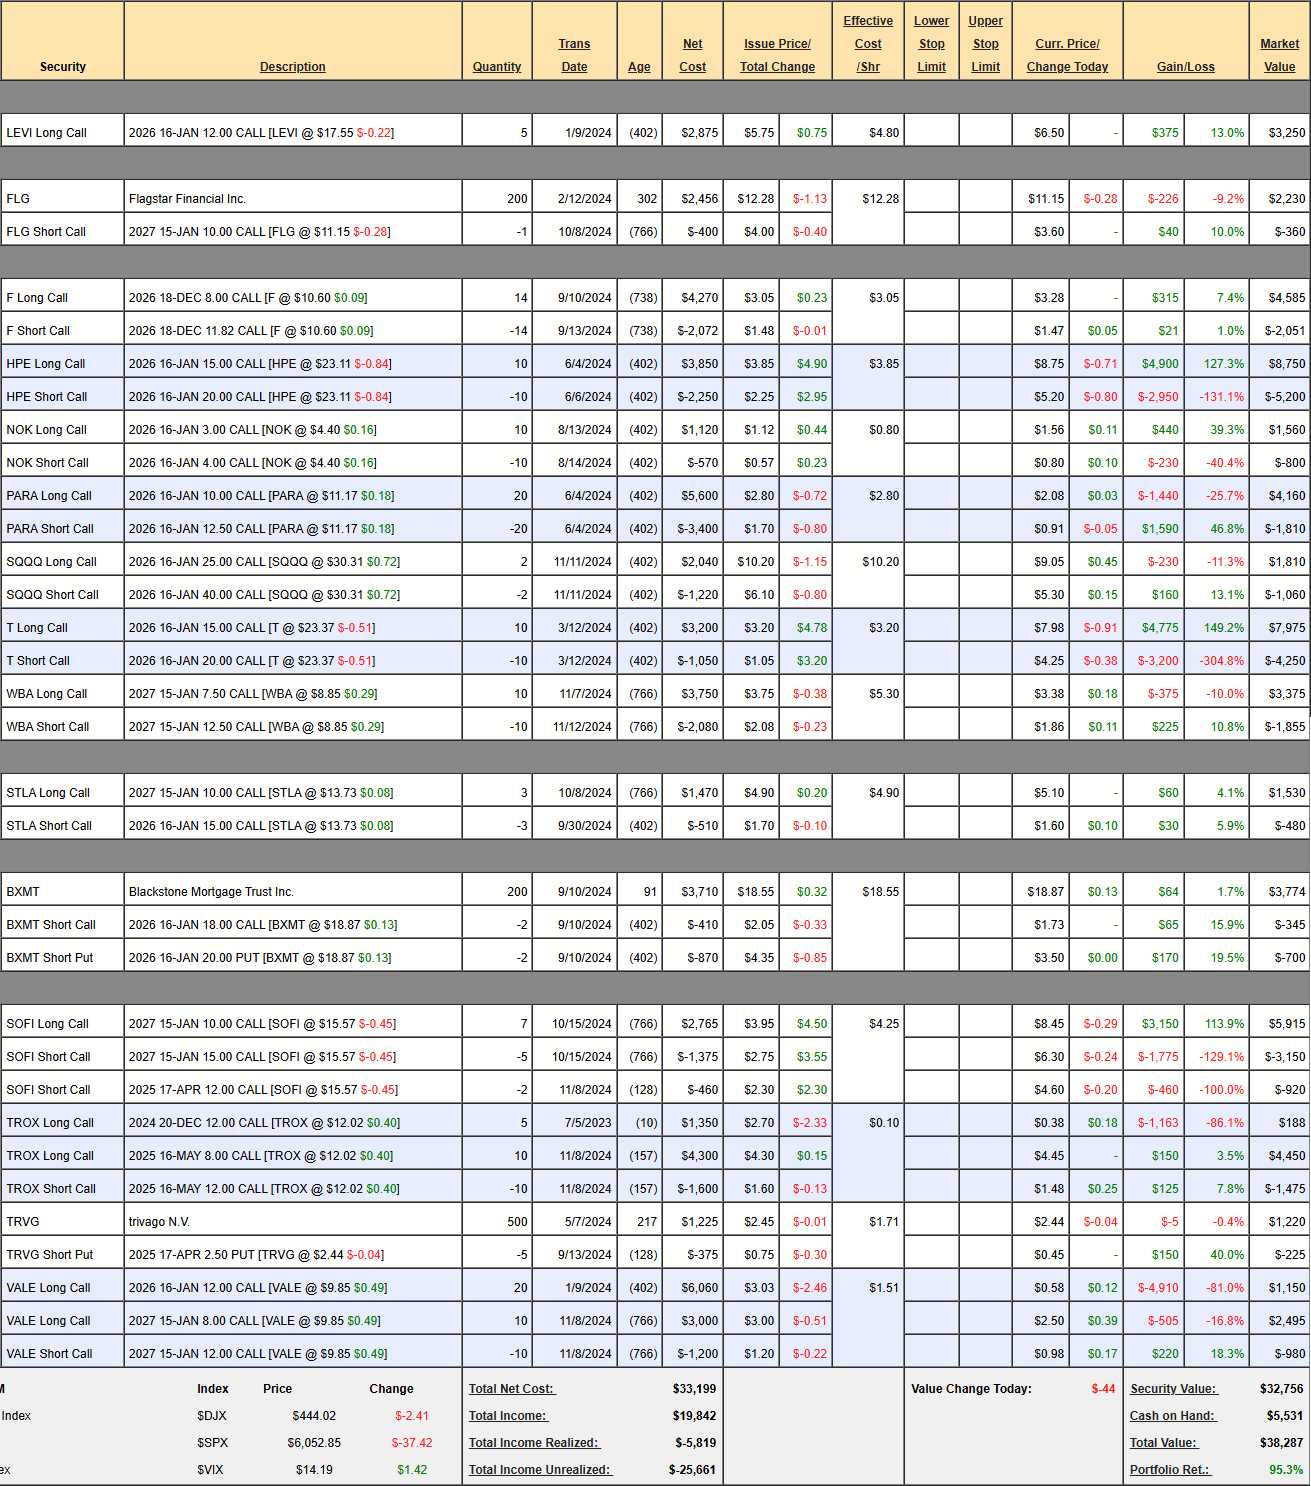
That’s up a very nice $4,653 (13.4%) since our Nov 8th Review(and includes this month’s $700 deposit) and we have now made 28 monthly deposits of $700 ($19,600) and, overall, we are up $18,687 (95.3%) in just over 2 years – not bad!
Our $700 Portfolio follows a very simple concept of investing $700 every month (10% of the average family’s income) and then finding the optimal mix of positions to give us good long-term return that will grow our nest egg. It’s a conservative, low-touch portfolio but we are using option strategies to improve our leverage and that has rocketed our gains.
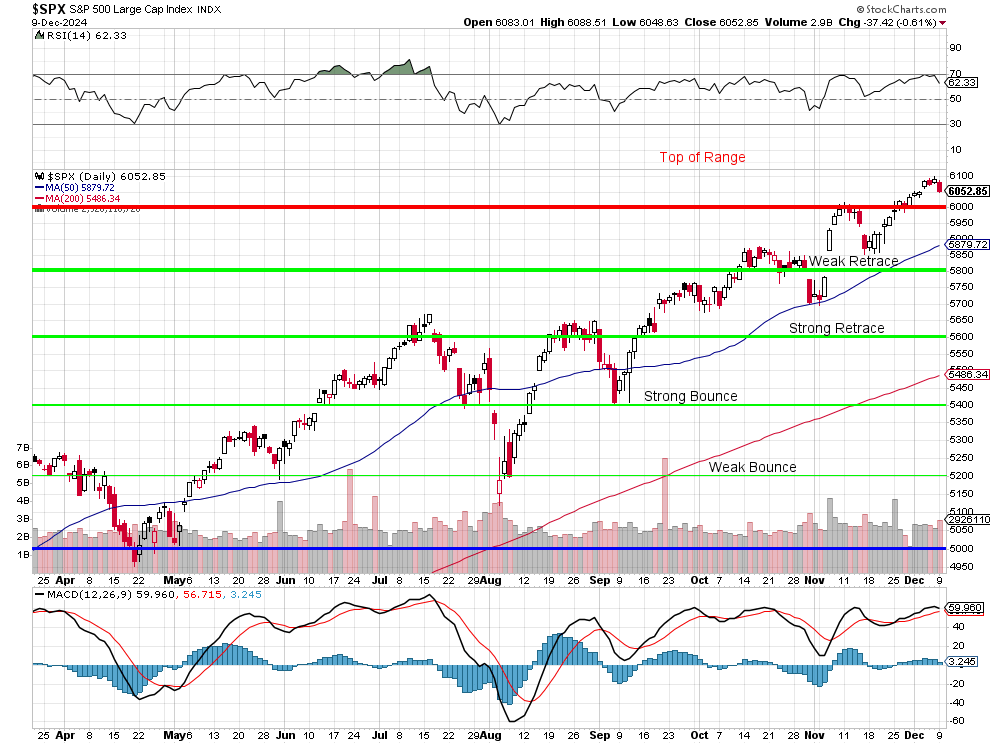
We are over the “Top of Range” our 5% Rule predicted for 2024 – so we’re simply at our goal and now we need to consider what our target is for 2025. We have not seen, so far, a rise in earnings that would dictate raising our targets – especially when we consider that, without the Magnificent 7, 2024 earnings for the S&P 493 have been essentially flat.
Last month, I was looking to play it cautiously but, in reviewing our positions, we felt safe enough playing it more aggressively but I’m not sure I will feel the same ways playing over the holidays – especially with the S&P OVER the top of our range. HOWEVER, I did say last month that, if we popped over 6,000, we could get more aggressive – so we’ll play it by ear, I suppose.
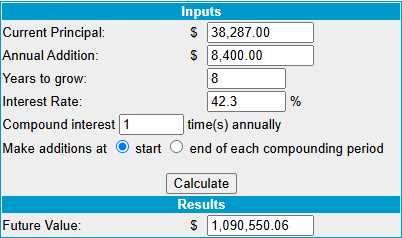
As you can see from the compound rate calculator, all we have to do is keep up this pace for 8 years and we hit our $1M goal – 20 years sooner than planned! This also means, by the way, that you can start following this portfolio now, with $38,287 and a commitment to add $700 a month for 8 years – and you’ll be right on track with us on our path to $1,000,000!
Last month, it was going to take us 9 years (and 10 years the month before that) – that’s what a very tiny improvement in our performance yields us – a very good reason to buy more dividend stocks, I think. Let’s first go over our existing positions and make sure we feel safe. We spent half of our CASH!!! last month and those changes worked great, so it’s going to be more more about locking in our gains this month:
-
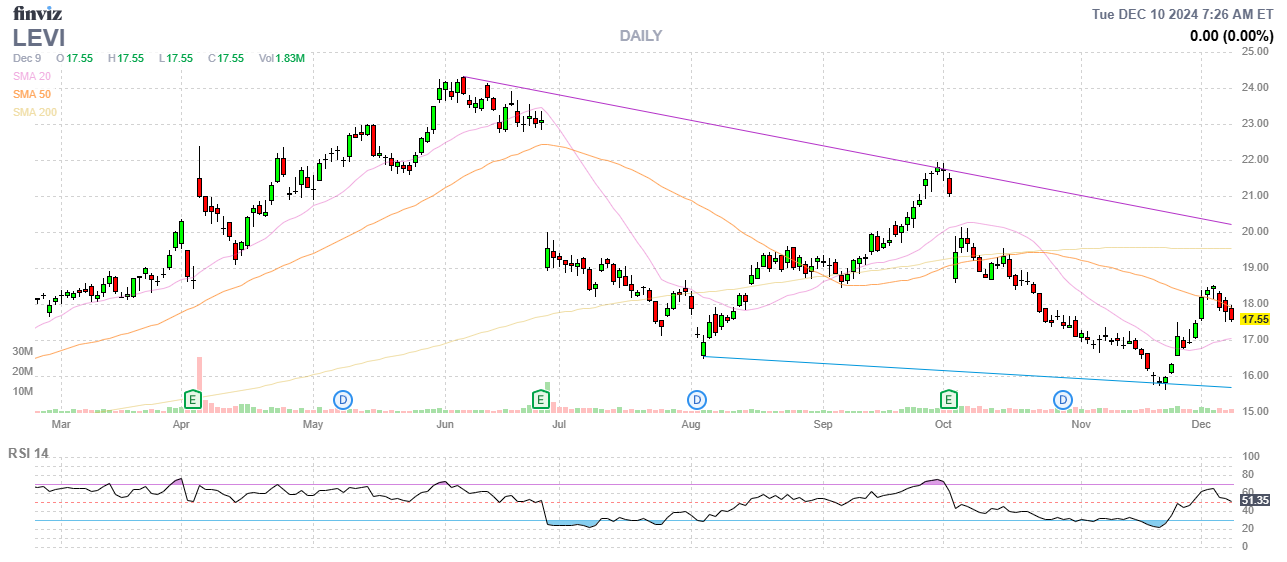
- LEVI – We went aggressively long last week and the calls went from $5.80 to $6.50. There’s $1 of premium and, at $20, they are worth $8 ($4,000) and that’s our goal so $750 of upside as it stands. That means we’re better off cashing these in ($3,250) and buying 10 of the 2027 $15 ($4.90)/20 ($2.65) bull call spreads for net $2.25 ($2,250) as those have $2,750 of upside potential at $20 and it also puts $1,000 back to work in our portfolio.
-
- FLG – Was NYCB. Simple covered call, over our target at net $1,870 out of a possible $2,000 in two years and not paying a dividend is simply not worth keeping. Let’s cash it in.
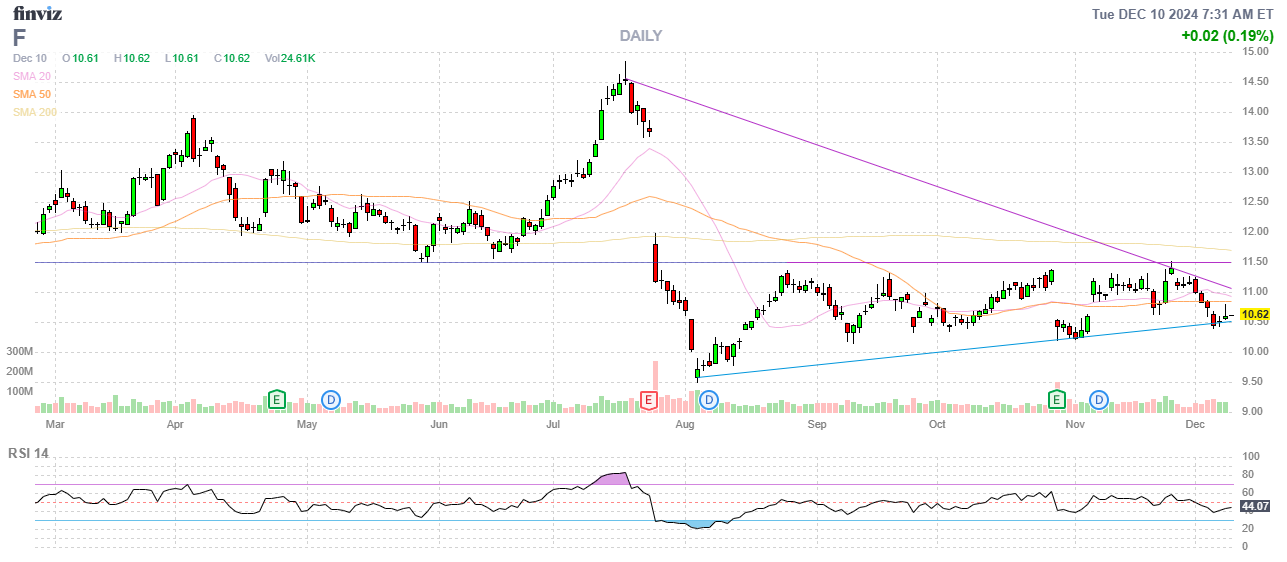
- F – Right on track at net $2,543 on the $5,348 spread with $2,805 (110%) upside potential so that’s good for a new trade!
-
- HPE – Blew over our target and already net $3,550 on the $5,000 spread so $1,450 (40.8%) left to gain.
- NOK – Also already over our goal at net $760 on the $1,000 spread so $240 (31.5%) left to gain here.
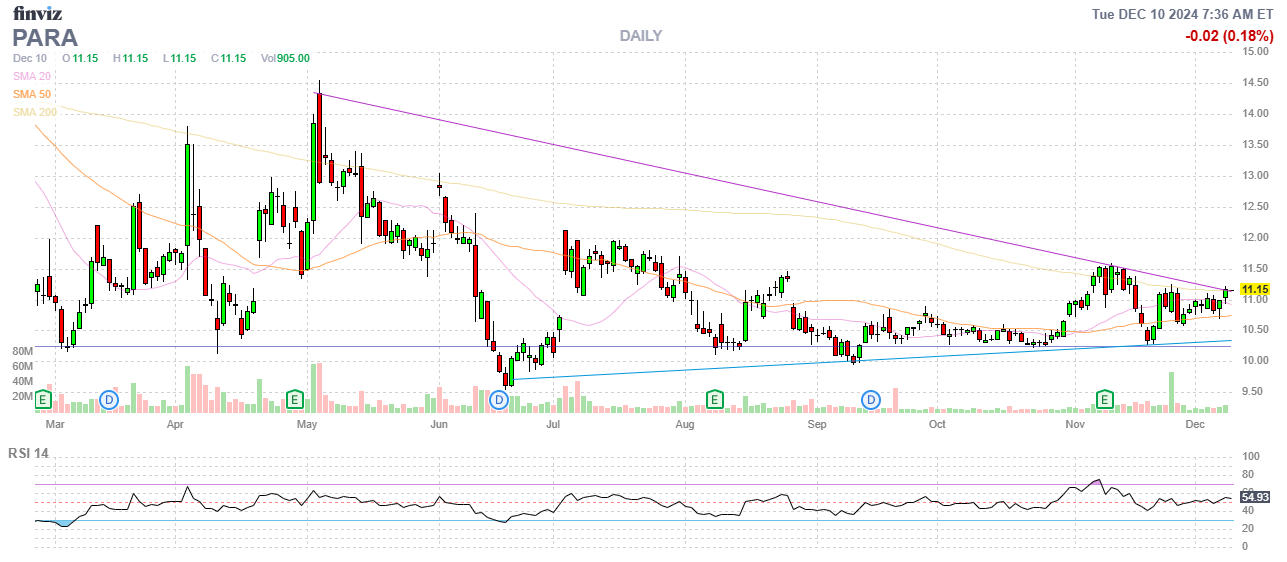
- PARA – I still think they close over $12.50 and that would pay us $5,000. Currently net $2,350 so $2,650 (112%) upside potential. I would say good for a new trade but it’s been so frustrating for us waiting for this to get moving…
-
- SQQQ – This is our hedge. SQQQ is at $30 and it’s a 3x ETF so, to get to $40, it has to pop 33% and that means the Nasdaq has to fall 11%. It’s a $3,000 potential spread at net $750 so there’s $2,250 (300%) downside protection in this hedge. As we are $1,000 in the money at $30 and as we have such good leverage – Let’s add 2 more for net $750 and double our protection over the holidays.
- T – Blew past our target at net $3,725 on the $5,000 spread so we have $1,275 (34%) left to gain.
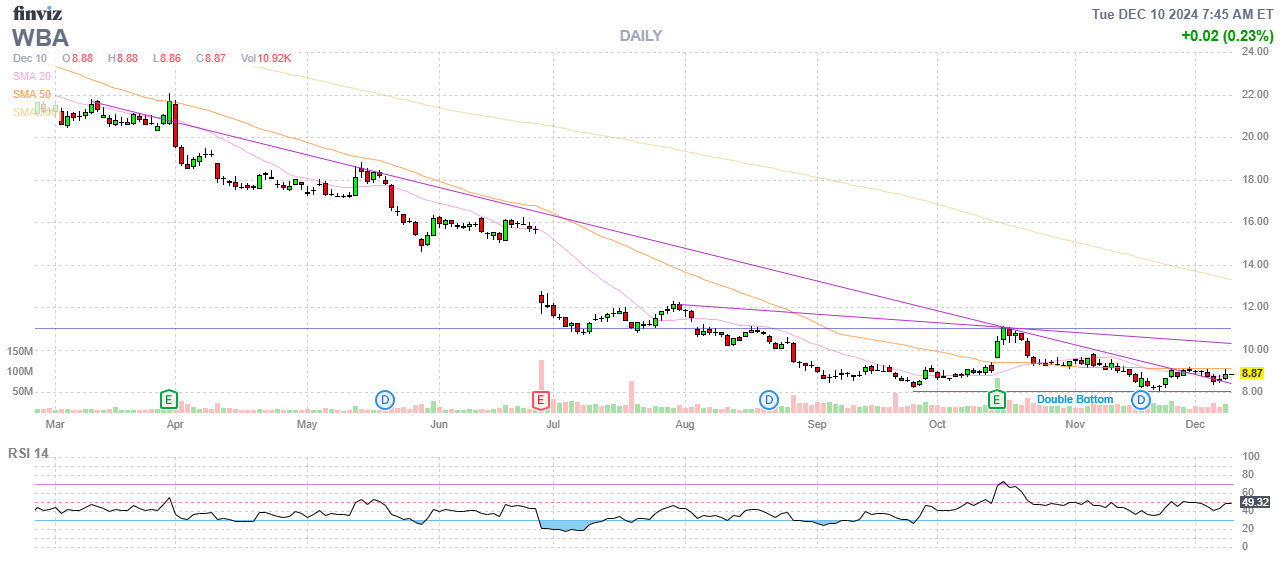
- WBA – Another frustrating choice that is not getting going so far. We are giving them one more earnings (mid-Jan) to see if they are getting back on track or not.
-
- STLA – On track for $1,500 at net $1,050 but we’ll also be able to sell another round of short calls ($510) so we expect $960 (91.4%) of upside potential.
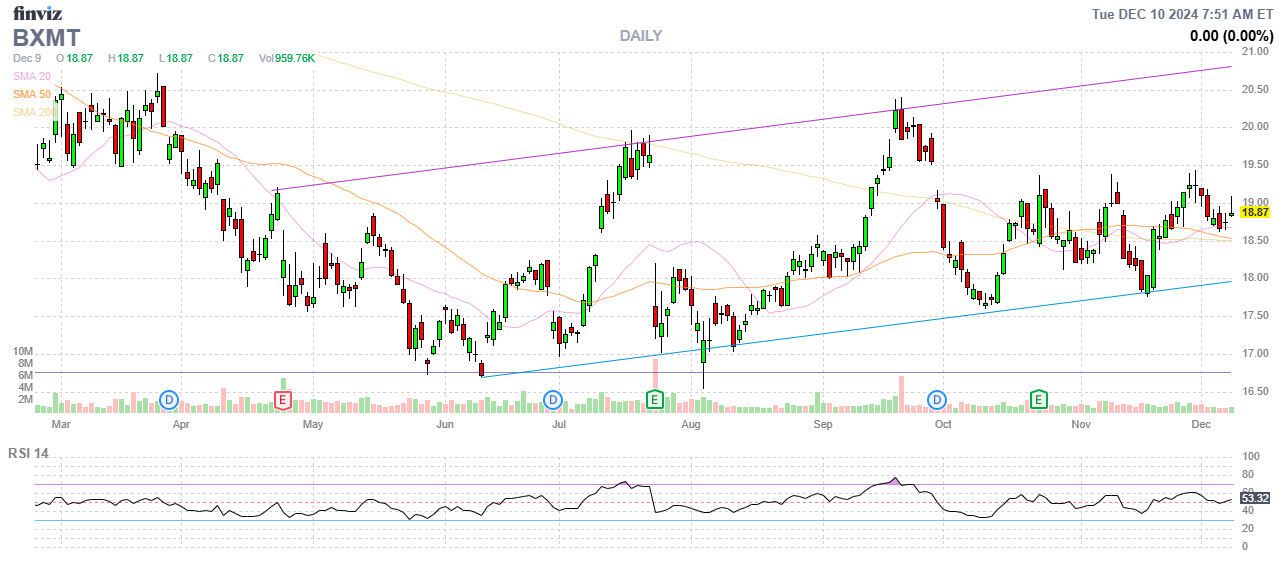
- BXMT – We should be getting an 0.47 ($94) dividend on Dec 30th and it’s a $3,600 spread on target at net $2,729 so 5 more dividends ($470) and $871 left to gain is $1,341 (49.1%) upside potential.
-
- SOFI – Over our second goal (we cashes out the first) already at net $1,845 on the $3,500 spread (we will roll the short calls along) so that’s $1,655 (89.7%) left to gain.
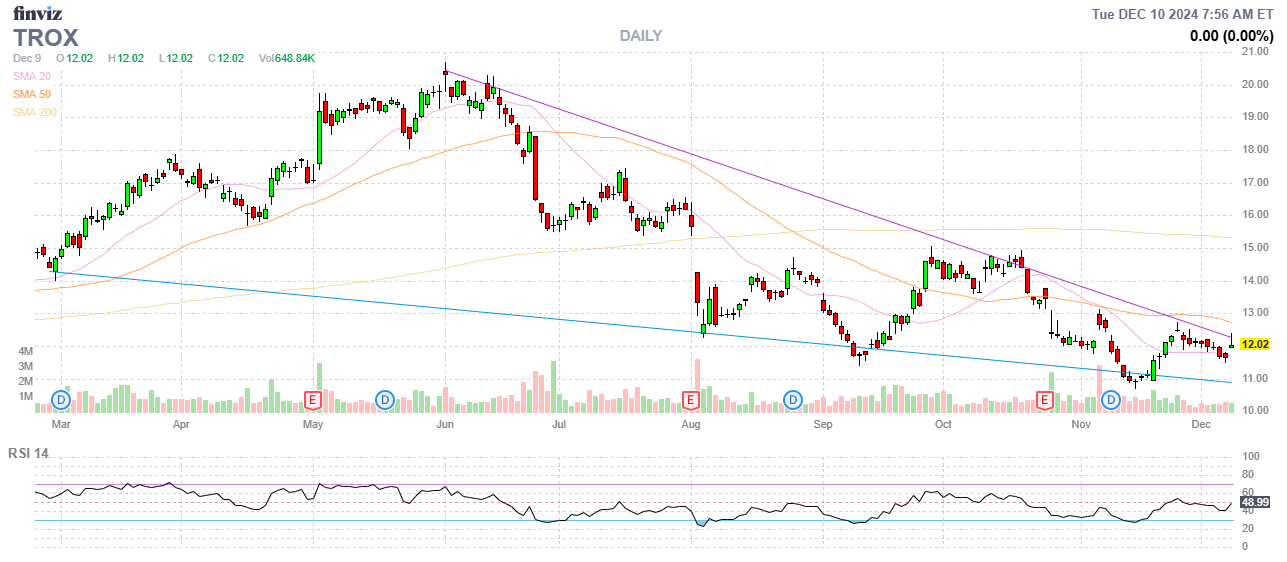
- TROX – Yet another one over our goal at net $2,975 on the $4,000 spread with $1,025 (34.4%) upside potential on the spread. For the calls, which expire soon, we are simply hoping to have some improvement.
-
- TRVG – At goal at net $995 on the $1,250 spread with $255 (25.6%) upside potential – by April.
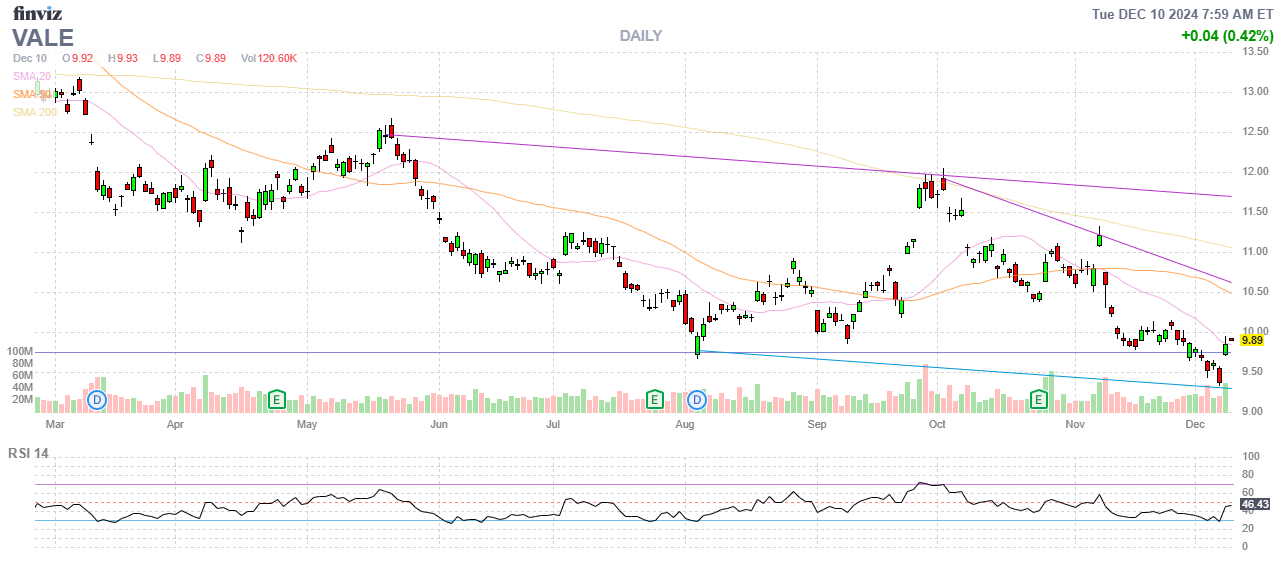
- VALE – This is a 100% bullish spread on our 2024 Trade of the Year. We’re miles behind so far and hoping people realize the potential for this stock before we run out of time.
We’ve taken $2,120 off the table in our adjustments and we’ve left ourselves with $16,406 of upside potential and we have our now $4,500 hedge protecting us as well as the build-in hedges (short calls) on our spreads so I’m feeling pretty good going into the holiday!
Sign Up for Updates
Get the latest stock market news from Phil by signing up for our newsletter!
By submitting this form, you are consenting to receive marketing emails from: . You can revoke your consent to receive emails at any time by using the SafeUnsubscribe® link, found at the bottom of every email. Emails are serviced by Constant Contact


