9 evergreen investor lessons from 2024
[Sam Ro highlights key lessons for investors derived from market and economic dynamics in 2024. Among these lessons, it emphasizes the importance of context when interpreting facts and metrics. Investors should distinguish between relative and absolute metrics to avoid confusion and remember that single metrics can send false signals. Timeframes are also critical; experts’ views may vary based on whether they are focused on short- or long-term outcomes. Other insights include the tendency of stock splits to reflect management confidence, the divergence between economic reality and sentiment, and the zigzag nature of economic data.
The macroeconomic review illustrates the continued resilience of the U.S. economy. Key indicators such as inflation, consumer spending, and unemployment remained robust, even amid cooling economic growth. Stock market dynamics showed that earnings drive long-term price trends, and while markets may experience volatility, historical patterns suggest resilience. Lessons on managing investor expectations, focusing on earnings rather than sentiment, and navigating risks in a complex environment reinforce the article’s overarching message: while challenges persist, staying informed, patient, and focused on fundamentals remains essential for success in investing. Check out more from Sam Ro here >]
9 evergreen investor lessons from 2024
Plus a charted review of the macro crosscurrents

A lot of stuff happened in 2024.
While it may be difficult to compile a comprehensive list of all the major events of the year, hopefully we’ll at least be able to remember the lessons we learned from them. Specifically, the lessons we may be able to apply in the future as we try to make sense of what new developments mean for our investments.
Here are some of the lessons TKer learned (or relearned) this year.
1. Facts can be misleading
Most major news outlets are very good at accurately reporting what they report. But that doesn’t mean what you see reported won’t lead you astray.
In my many years consuming and processing an ungodly amount of news, I’ve noticed three types of accurately reported facts that can be problematic: 1. A source who’s quoted accurately, but the source is wrong; 2. A stat that’s true, but lacks relevant context; and 3. An anecdote that’s real, but the bigger picture reveals something else.
The lesson: All reported information needs context and double-checking.
For more, read: Three types of ‘facts’ that can lead you astray 🗺️ and Eye-popping, headline-grabbing market stats often aren’t as extreme as they seem 🤦🏻♂️
2. Relative metrics and absolute metrics can send seemingly conflicting signals
Aspects of the markets and the economy can be worse and good, simultaneously. They can also be both better and bad. That’s because “worse” and “better” are relative terms, and “good” and “bad” are absolute terms. Kind of like when you’re starting to recover from the flu: Maybe you feel better, but that doesn’t mean you feel good.
In the markets and the economy, this can get confusing when you consider developments in the various metrics investors follow. For instance, size is an absolute. And the relative terms used to describe size include “growing” and “shrinking.” But the concept of growth can also be considered an absolute. And relative terms like “accelerating” and “decelerating” describe it.
Another layer of complexity comes when newly released data is measured against analyst forecasts. A metric can simultaneously be good, growing, and accelerating and yet fall short of analysts’ estimates.
The lesson: Just because a metric has gotten worse or fell short of expectations doesn’t mean it has gotten bad. Be wary of headlines that emphasize relative metrics.
For more, read: Don’t confuse your relatives with your absolutes 🤔
3. Reliable metrics will sometimes send false signals
Economic forecasters over-indexing to metrics like the yield curve and the Conference Board’s Leading Economic Index have learned this lesson the hard way: These once reliable predictors of recessions have failed to do so in recent years.
Not everyone was surprised as the overwhelming bulk of other data suggested the economy had a lot of growth left in it.
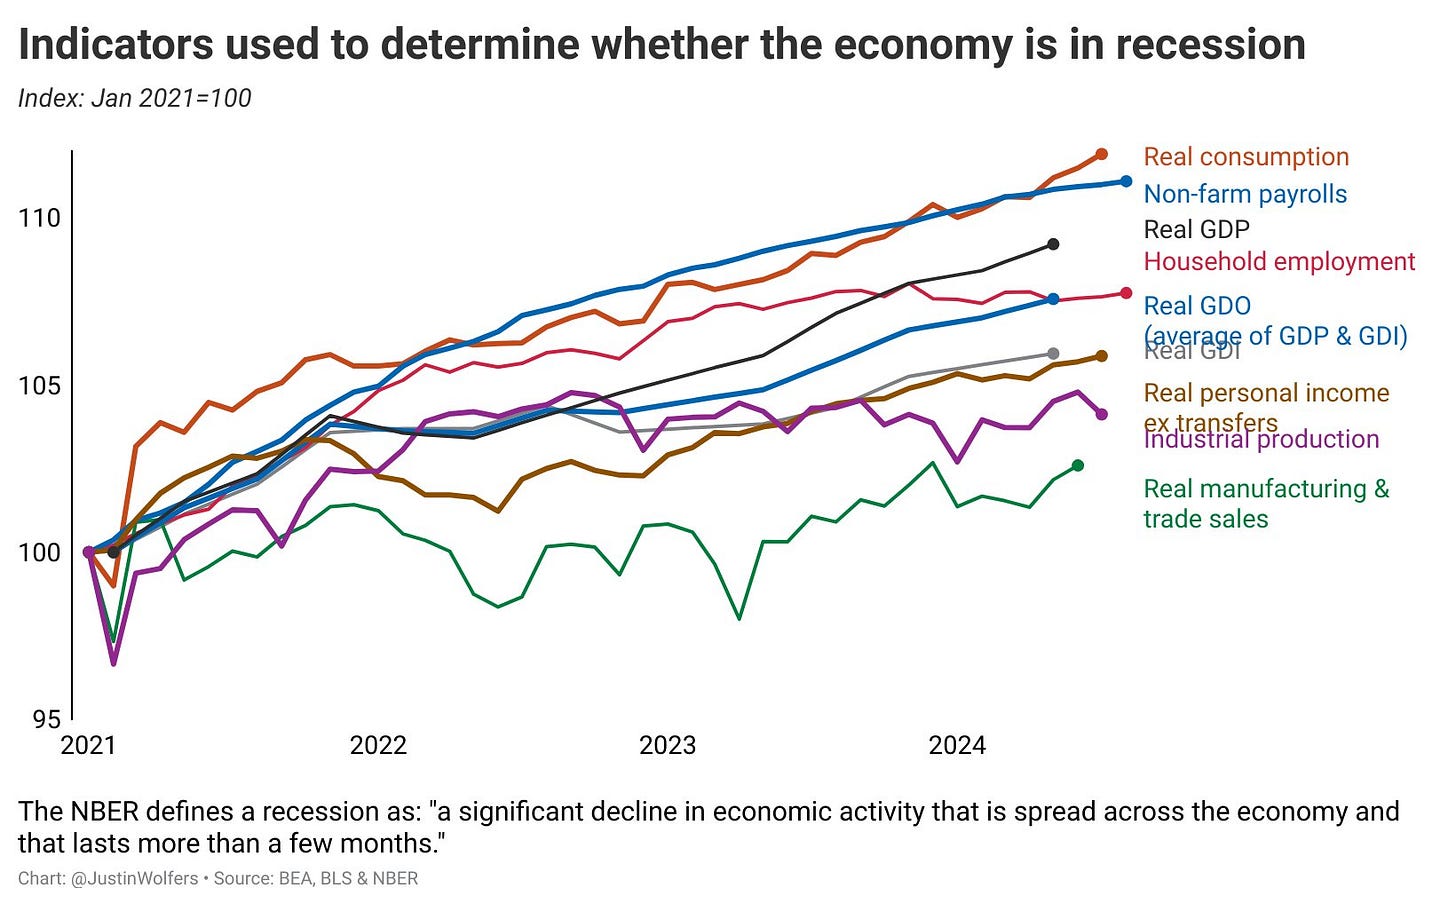
We’re lucky to have so many angles on the economy. Almost every day, we get periodic updates on things like jobs, manufacturing activity, housing, income, spending, sentiment, and so on. There are many opportunities to confirm or reject the signal of a single metric.
The lesson: Don’t count on the signal of a single metric.
For more, read: Rule No. 1 of analyzing the economy 📋 and There are ‘rules’ and then there are ‘statistical regularities’ 🧮
4. An expert’s market view may change with timeframe
Some people try to make money trading the stock market over short-term periods. Some aim to build wealth by investing in the stock market over long, multi-year timeframes. Many do some combination of both.
When a markets expert starts talking, the first question you should ask is: “What is the timeframe?” Is it one month? One year? Several years? One day?
Why? Because it’s possible that the same person who’ll tell you stocks will fall in the coming weeks will also tell you they expect prices to be higher in the coming years. In fact, I can almost guarantee you that the Wall Street strategists who expect the S&P 500 to fall in the next year will also tell you it’ll be much higher in three to five years.

The lesson: If you’re going to take an expert’s view seriously, make sure you know what timeframe they’re speaking to.
For more: read: The first question to ask when a markets expert speaks 🙋🏻♂️
5. Stocks that split tend to outperform
Theoretically, a stock split does not reflect any change in the underlying company’s fundamentals.
However, a stock split might reflect management’s conviction in the fundamental prospects of their company, which could arguably boost the market value in the coming months, quarters, and years. Indeed, history shows that companies that announce a stock split tend to outperform the market.
The lesson: Theory and practice don’t always line up in the financial markets.
For more, read: The curious thing about stock splits 🔪
6. There’s more than one way to perceive the same economy
In 2024, the economy continued to expand, the labor market continued to add jobs, and inflation continued to cool. You can’t dispute these hard data facts.
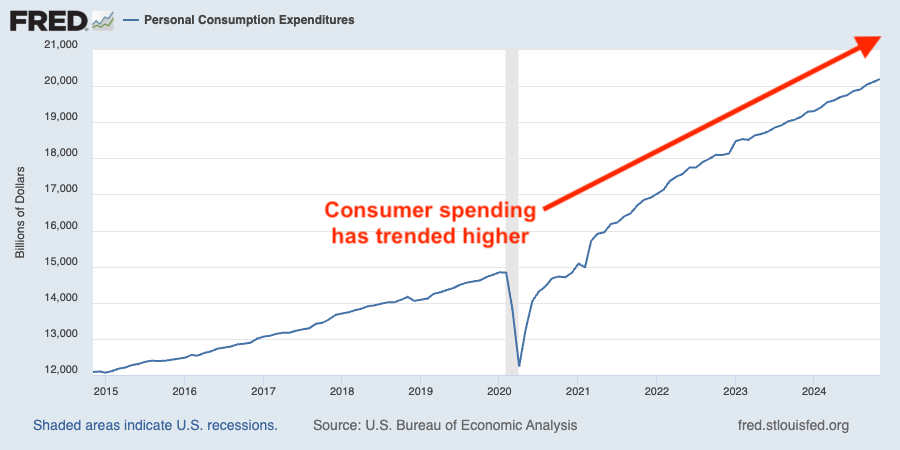
But business and consumer sentiment was mostly weak during the year. In other words, many people didn’t feel good about the state of things even though their economic situation may have actually improved.
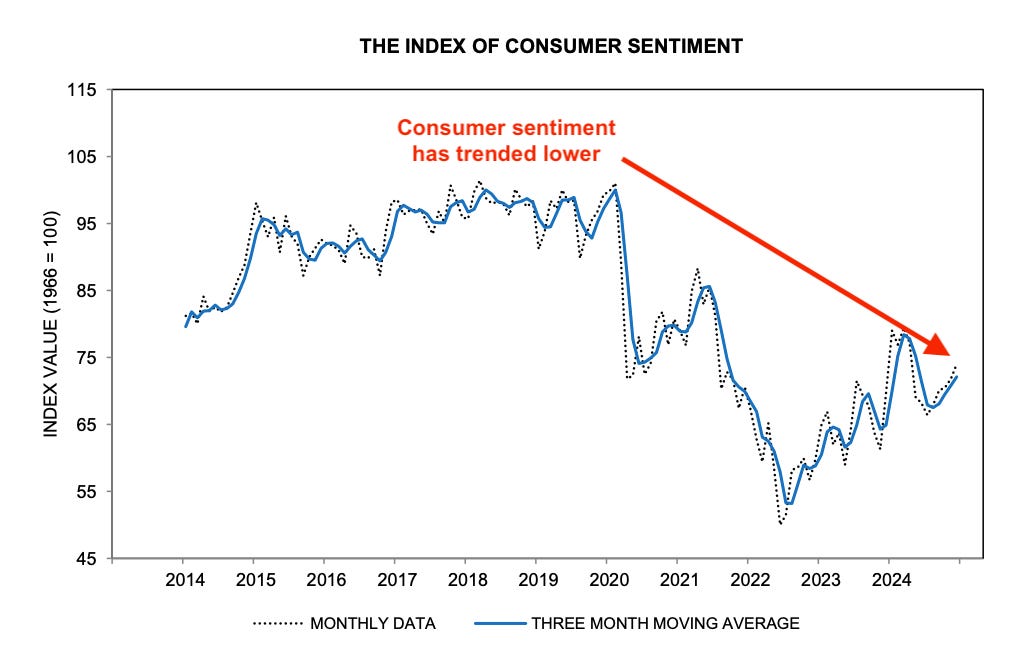
Maybe it was the influence of politicians advancing biased narratives. Maybe it was the effect of slanted news coverage designed to maximize engagement.
The lesson: Investors should focus on tangible developments that affect earnings, which are the most important long-term driver of stock prices. Earnings are driven by what actually occurs in the economy, not by how people feel about the economy.
For more, read: 4 different ways of looking at the exact same economy 🪖👒🎩🧢
7. Data will zig zag
Economic data can be “full-on Monet”: From a distance, patterns and trends become clear. But up close, it’s a mess.
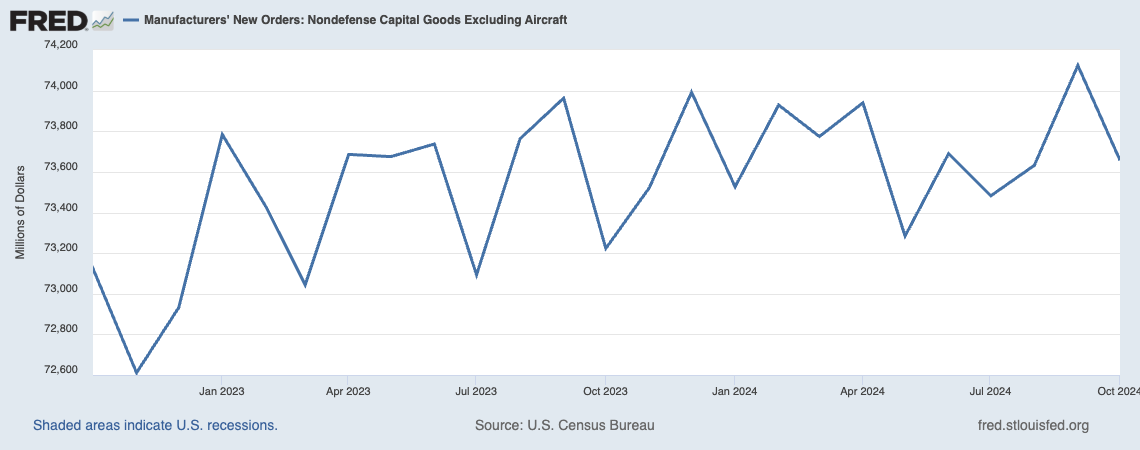
Analyzing short-term moves in data is treacherous work for anxious investors and traders who are eager to adjust their positions in anticipation of major shifts in the economic narratives.
Unfortunately, the end of a prevailing narrative and the emergence of a new narrative only become clear with months of hindsight. What might initially look like an inflection in a trend is often just noise.
The lesson: Don’t freak out when one month’s worth of data moves in an unexpected direction.
For more, read: ‘Check yourself’ as the data zig zags ↯
8. Expect a lot of bad news coverage of the stock market
The stock market usually goes up. Historically, prices have been in bull market over 80% of the time. If this is the case, then why does so much news about the stock market seem to be negative?
As we’ve discussed before, negative stories tend to draw more audience interest than positive ones. This includes bearish warnings about what’s to come. Some news outlets capitalize on this behavior by giving outsized coverage to bad news.
But there’s another much simpler explanation: The stock market experiences a lot of down-days. In fact, prices have fallen on 47% of trading days. And most business news outlets cover the stock market daily.
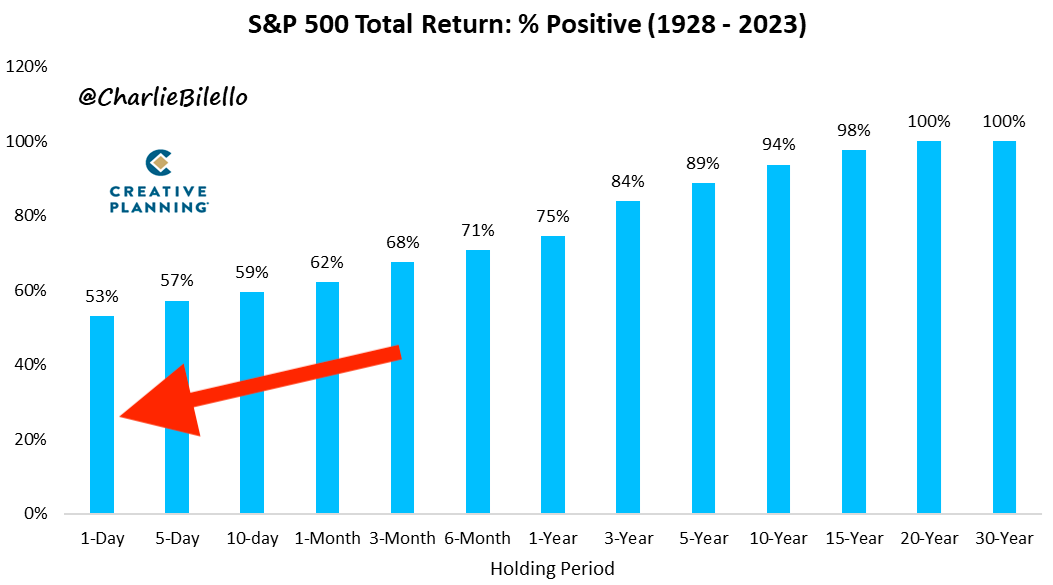
The lesson: The odds of stock prices falling increases when you shorten your timeframe. That’s why daily coverage of the stock market tends to skew negatively.
For more, read: The stat explaining why the stock market gets so much negative news coverage 📺
9. Simple explanations aren’t always the correct ones
Consider the impact of rising interest rates. Rising rates are bad, right?
Not if most of your debt is fixed rate and you have cash earning interest income at variable rates. Indeed, many businesses and households saw their net interest expenses fall in recent years as interest rates rose.
The lesson: Most developments come with both positive and negative effects. The balance of those effects isn’t always intuitive.
For more, read: The simplest explanation isn’t always the correct or complete one 😵💫
The big picture 🖼️
Investing is complicated, especially as investors are bombarded with information non-stop.
There really are no shortcuts in investing. At the very least, we should always seek context when confronted by new information. Helpful context includes other relevant current data as well as historical analogs.
More from TKer:
Review of the macro crosscurrents 🔀
There were a few notable data points and macroeconomic developments from last week to consider:
✂️ Fed cuts rates again, as expected. The Federal Reserve announced its third consecutive interest rate cut. On Wednesday, the Fed lowered its benchmark interest rate target range to 4.25% to 4.5%, down from 4.5% to 4.75%.
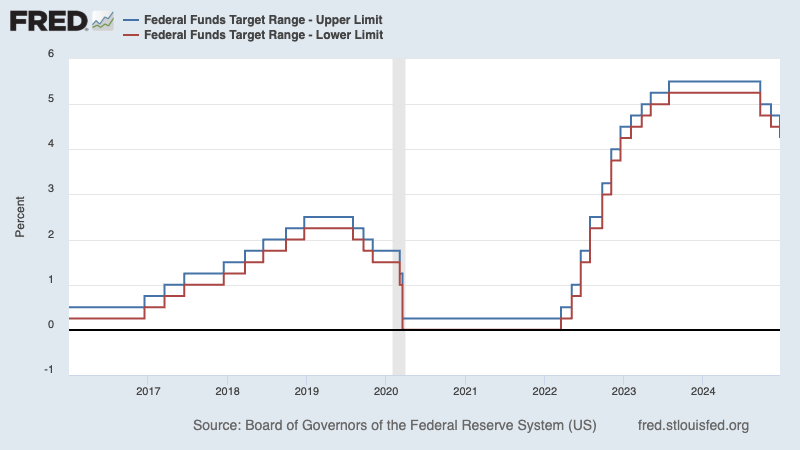
In its new Summary of Economic Projections, the Fed signaled it expected to cut rates just twice in 2025. It also raised its forecast for price inflation in 2025 and 2026. These changes are seen as hawkish moves by the central bank.
As we’ve been discussing for most of this year, I think this whole matter of rate cuts is not that big of a deal. Yes, monetary policy matters, and it can move the needle on the economy. But monetary policy decisions are much more consequential, market-moving events during times of stress or crisis in the markets or the economy.
Read more about my argument here, here, here, here, and here.
🎈 Inflation trends are cool. The personal consumption expenditures (PCE) price index in November was up 2.4% from a year ago, up from October’s 2.3% rate. The core PCE price index — the Federal Reserve’s preferred measure of inflation — was up 2.8% during the month, near its lowest level since March 2021.
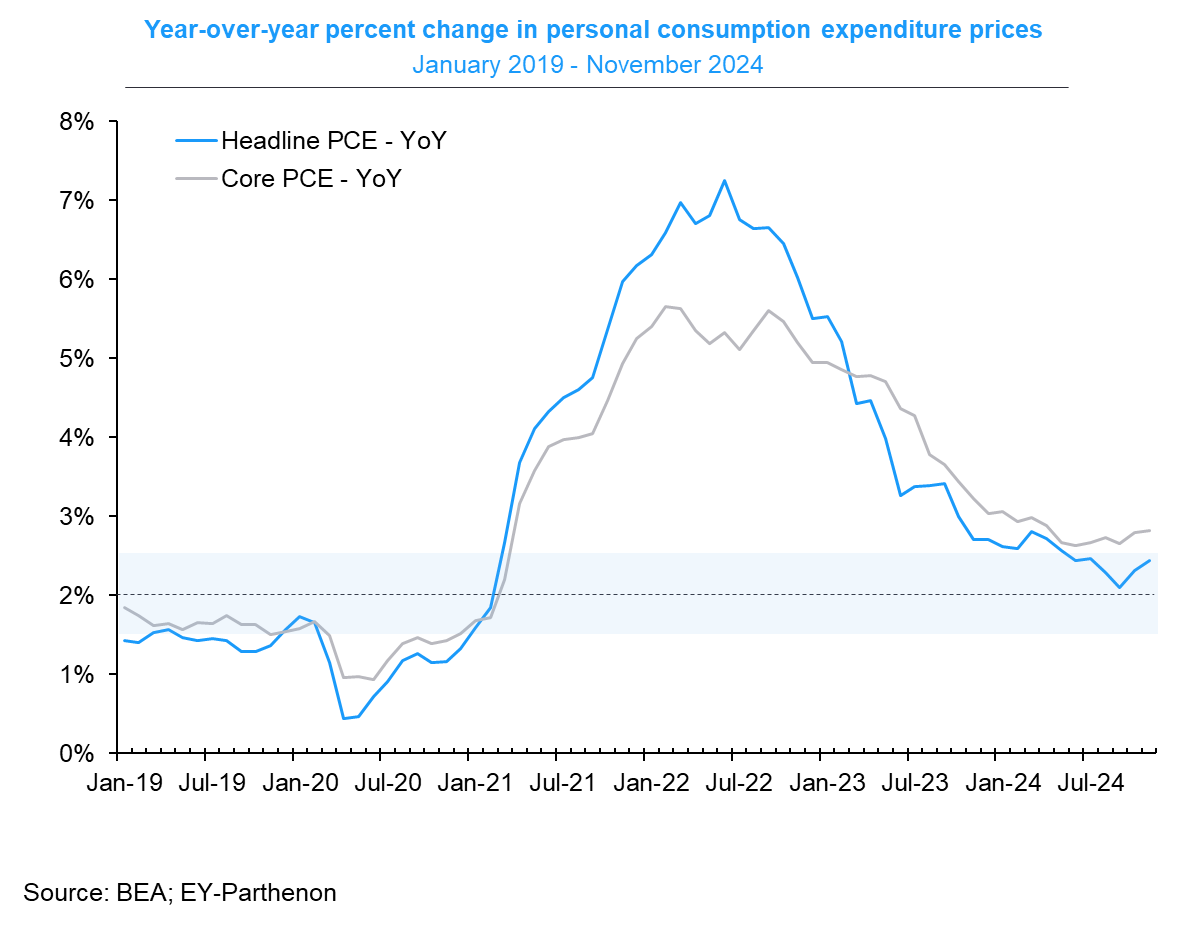
On a month over month basis, the core PCE price index was up 0.1%. If you annualized the rolling three-month and six-month figures, the core PCE price index was up 2.5% and 2.4%, respectively.
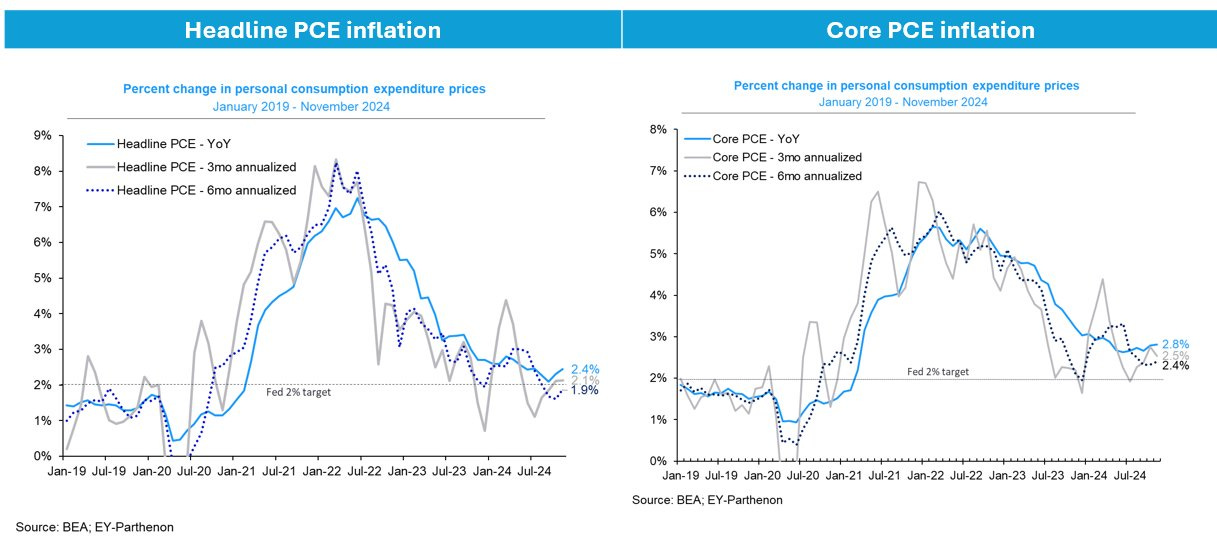
Inflation rates continue to hover near the Federal Reserve’s target rate of 2%, which has given the central bank the flexibility to cut rates as it addresses other developing issues in the economy.
For more on inflation and the outlook for monetary policy, read: The Fed closes a chapter with a rate cut ✂️ and The other side of the Fed’s inflation ‘mistake’ 🧐
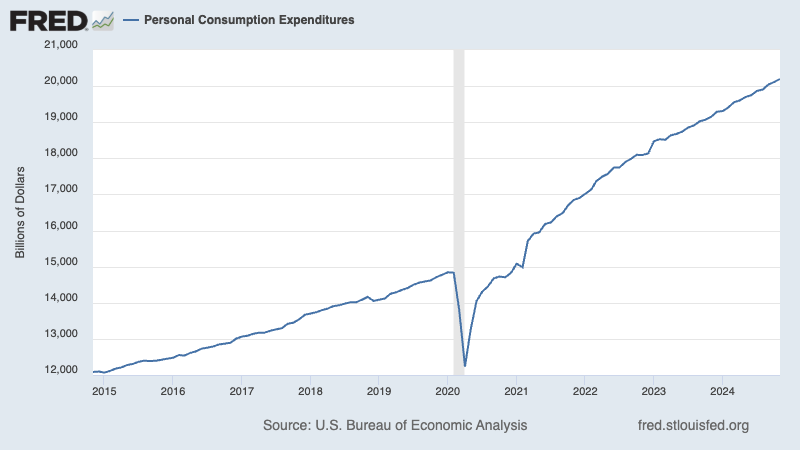
🛍️ Consumers are spending. According to BEA data, personal consumption expenditures increased 0.4% month over month in November to a record annual rate of $20.2 trillion.
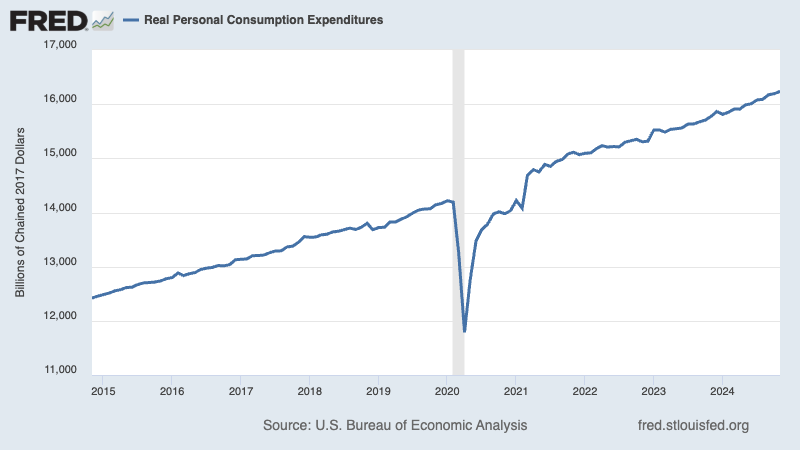
Adjusted for inflation, real personal consumption expenditures rose by 0.3%.
For more on resilient spending, read: The state of the American consumer in a single quote 🔊 and Americans have money, and they plan to spend it during the holidays 🎁
🛍️ Shopping rises to new record level. Retail sales increased 0.7% in November to a record $724.6 billion.
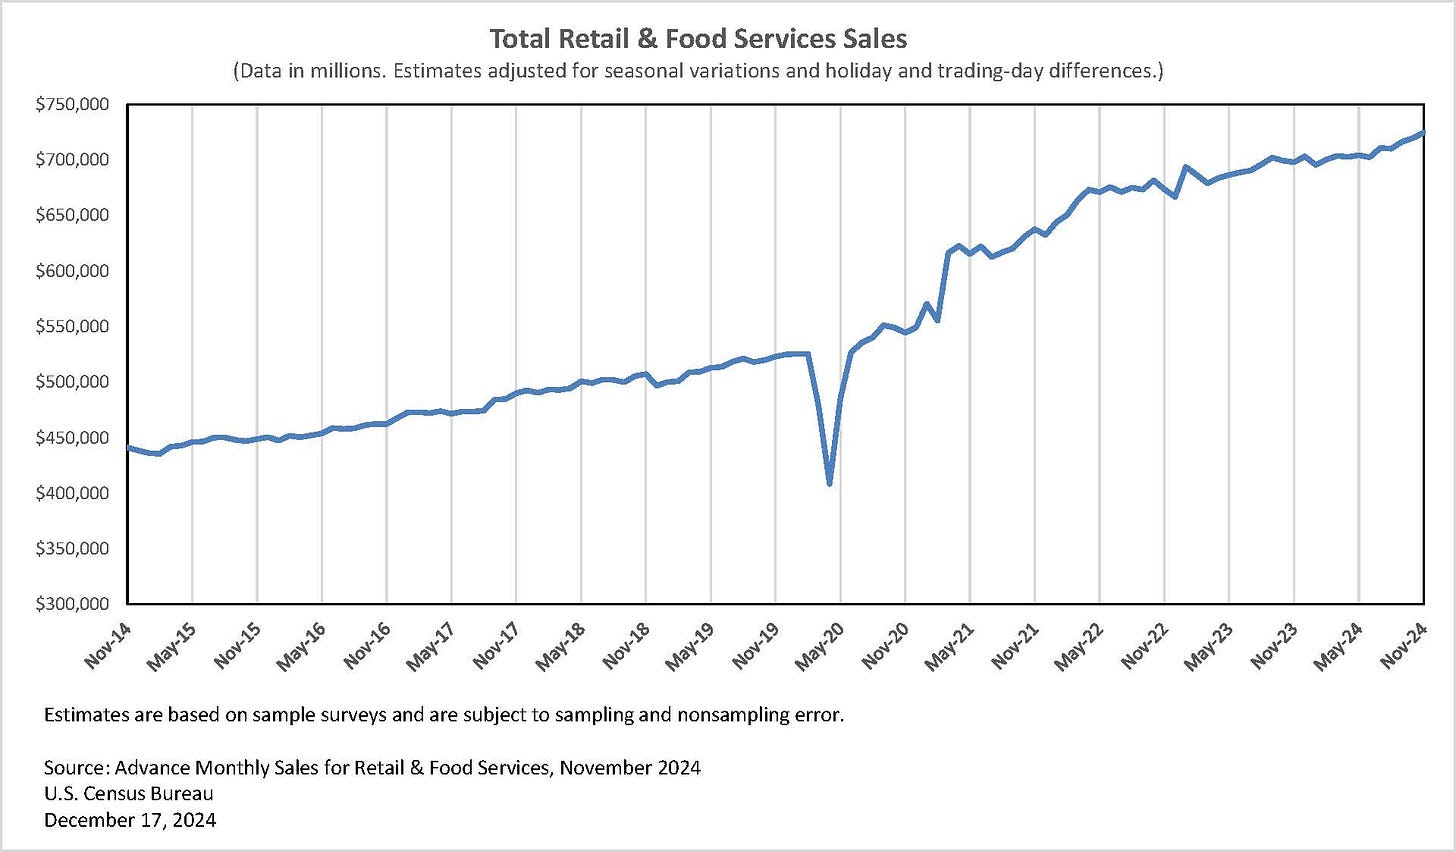
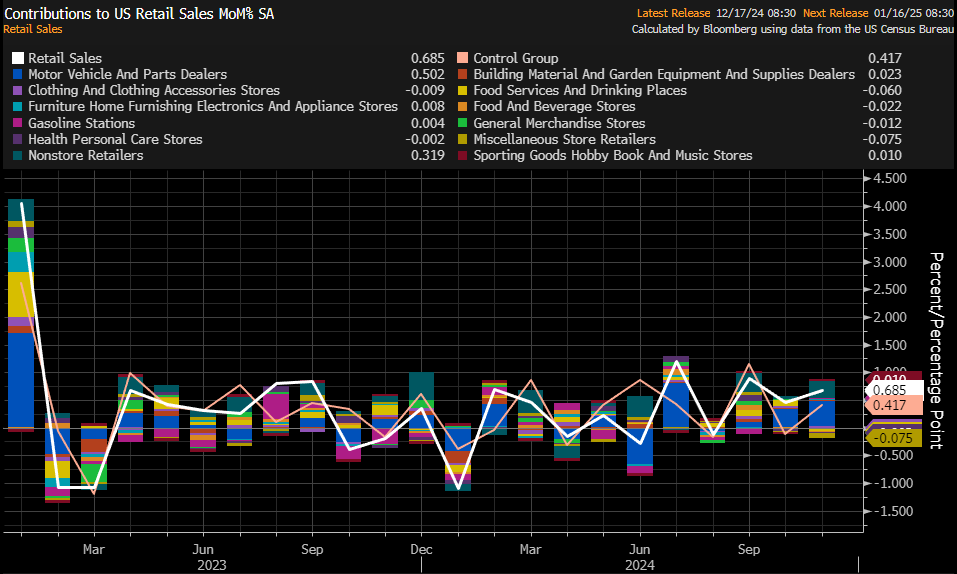
Growth was led by cars and parts, online shopping, sporting goods, and building materials. Clothes and grocery saw modest declines.
For more on the consumer, read: The state of the American consumer in a single quote 🔊 and Americans have money, and they plan to spend it during the holidays 🎁
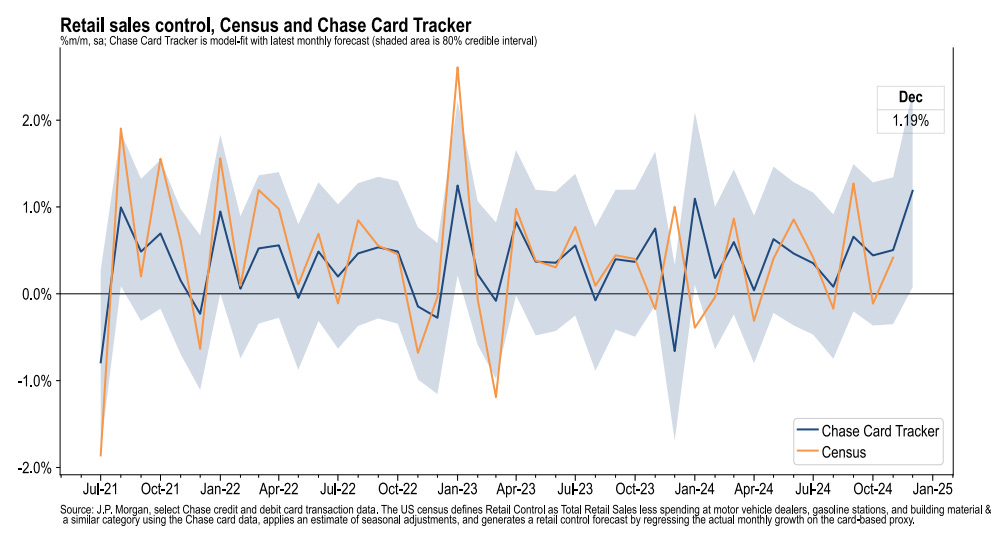
💳 Card spending data is holding up. From JPMorgan: “As of 10 Dec 2024, our Chase Consumer Card spending data (unadjusted) was 8.0% above the same day last year. Based on the Chase Consumer Card data through 10 Dec 2024, our estimate of the US Census December control measure of retail sales m/m is 1.19%.”
For more on the consumer, read: Americans have money, and they plan to spend it during the holidays 🎁
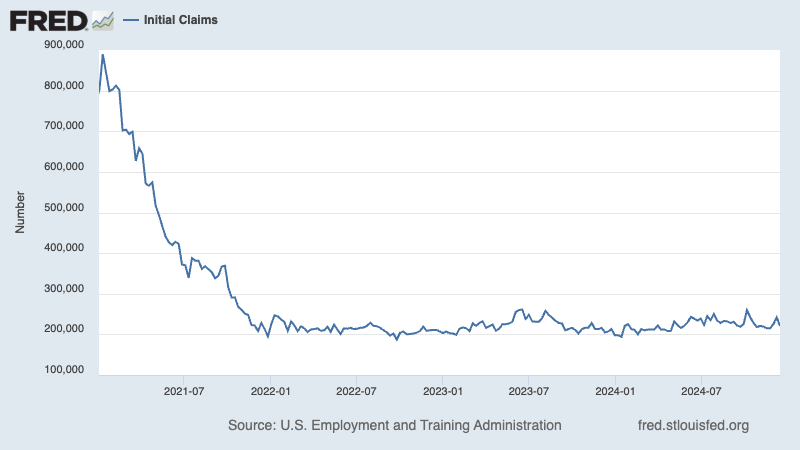
💼 Unemployment claims fall. Initial claims for unemployment benefits fell to 220,000 during the week ending December 14, down from 242,000 the week prior. This metric continues to be at levels historically associated with economic growth.
For more on the labor market, read: The labor market is cooling 💼
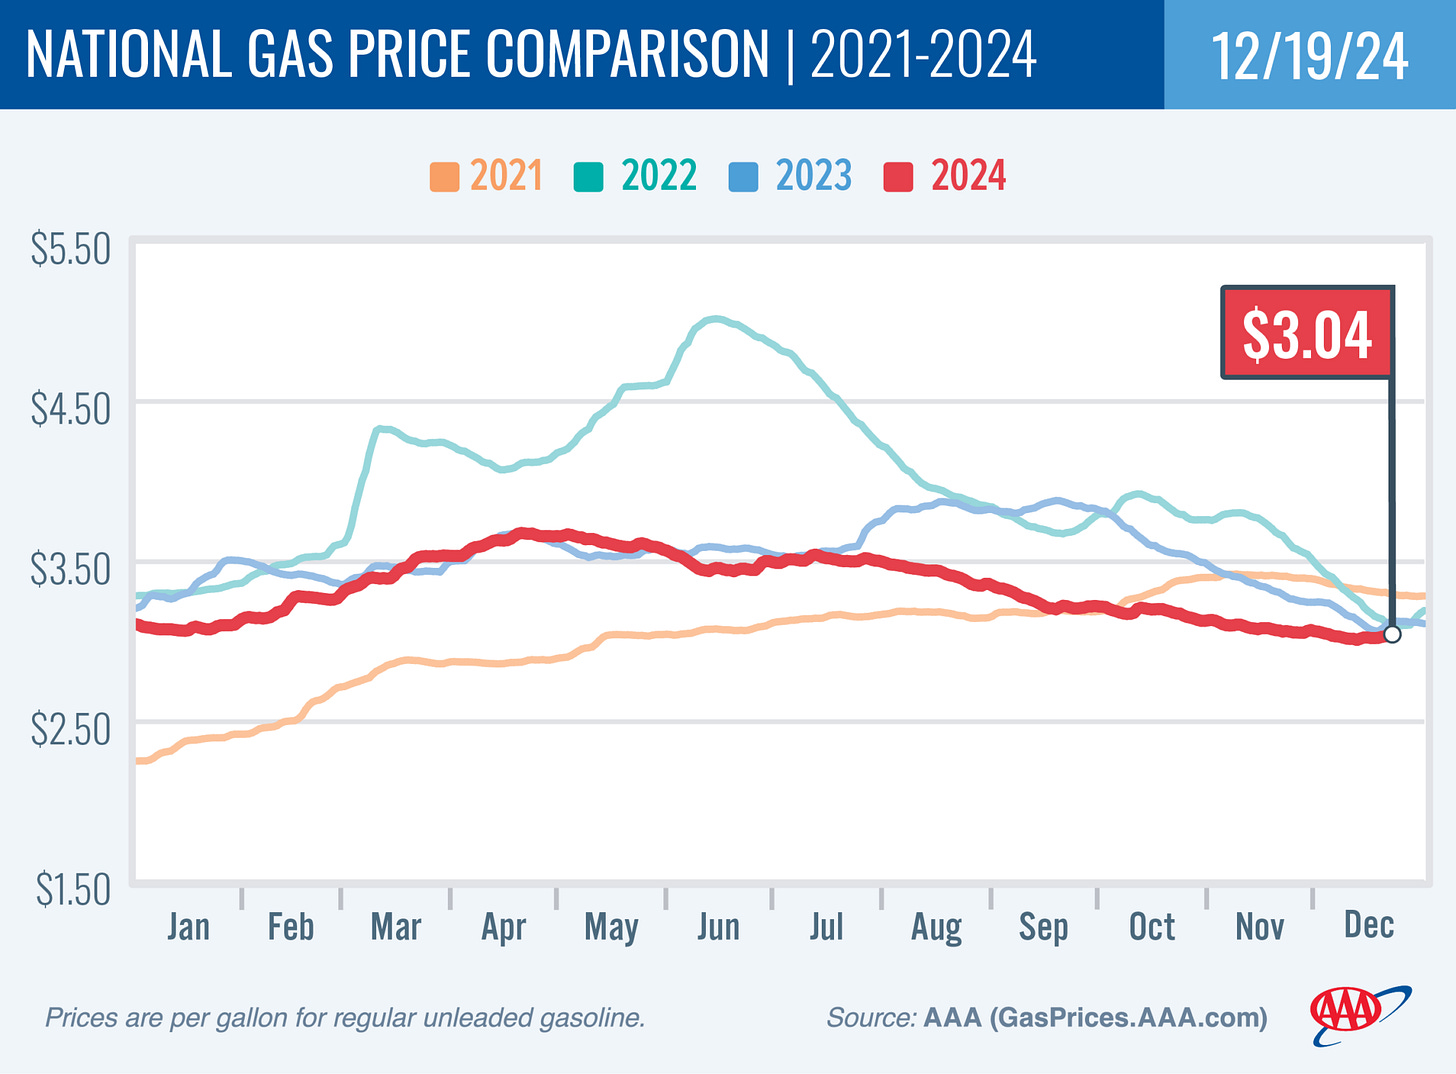
⛽️ Gas prices tick higher. From AAA: “After weeks of slowly marching lower, the national average for a gallon of gas reversed course, rising two cents since last week to $3.04. … According to new data from the Energy Information Administration (EIA), gasoline demand rose slightly from 8.81 million b/d last week to 8.92. Meanwhile, total domestic gasoline stocks rose from 219.7 million barrels to 222, while gasoline production decreased last week, averaging 9.9 million barrels daily.”
For more on energy prices, read: Higher oil prices meant something different in the past 🛢️
🏠 Mortgage rates tick higher. According to Freddie Mac, the average 30-year fixed-rate mortgage rose to 6.72%, up from 6.6% last week. From Freddie Mac: “This week, mortgage rates crept up to a similar average as this time in 2023. For the most part, mortgage rates have moved between 6 and 7 percent over the last 12 months. Homebuyers are slowly digesting these higher rates and are gradually willing to move forward with buying a home, resulting in additional purchase activity.”

There are 147 million housing units in the U.S., of which 86.6 million are owner-occupied and 34 million (or 40%) of which are mortgage-free. Of those carrying mortgage debt, almost all have fixed-rate mortgages, and most of those mortgages have rates that were locked in before rates surged from 2021 lows. All of this is to say: Most homeowners are not particularly sensitive to movements in home prices or mortgage rates.
For more on mortgages and home prices, read: Why home prices and rents are creating all sorts of confusion about inflation 😖
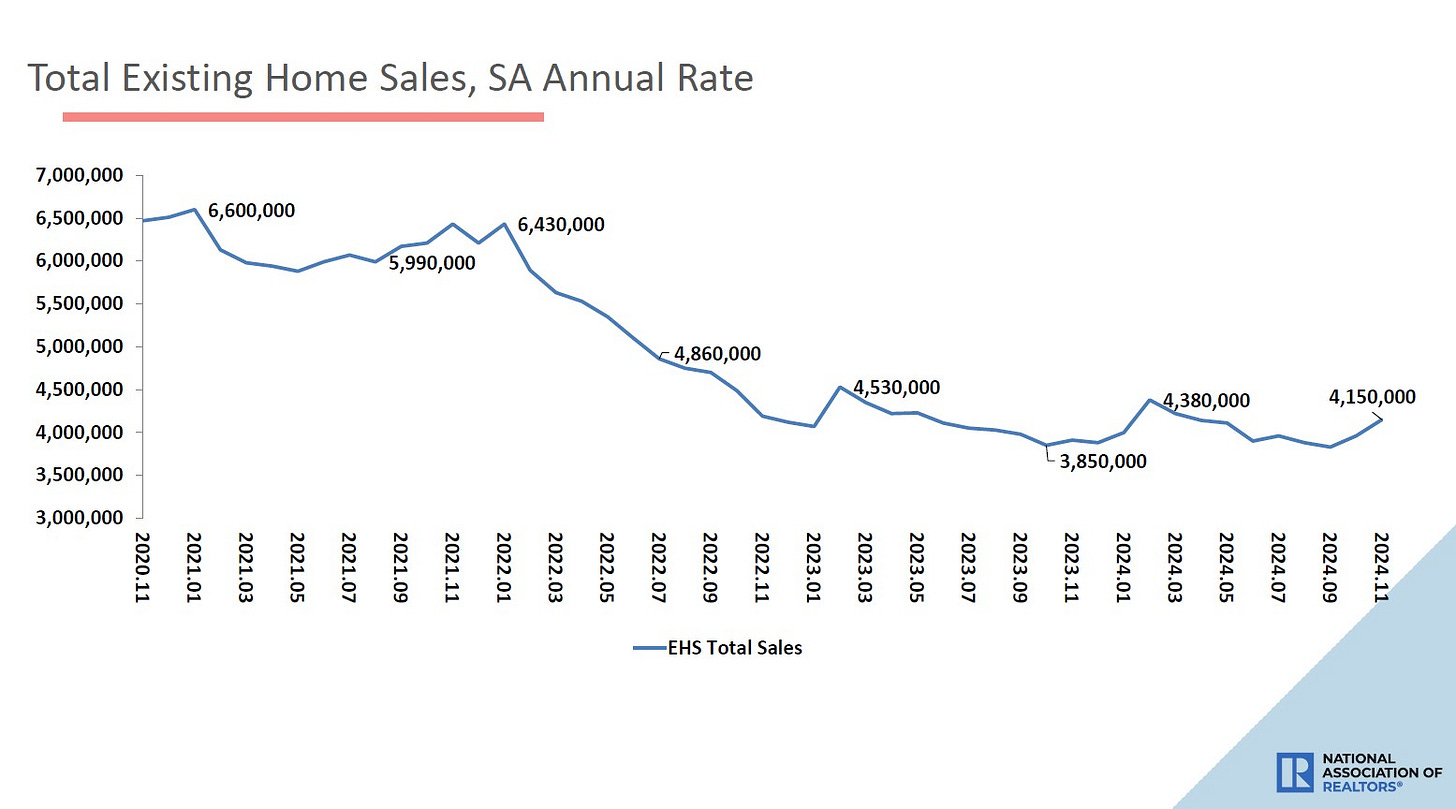
🏚 Home sales rise. Sales of previously owned homes increased by 4.8% in November to an annualized rate of 4.15 million units. From NAR chief economist Lawrence Yun: “Home sales momentum is building. More buyers have entered the market as the economy continues to add jobs, housing inventory grows compared to a year ago, and consumers get used to a new normal of mortgage rates between 6% and 7%.“
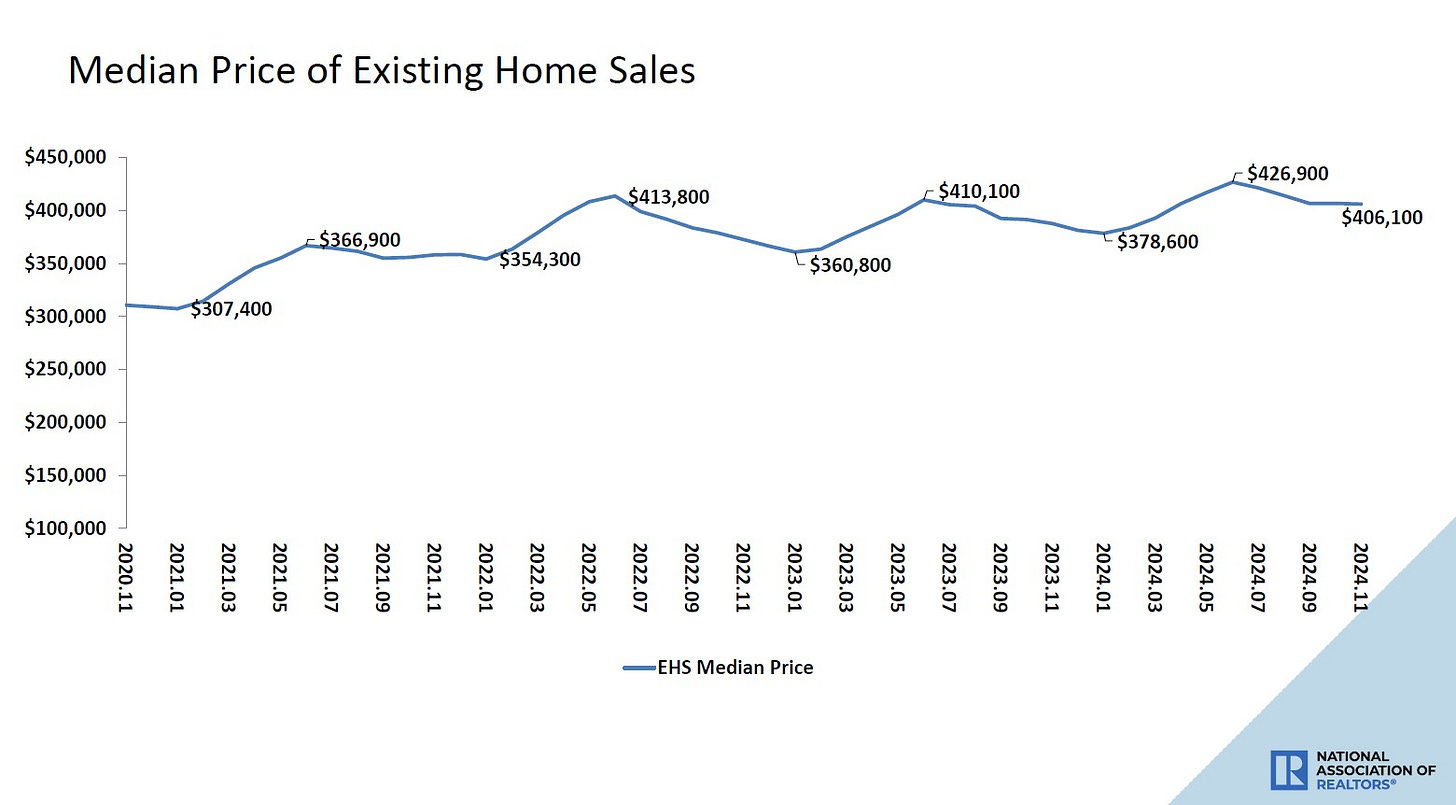
💸 Home prices rise. Prices for previously owned homes declined from last month’s levels but were above year ago levels. From the NAR: “The median existing-home price for all housing types in November was $406,100, up 4.7% from one year ago ($387,800). All four U.S. regions posted price increases.”
🏠 Homebuilder sentiment unchanged. From the NAHB’s Carl Harris: “While builders are expressing concerns that high interest rates, elevated construction costs and a lack of buildable lots continue to act as headwinds, they are also anticipating future regulatory relief in the aftermath of the election. This is reflected in the fact that future sales expectations have increased to a nearly three-year high.”

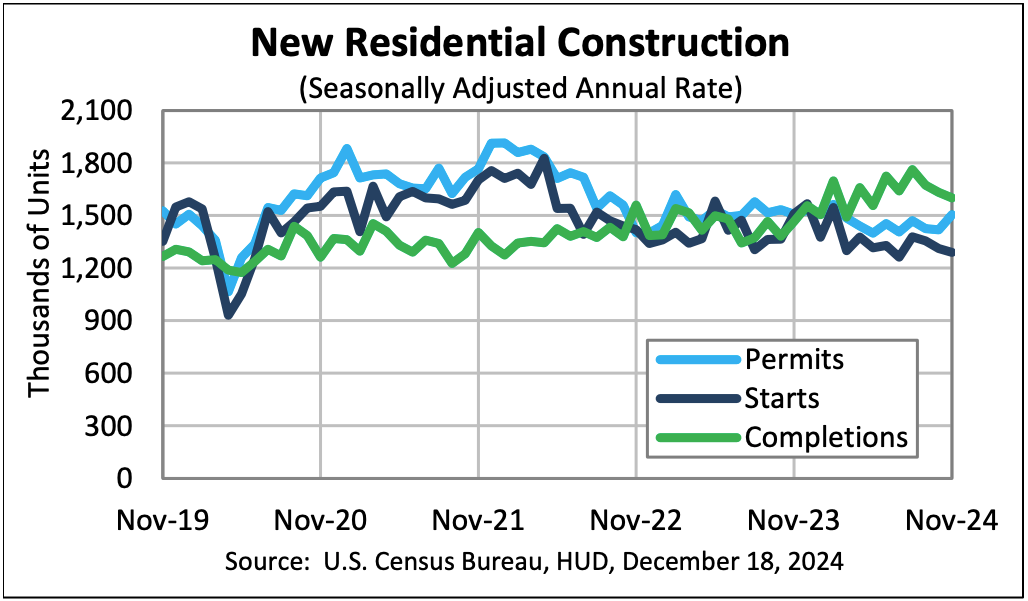
🔨 New home construction starts cool. Housing starts declined 1.8% in November to an annualized rate of 1.29 million units, according to the Census Bureau. Building permits fell 6.1% to an annualized rate of 1.42 million units.
🏢 Offices remain relatively empty. From Kastle Systems: “Peak day office occupancy hit a record high of 63.9% on Tuesday last week, up 2.6 points from the previous week and nearly a full point higher than the last record high of 63% in January. Philadelphia and San Jose reached record highs on Tuesday, at 52% and 58.8%, respectively. Austin became the first city to exceed 80% occupancy, reaching 80.3% on Wednesday. The average low was on Friday at 35.5%.”

For more on office occupancy, read: This stat about offices reminds us things are far from normal 🏢
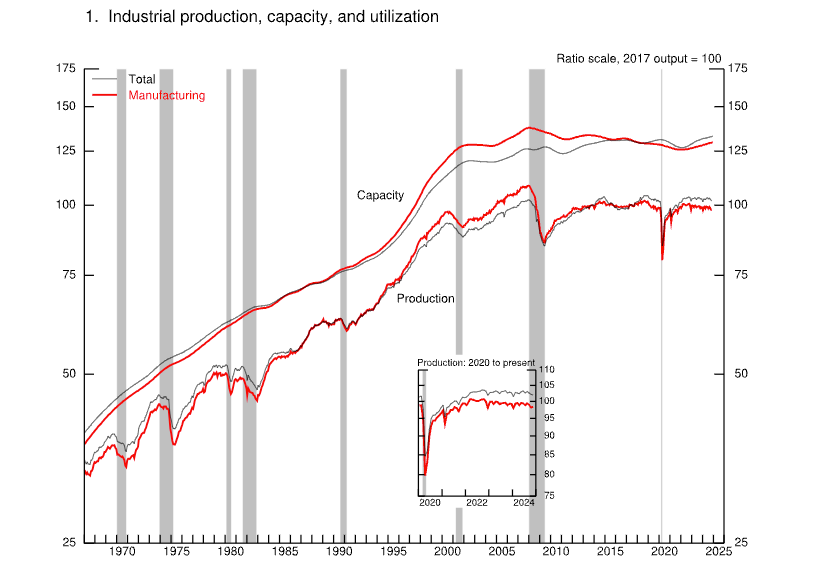
🛠️ Industrial activity ticks lower. Industrial production activity in November fell 0.1% from the prior month. Manufacturing output rose 0.2%.
For more on economic activity cooling, read: The US economy is now less ‘coiled’ 📈
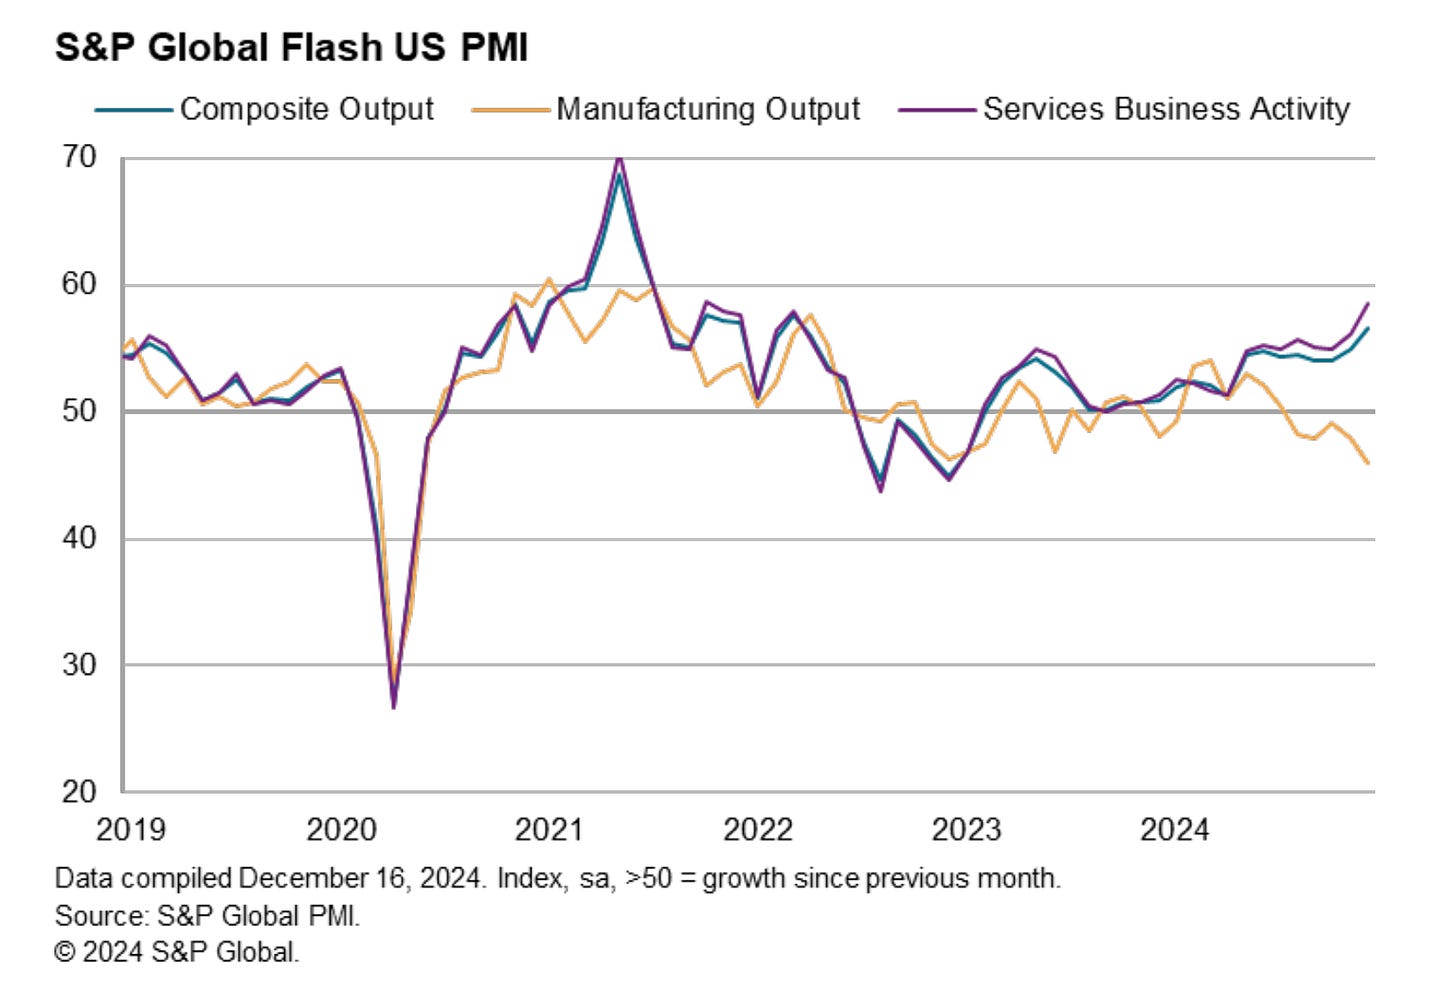
👍 Activity survey looks good. From S&P Global’s December U.S. PMI: “Business is booming in the US services economy, where output is growing at the sharpest rate since the reopening of the economy from COVID lockdowns in 2021. The service sector expansion is helping drive overall growth in the economy to its fastest for nearly three years, consistent with GDP rising at an annualized rate of just over 3% in December. It’s a different picture in manufacturing, however, where output is falling sharply and at an increased rate, in part due to weak export demand.”
Business execs are also bullish on 2025. From ISM: “Economic improvement in the United States will continue in 2025, say the nation’s purchasing and supply management executives in the December 2024 ISM Supply Chain Planning Forecast… Revenues are expected to increase in 17 of 18 manufacturing industries and 16 of 18 services-sector industries. Capital expenditures are expected to increase by 5.2% in the manufacturing sector (after a 5.6% increase in 2024) and increase by 5.1% in the services sector (after a 2.8 % increase in 2024). In 2025, employment is expected to grow by 0.8% in manufacturing and 0.8% in services. After projected growth in manufacturing and services in the first half (H1) of the year, growth in the second half (H2) is projected to accelerate in manufacturing and maintain momentum in the services sector.“
For more on business sentiment, read: The post-election sentiment sea change 🔃 and What businesses do > what businesses say 🙊
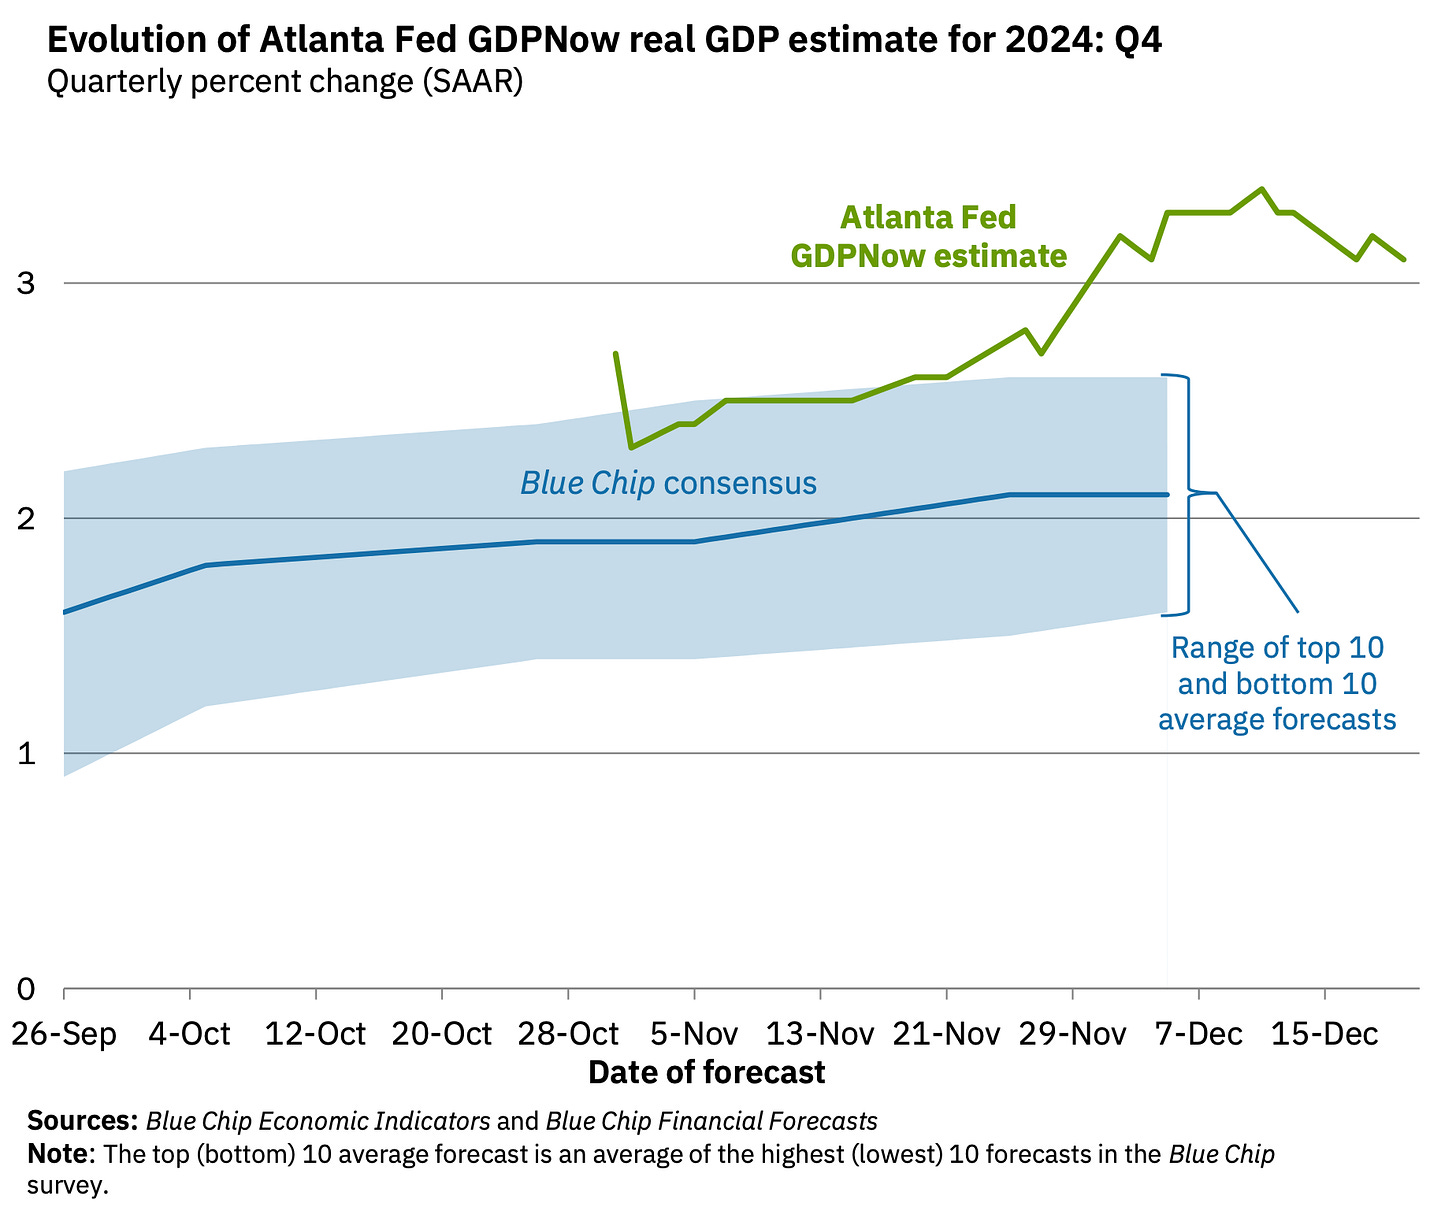
📈 Near-term GDP growth estimates remain positive. The Atlanta Fed’s GDPNow model sees real GDP growth climbing at a 3.1% rate in Q4.
For more on the economy, read: The US economy is now less ‘coiled’ 📈
Putting it all together 🤔
The long-term outlook for the stock market remains favorable, bolstered by expectations for years of earnings growth. And earnings are the most important driver of stock prices.
Demand for goods and services is positive, and the economy continues to grow. At the same time, economic growth has normalized from much hotter levels earlier in the cycle. The economy is less “coiled” these days as major tailwinds like excess job openings have faded.
To be clear: The economy remains very healthy, supported by strong consumer and business balance sheets. Job creation remains positive. And the Federal Reserve — having resolved the inflation crisis — has shifted its focus toward supporting the labor market.
We are in an odd period given that the hard economic data has decoupled from the soft sentiment-oriented data. Consumer and business sentiment has been relatively poor, even as tangible consumer and business activity continue to grow and trend at record levels. From an investor’s perspective, what matters is that the hard economic data continues to hold up.
Analysts expect the U.S. stock market could outperform the U.S. economy, thanks largely due to positive operating leverage. Since the pandemic, companies have adjusted their cost structures aggressively. This has come with strategic layoffs and investment in new equipment, including hardware powered by AI. These moves are resulting in positive operating leverage, which means a modest amount of sales growth — in the cooling economy — is translating to robust earnings growth.
Of course, this does not mean we should get complacent. There will always be risks to worry about — such as U.S. political uncertainty, geopolitical turmoil, energy price volatility, cyber attacks, etc. There are also the dreaded unknowns. Any of these risks can flare up and spark short-term volatility in the markets.
There’s also the harsh reality that economic recessions and bear markets are developments that all long-term investors should expect to experience as they build wealth in the markets. Always keep your stock market seat belts fastened.
For now, there’s no reason to believe there’ll be a challenge that the economy and the markets won’t be able to overcome over time. The long game remains undefeated, and it’s a streak long-term investors can expect to continue.
For more on how the macro story is evolving, check out the the previous TKer macro crosscurrents »
Key insights about the stock market 📈
Here’s a roundup of some of TKer’s most talked-about paid and free newsletters about the stock market. All of the headlines are hyperlinked to the archived pieces.
10 truths about the stock market 📈
The stock market can be an intimidating place: It’s real money on the line, there’s an overwhelming amount of information, and people have lost fortunes in it very quickly. But it’s also a place where thoughtful investors have long accumulated a lot of wealth. The primary difference between those two outlooks is related to misconceptions about the stock market that can lead people to make poor investment decisions.
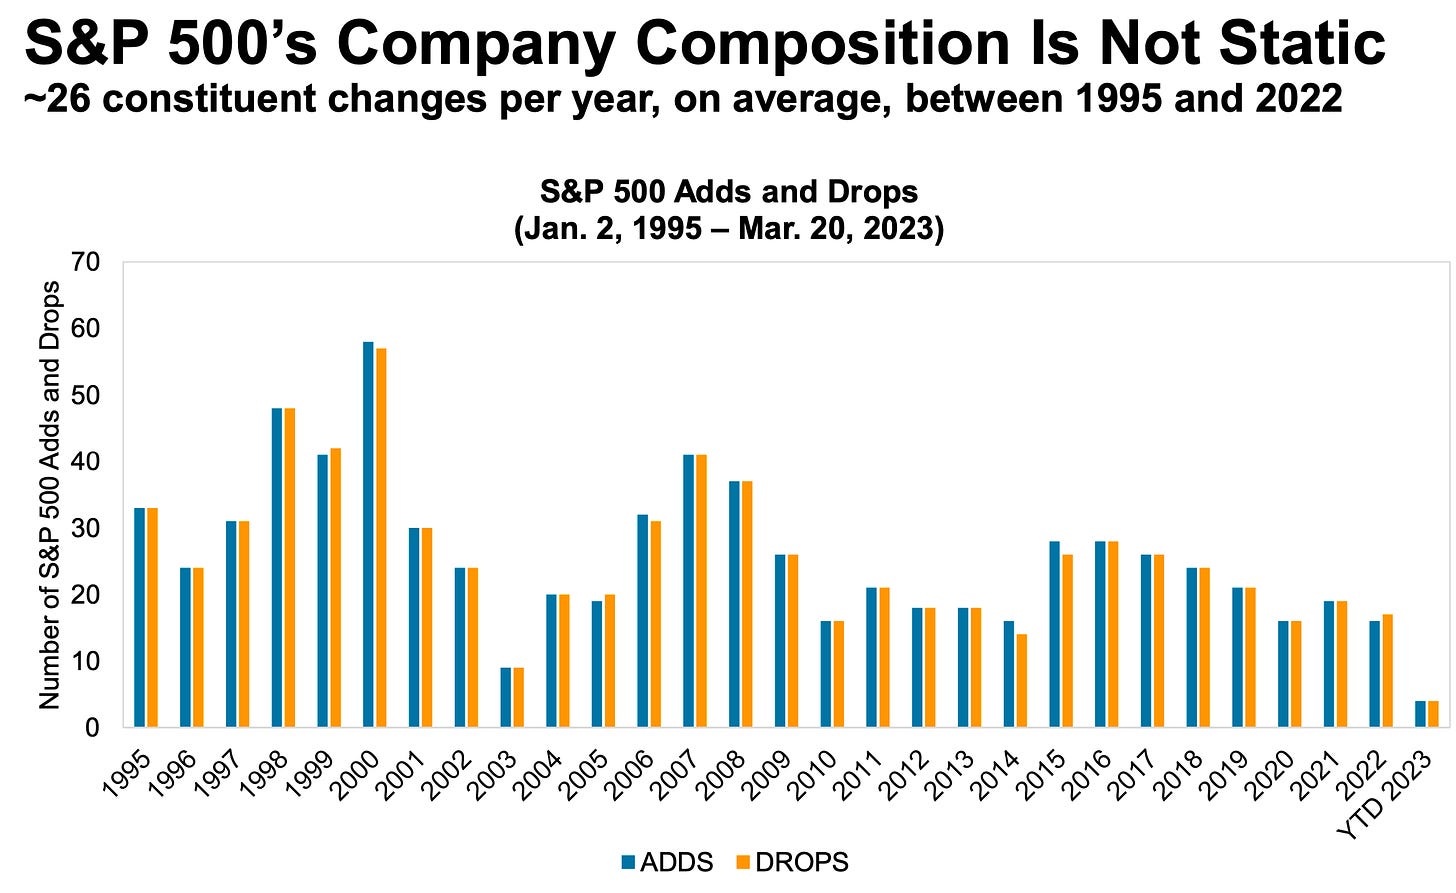
The makeup of the S&P 500 is constantly changing 🔀
Passive investing is a concept usually associated with buying and holding a fund that tracks an index. And no passive investment strategy has attracted as much attention as buying an S&P 500 index fund. However, the S&P 500 — an index of 500 of the largest U.S. companies — is anything but a static set of 500 stocks.
The key driver of stock prices: Earnings💰
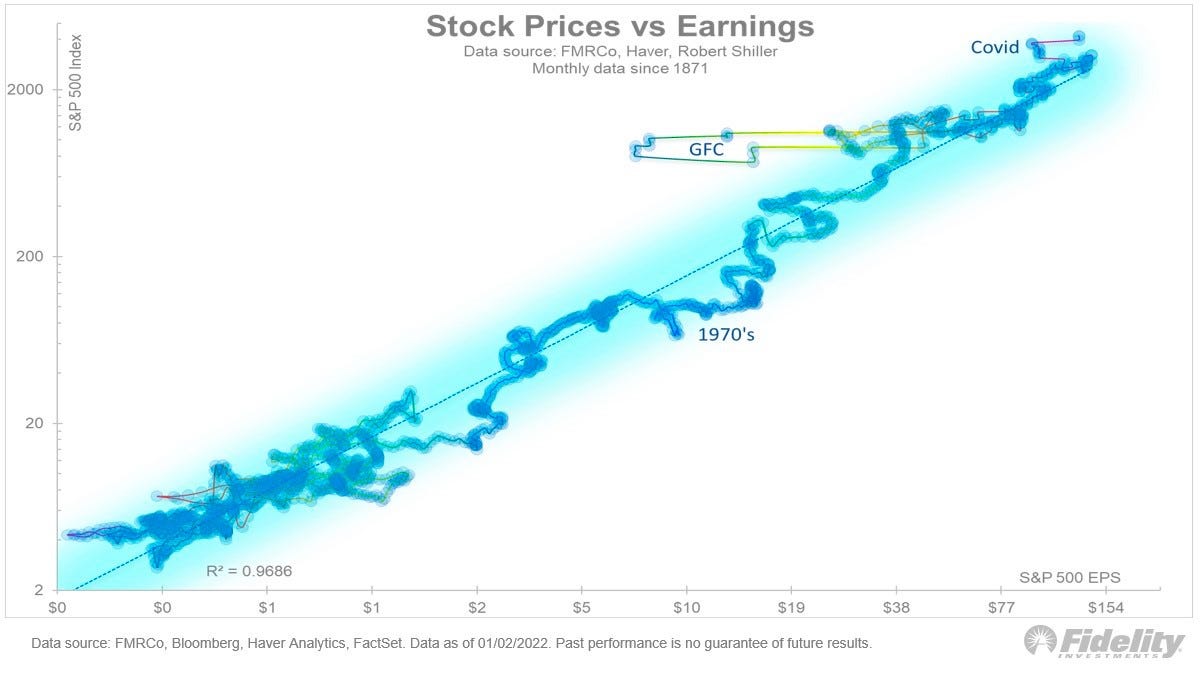
For investors, anything you can ever learn about a company matters only if it also tells you something about earnings. That’s because long-term moves in a stock can ultimately be explained by the underlying company’s earnings, expectations for earnings, and uncertainty about those expectations for earnings. Over time, the relationship between stock prices and earnings have a very tight statistical relationship.
Stomach-churning stock market sell-offs are normal🎢
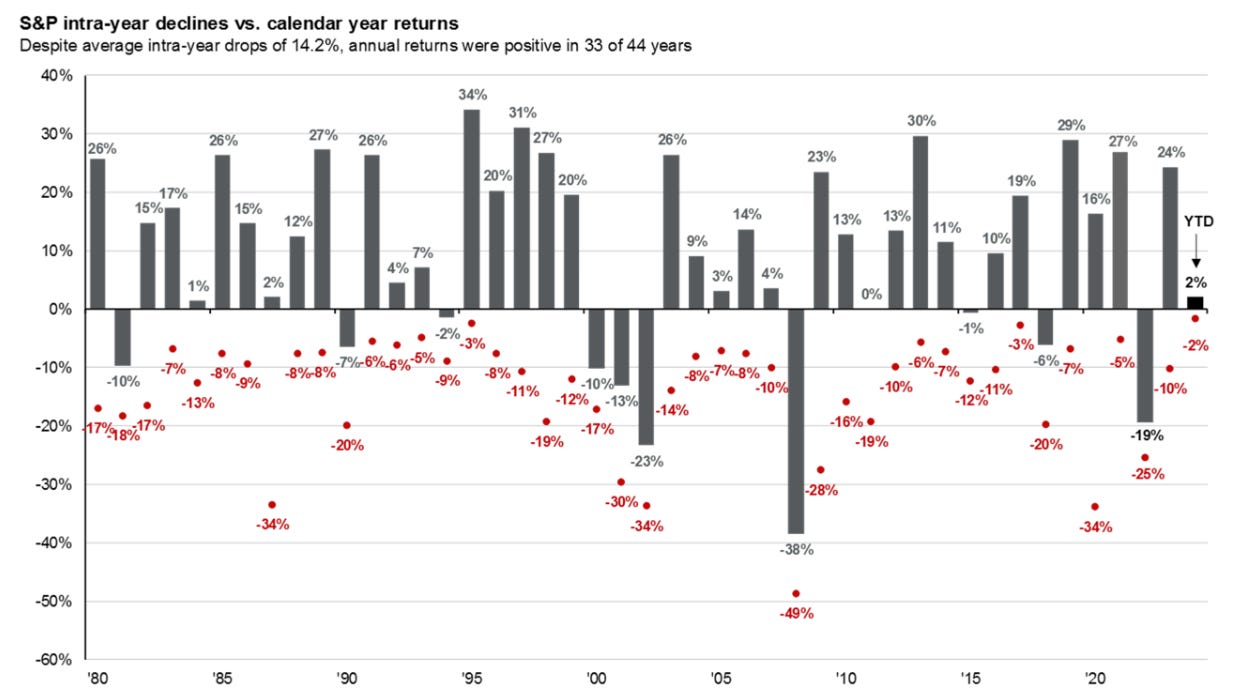
Investors should always be mentally prepared for some big sell-offs in the stock market. It’s part of the deal when you invest in an asset class that is sensitive to the constant flow of good and bad news. Since 1950, the S&P 500 has seen an average annual max drawdown (i.e., the biggest intra-year sell-off) of 14%.
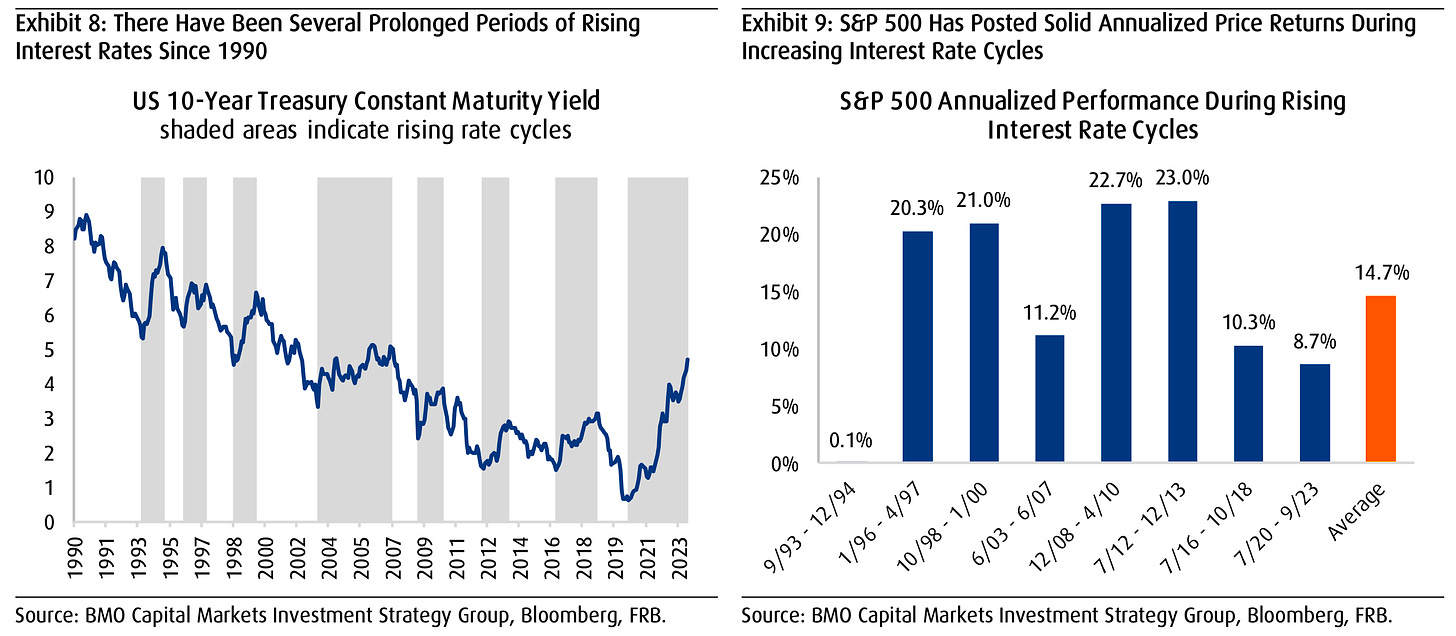
High and rising interest rates don’t spell doom for stocks👍
Generally speaking, rising interest rates are not welcome news for the economy and the stock market. They represent higher financing costs for businesses and consumers. All other things being equal, rising rates represent a hindrance to growth. However, the world is complicated, and this narrative comes with a lot of nuance. One big counterintuitive piece to this narrative is that historically, stocks have actually performed well during periods of rising interest rates.
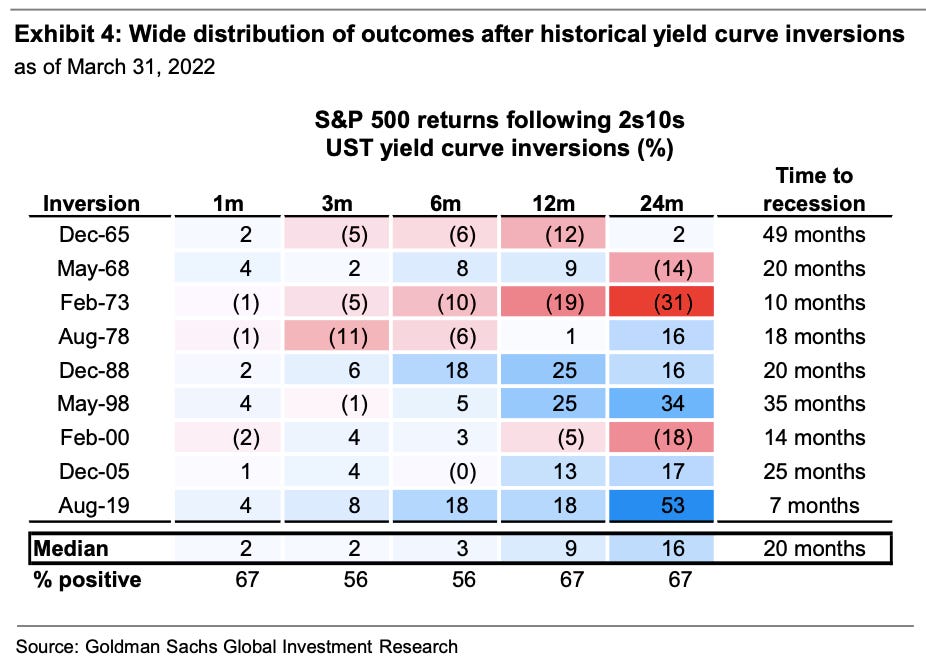
How stocks performed when the yield curve inverted ⚠️
There’ve been lots of talk about the “yield curve inversion,” with media outlets playing up that this bond market phenomenon may be signaling a recession. Admittedly, yield curve inversions have a pretty good track record of being followed by recessions, and recessions usually come with significant market sell-offs. But experts also caution against concluding that inverted yield curves are bulletproof leading indicators.
How the stock market performed around recessions 📉📈
Every recession in history was different. And the range of stock performance around them varied greatly. There are two things worth noting. First, recessions have always been accompanied by a significant drawdown in stock prices. Second, the stock market bottomed and inflected upward long before recessions ended.

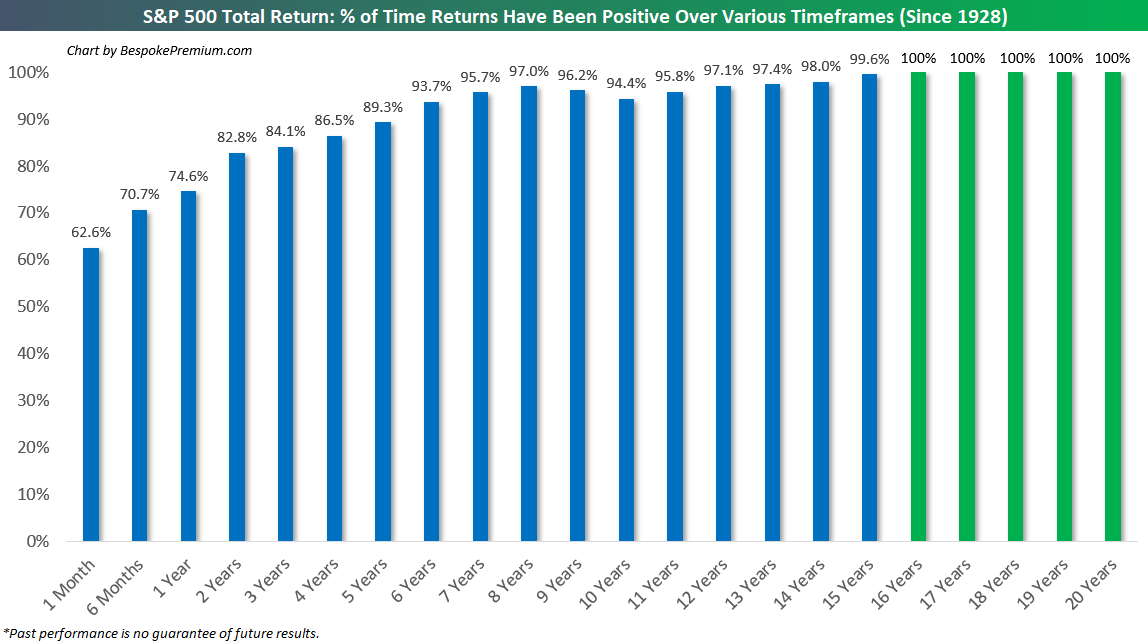
In the stock market, time pays ⏳
Since 1928, the S&P 500 generated a positive total return more than 89% of the time over all five-year periods. Those are pretty good odds. When you extend the timeframe to 20 years, you’ll see that there’s never been a period where the S&P 500 didn’t generate a positive return.
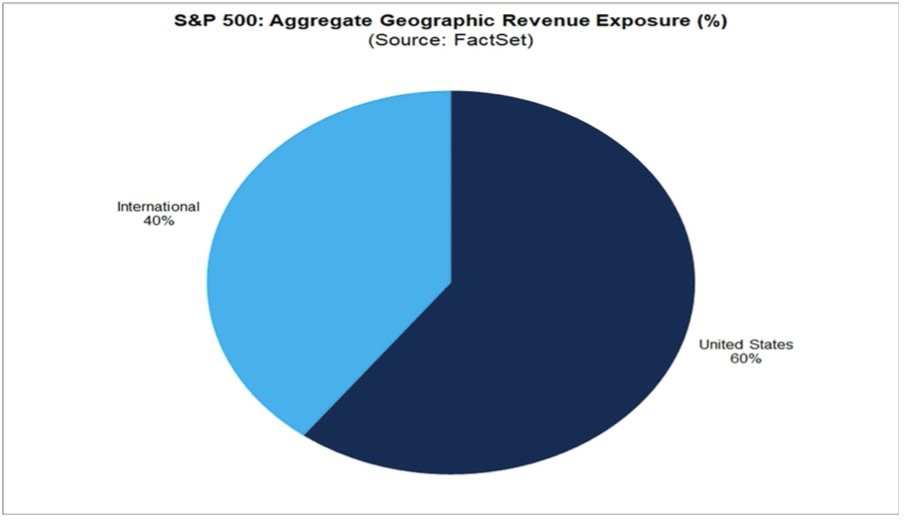
What a strong dollar means for stocks 👑
While a strong dollar may be great news for Americans vacationing abroad and U.S. businesses importing goods from overseas, it’s a headwind for multinational U.S.-based corporations doing business in non-U.S. markets.
Economy ≠ Stock Market 🤷♂️
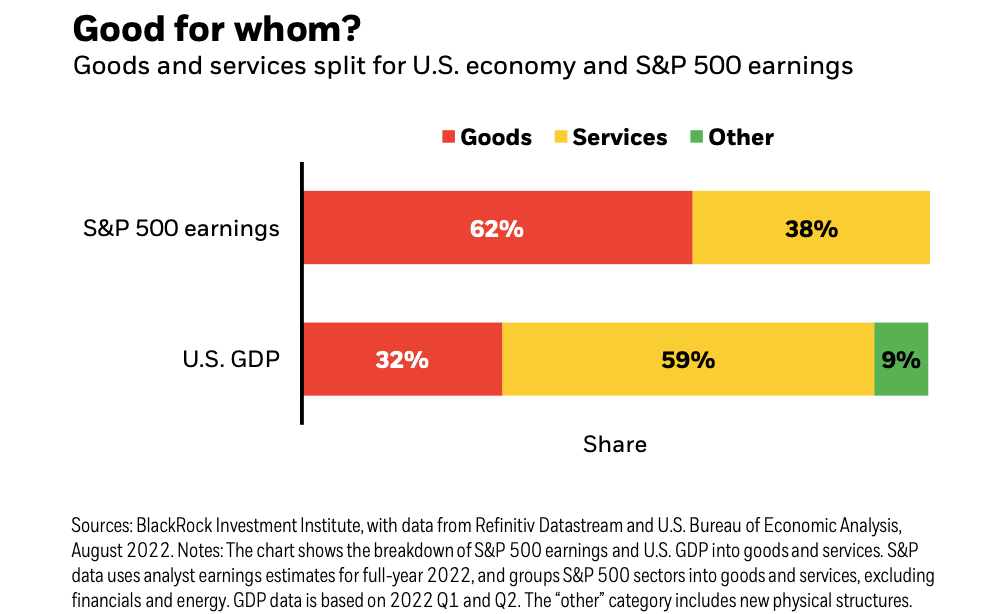
The stock market sorta reflects the economy. But also, not really. The S&P 500 is more about the manufacture and sale of goods. U.S. GDP is more about providing services.
Stanley Druckenmiller’s No. 1 piece of advice for novice investors 🧐
…you don’t want to buy them when earnings are great, because what are they doing when their earnings are great? They go out and expand capacity. Three or four years later, there’s overcapacity and they’re losing money. What about when they’re losing money? Well, then they’ve stopped building capacity. So three or four years later, capacity will have shrunk and their profit margins will be way up. So, you always have to sort of imagine the world the way it’s going to be in 18 to 24 months as opposed to now. If you buy it now, you’re buying into every single fad every single moment. Whereas if you envision the future, you’re trying to imagine how that might be reflected differently in security prices.
Peter Lynch made a remarkably prescient market observation in 1994 🎯
Some event will come out of left field, and the market will go down, or the market will go up. Volatility will occur. Markets will continue to have these ups and downs. … Basic corporate profits have grown about 8% a year historically. So, corporate profits double about every nine years. The stock market ought to double about every nine years… The next 500 points, the next 600 points — I don’t know which way they’ll go… They’ll double again in eight or nine years after that. Because profits go up 8% a year, and stocks will follow. That’s all there is to it.
Warren Buffett’s ‘fourth law of motion’ 📉
Long ago, Sir Isaac Newton gave us three laws of motion, which were the work of genius. But Sir Isaac’s talents didn’t extend to investing: He lost a bundle in the South Sea Bubble, explaining later, “I can calculate the movement of the stars, but not the madness of men.” If he had not been traumatized by this loss, Sir Isaac might well have gone on to discover the Fourth Law of Motion: For investors as a whole, returns decrease as motion increases.
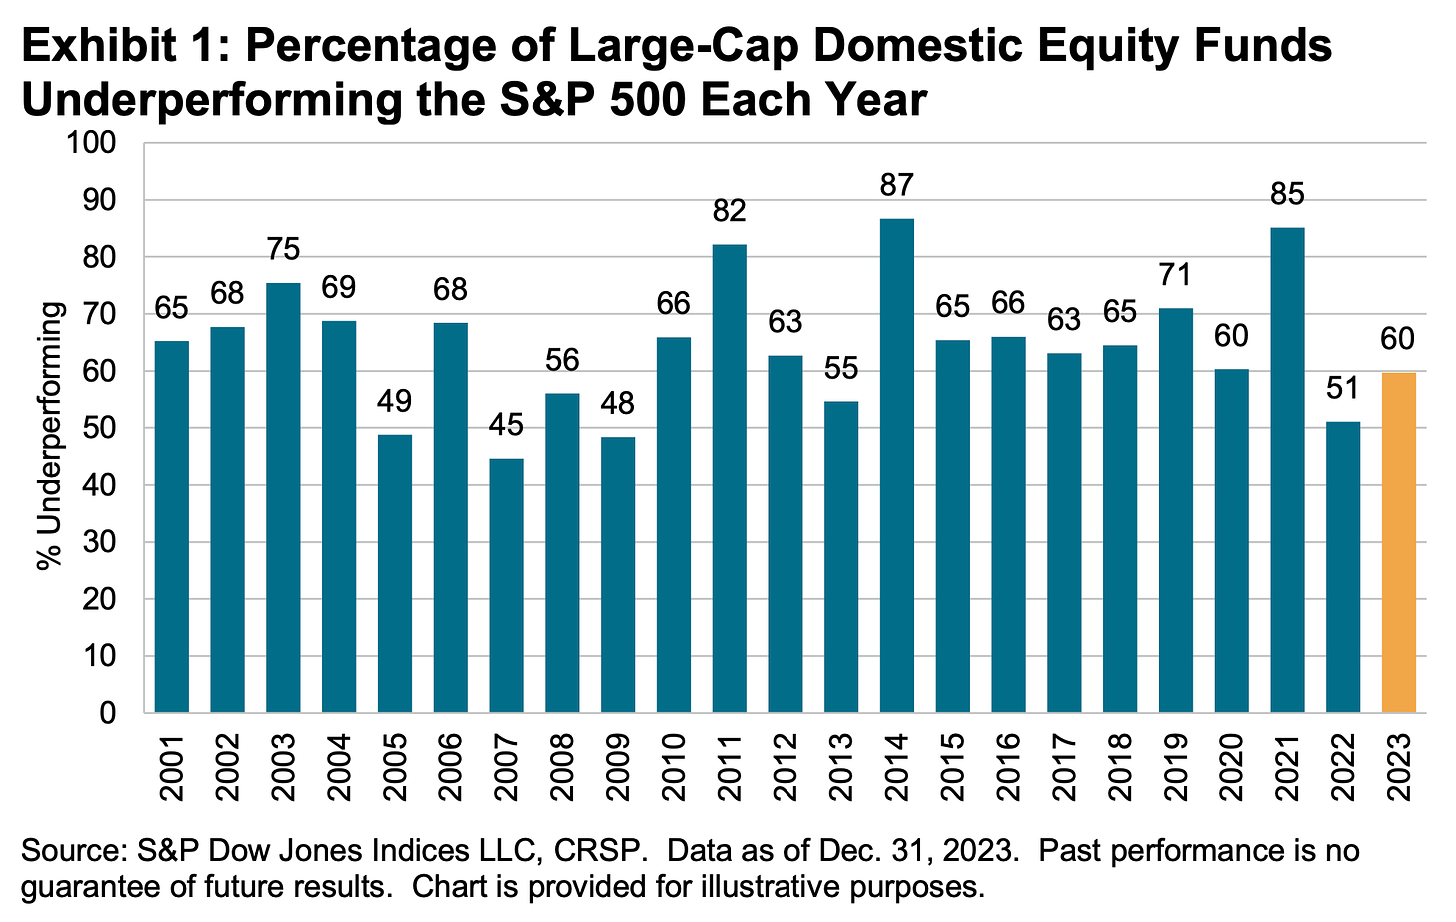
Most pros can’t beat the market 🥊
According to S&P Dow Jones Indices (SPDJI), 59.7% of U.S. large-cap equity fund managers underperformed the S&P 500 in 2023. As you stretch the time horizon, the numbers get even more dismal. Over a three-year period, 79.8% underperformed. Over a 10-year period, 87.4% underperformed. And over a 20-year period, 93% underperformed. This 2023 performance follows 13 consecutive years in which the majority of fund managers in this category have lagged the index.
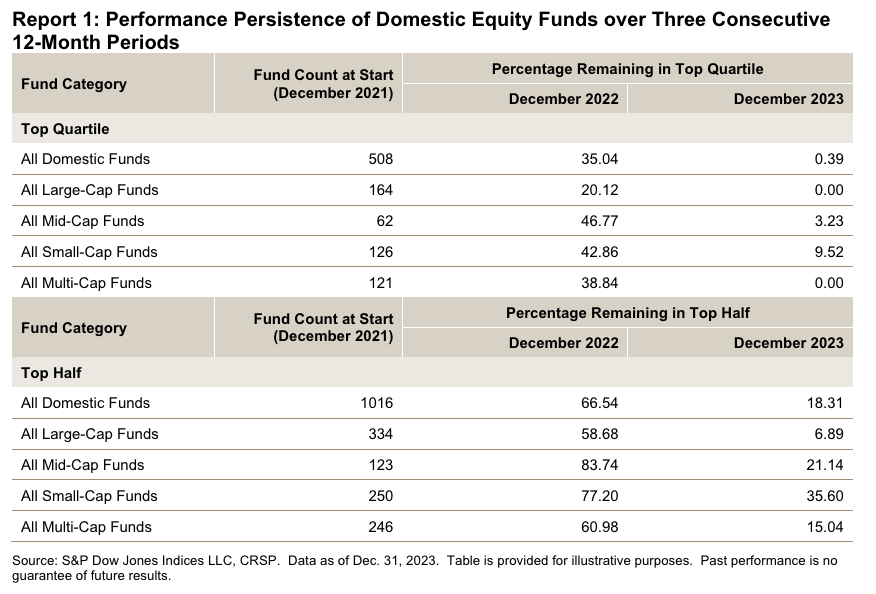
Proof that ‘past performance is no guarantee of future results’ 📊
S&P Dow Jones Indices found that funds beat their benchmark in a given year are rarely able to continue outperforming in subsequent years. For example, 334 large-cap equity funds were in the top half of performance in 2021. Of those funds, 58.7% came in the top half again in 2022. But just 6.9% were able to extend that streak through 2023. If you set the bar even higher and consider those in the top quartile of performance, just 20.1% of 164 large-cap funds remained in the top quartile in 2022. No large-cap funds were able to stay in the top quartile for the three consecutive years ending in 2023.
The odds are stacked against stock pickers 🎲
Picking stocks in an attempt to beat market averages is an incredibly challenging and sometimes money-losing effort. In fact, most professional stock pickers aren’t able to do this on a consistent basis. One of the reasons for this is that most stocks don’t deliver above-average returns. According to S&P Dow Jones Indices, only 24% of the stocks in the S&P 500 outperformed the average stock’s return from 2000 to 2022. Over this period, the average return on an S&P 500 stock was 390%, while the median stock rose by just 93%.


