$35,858.
We took a big $2,429 hit since our last Dec 10th Review as the Russell dropped 4.7% (we have mostly small caps) and the VIX rose 20%, giving us unfavorable LOOKING relationships on the premiums we sold.
Not every month is going to be a winner and the key is how we make adjustments along the way – so we’ll be looking at each position very carefully this month. Our $700 Portfolio follows a very simple concept of investing $700 every month (10% of the average family’s income) and then finding the optimal mix of positions to give us good long-term return that will grow our nest egg. It’s a conservative, low-touch portfolio but we are using option strategies to improve our leverage and that has rocketed our gains.
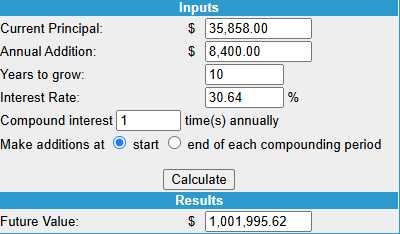 We have now made 29 monthly deposits of $700 ($20,300) and, overall, we are up $15,558 (76.6%) in 2.5 years averaging 30.64% a year and that means we are 10 years away from our $1,000,000 goal at this pace so there is still a great opportunity to join us if you’d like to take $35,858 and turn it into $1M by adding just $700/month ($84,000) for 10 years – that will be a profit of $880,142 (734%) if we stay on this track.
This pullback was not unexpected. As I said in the Dec 10th review:
We are over the “Top of Range” our 5% Rule predicted for 2024 – so we’re simply at our goal and now we need to consider what our target is for 2025. We have not seen, so far, a rise in earnings that would dictate raising our targets – especially when we consider that, without the Magnificent 7, 2024 earnings for the S&P 493 have been essentially flat.
Last month, I was looking to play it cautiously but, in reviewing our positions, we felt safe enough playing it more aggressively but I’m not sure I will feel the same ways playing over the holidays – especially with the S&P OVER the top of our range. HOWEVER, I did say last month that, if we popped over 6,000, we could get more aggressive – so we’ll play it by ear, I suppose.
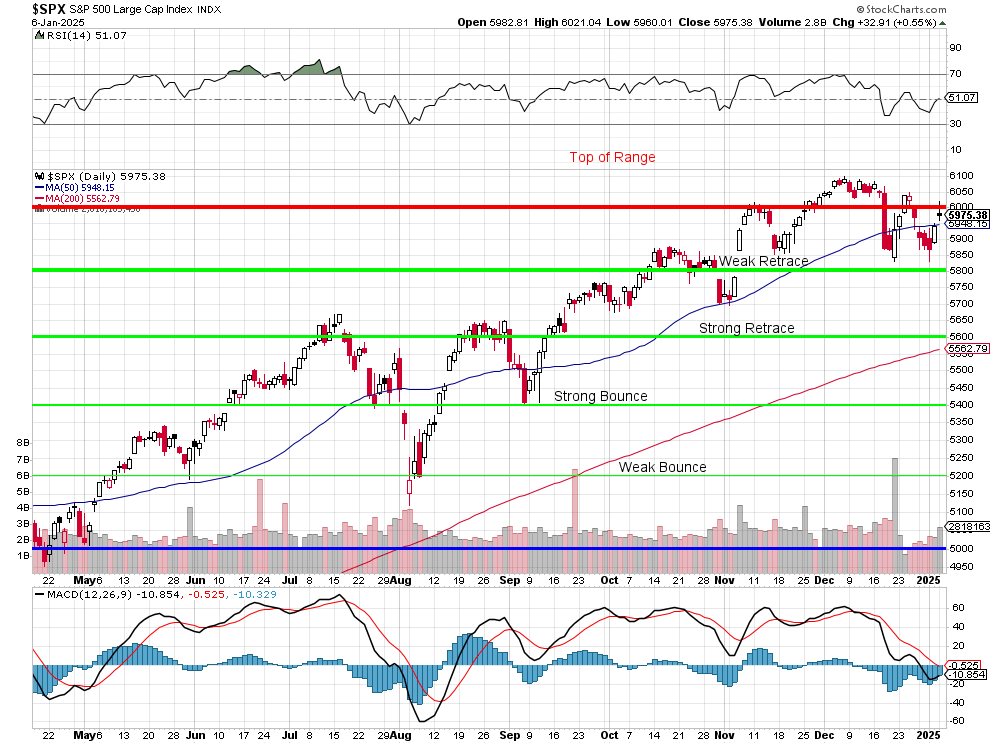
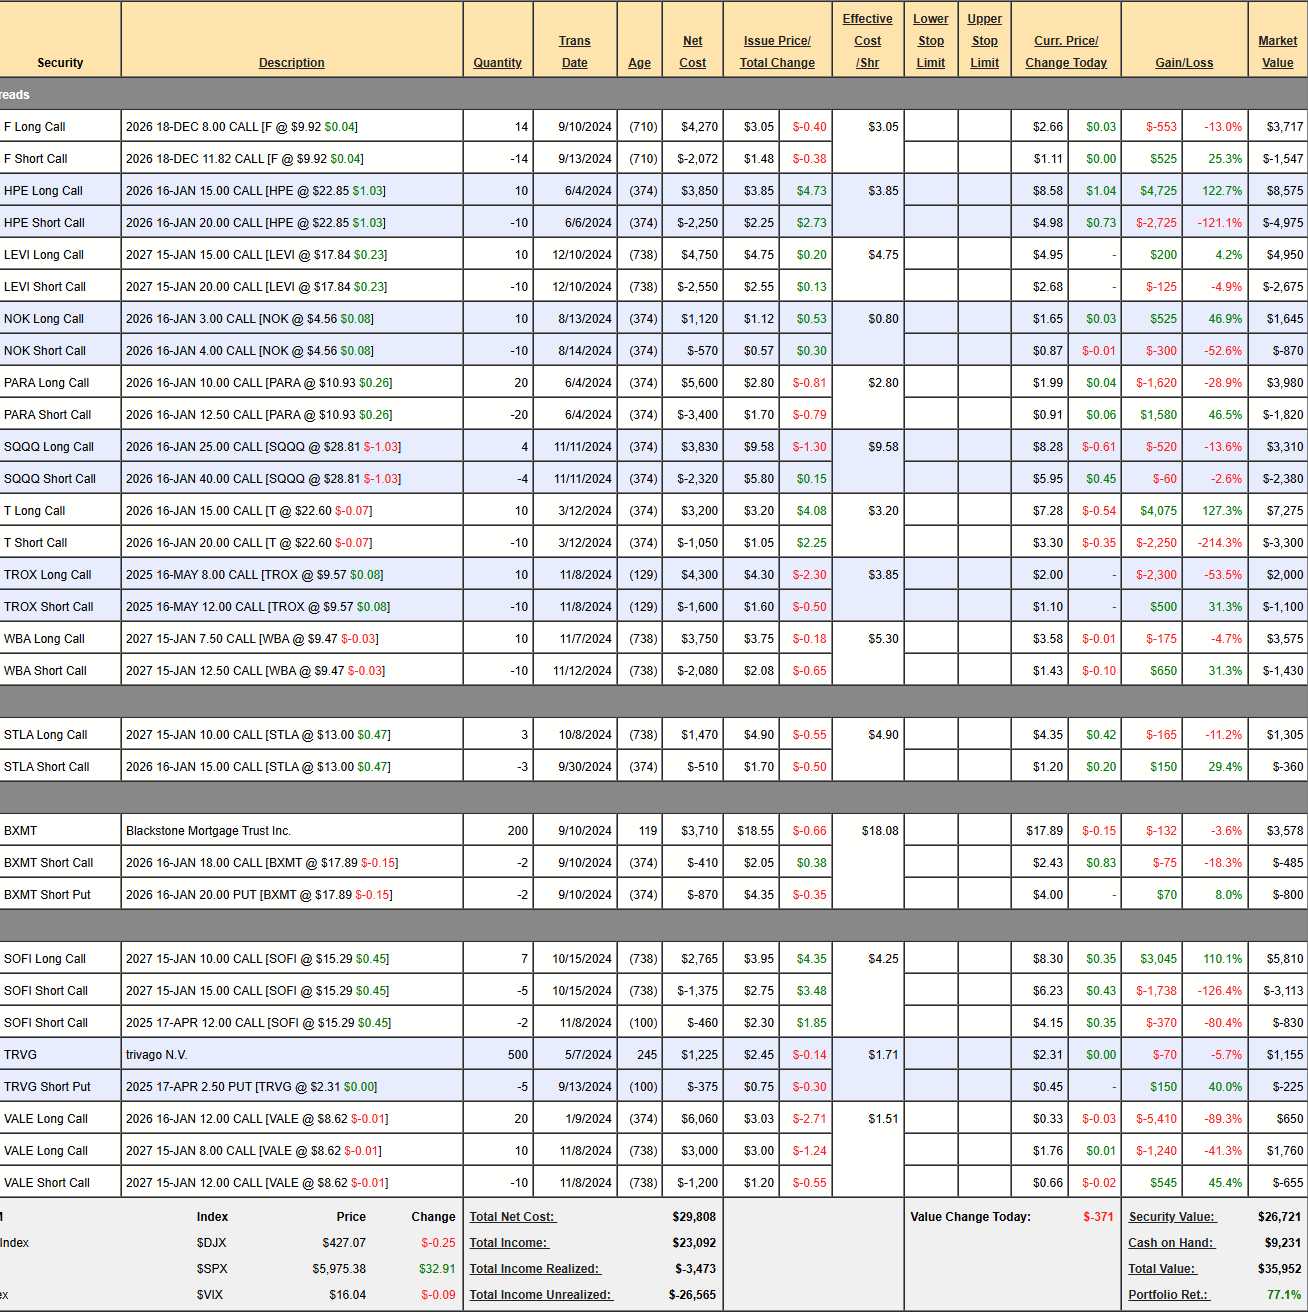
Not too much damage so far and we’re 20 years ahead of schedule so we shouldn’t complain, but that doesn’t mean we can’t improve – so let’s see what we can do to push ourselves harder. Quick note, we actually have a bit more money now because BXMT paid a dividend:
-
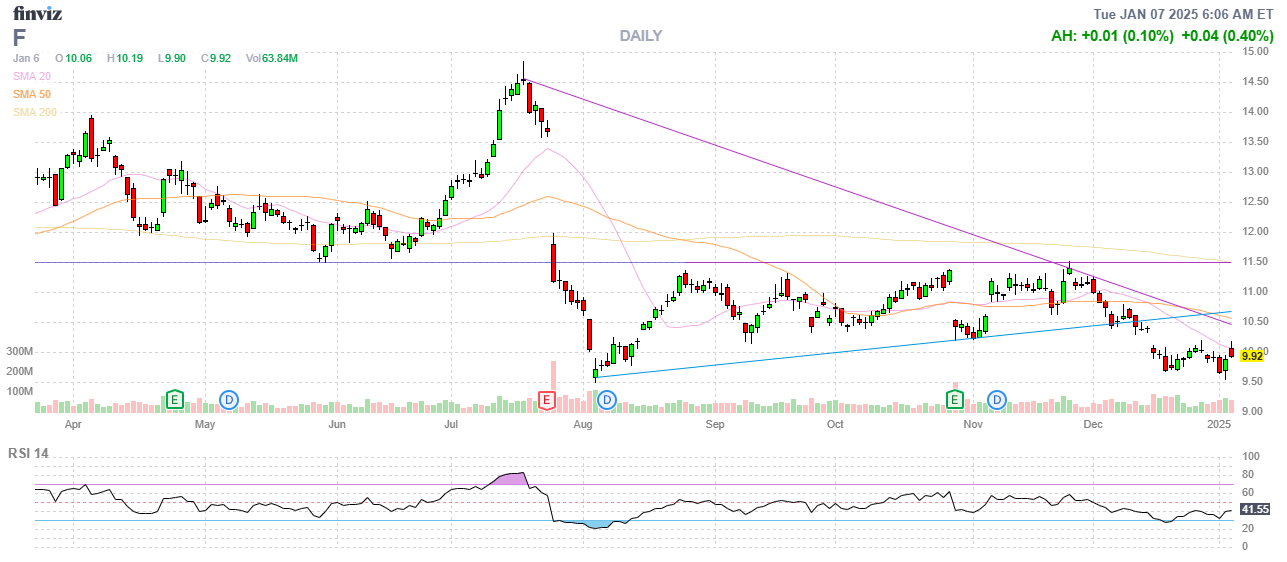
- F – Took a hit in December but we still love them and our spread is still on track so we’re not going to adjust it as we only have $9,231 to spread around and we should save it for where it’s needed. This is a $5,348 spread at net $2,170 with $3,178 (146%%) upside potential – good for a new trade!
-
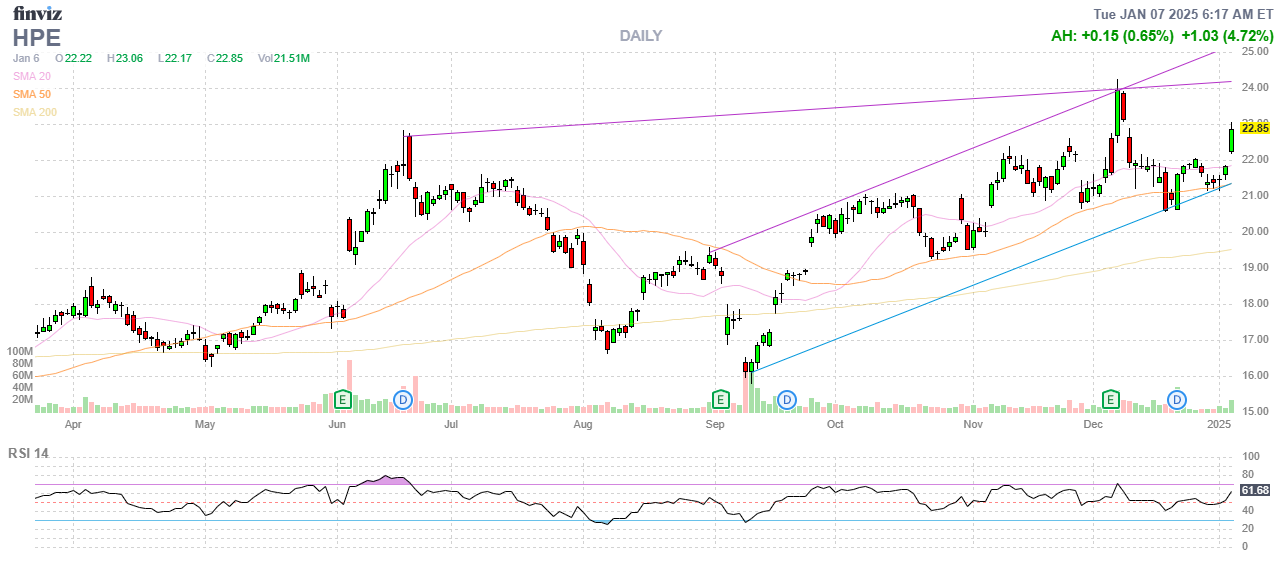
- HPE – Over our target at net $3,600 on the $5,000 spread so we expect to make $1,400 (38.8%) over the next 12 months – no reason to change that!
-
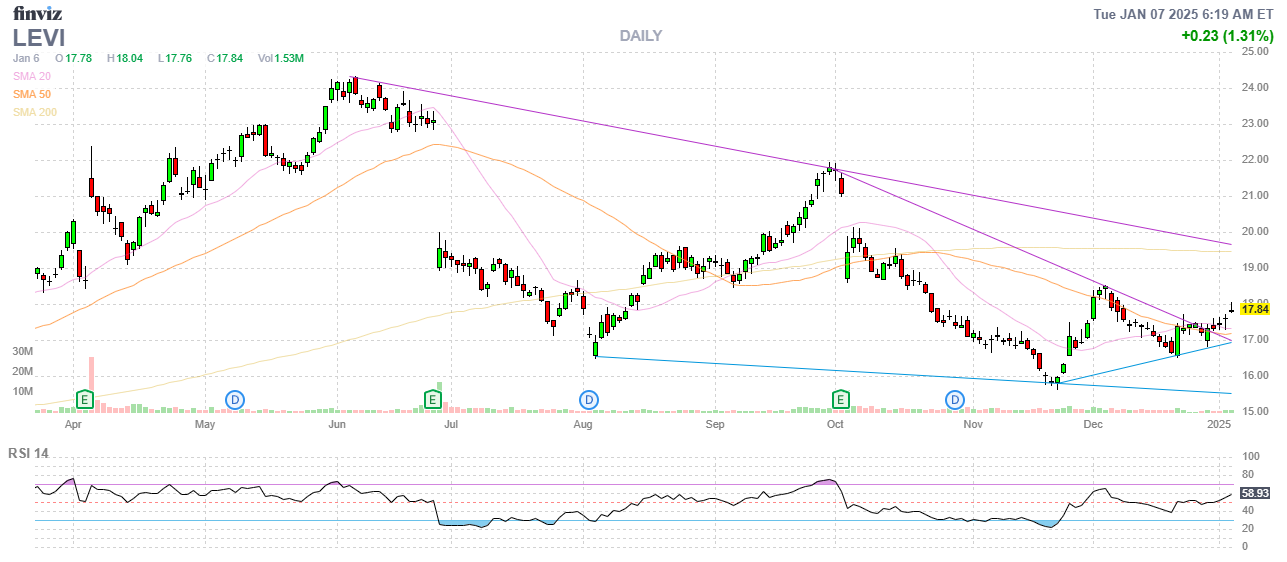
- LEVI – We cashed out our earlier spread and this one is brand new and on track at net $2,275 on the $5,000 spread with $2,725 (119%) left to gain.
-
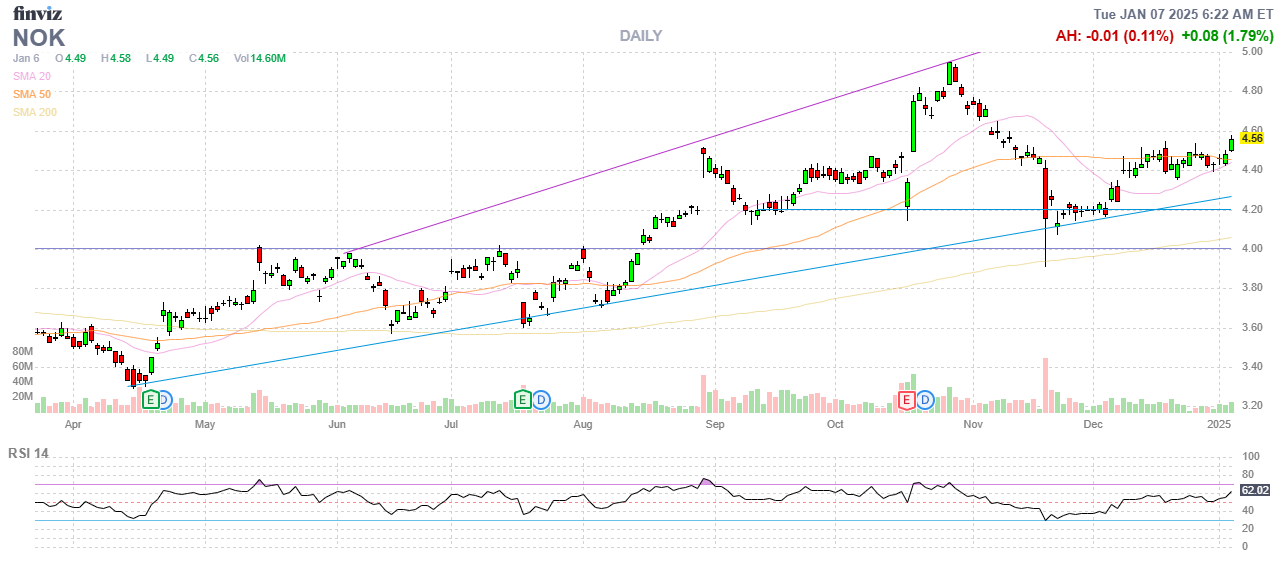
- NOK – Already over our goal at net $775 on the $1,000 spread so we have $225 (29%) left to gain over the next 12 months.
-
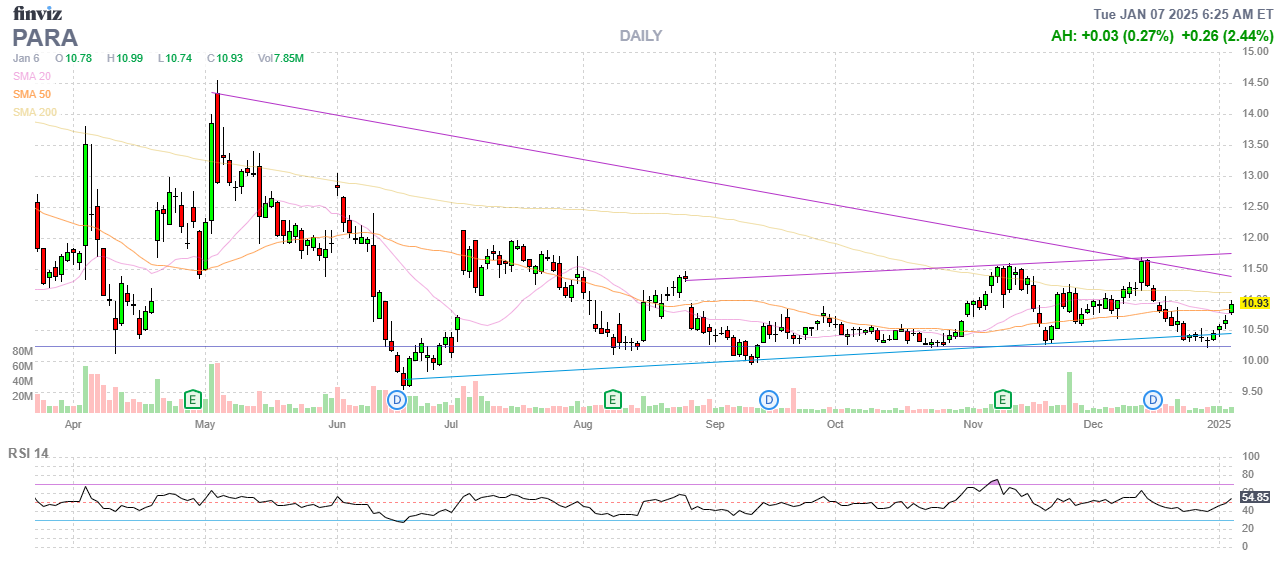
- PARA – Still languishing and I apologize if I got the math wrong but the buyout SHOULD take them over $12.50 and that would be $5,000 on what is currently net $2,160 so I think there is $2,840 (131%) of upside potential here.
-
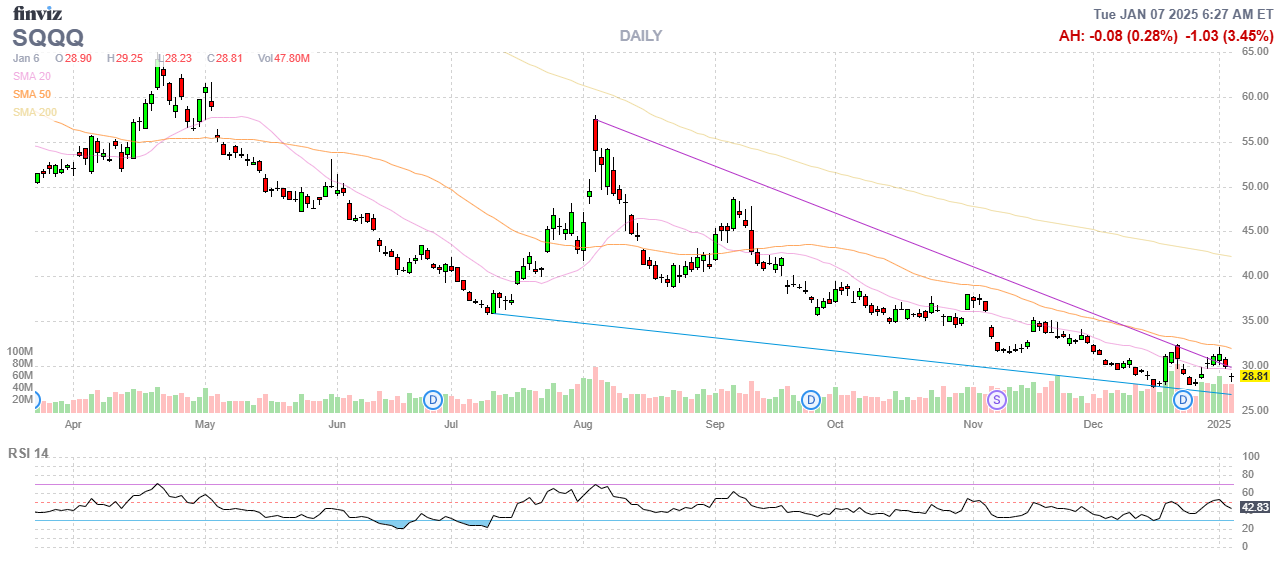
- SQQQ – We doubled down on our hedge last month and it pays $6,000 at $40 and the current net is $930 so it’s providing us with $5,070 of downside protection.
-
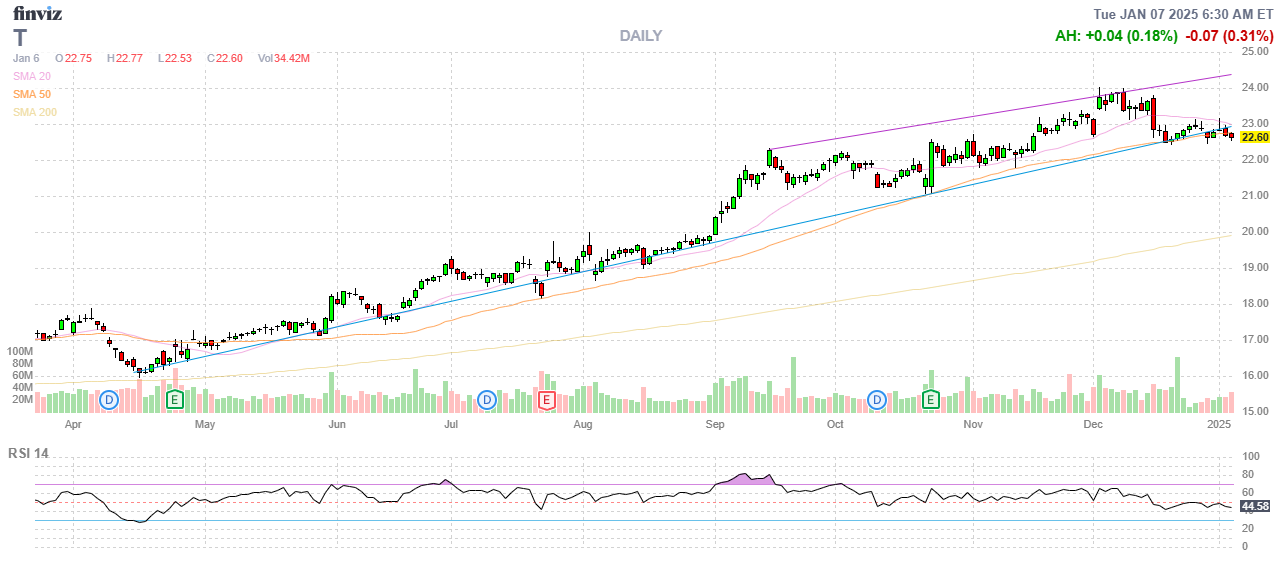
- T – Well in the money but only net $3,975 on the $5,000 spread so we have $1,025 (25.7%) left to gain over the next 12 months.
-
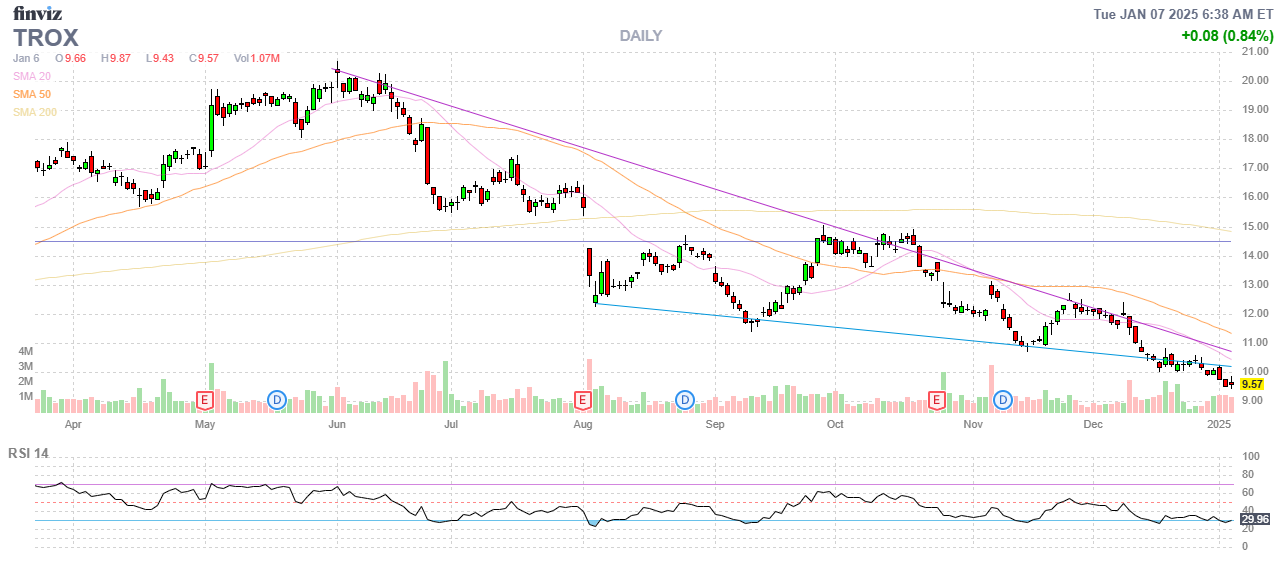
- TROX – As the longs are down 53.5%, I no longer want to wait for earnings so let’s roll our 10 May $8 calls at $2 ($2,000) to 20 Dec $8 calls at $2.90 ($5,800) and sell 10 Dec $12 calls for $1 ($1,000) so we are spending net $2,800 for another $4,000 spread while buying more time for our longs. Now it’s an $8,000 spread at net $3,700 with $4,300 (116%) upside potential.
-
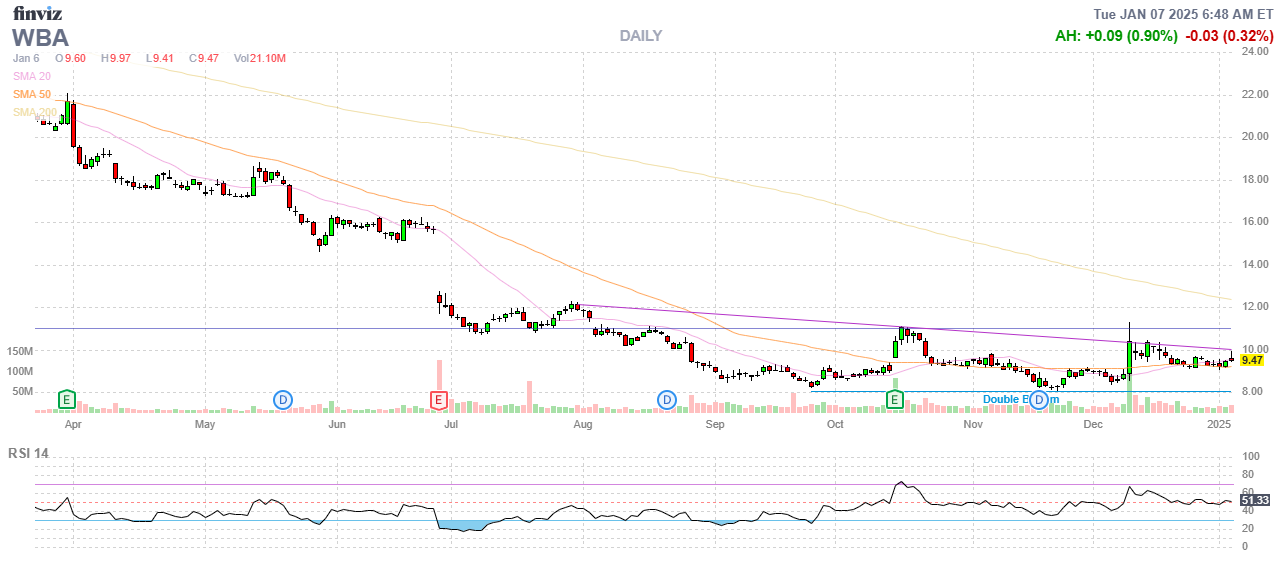
- WBA – It’s been frustrating but we have 2 years to get to $12.50 and I believe in that. Currently we’re at net $2,145 on the $5,000 spread so we have $2,855 (133%) of upside potential.
-
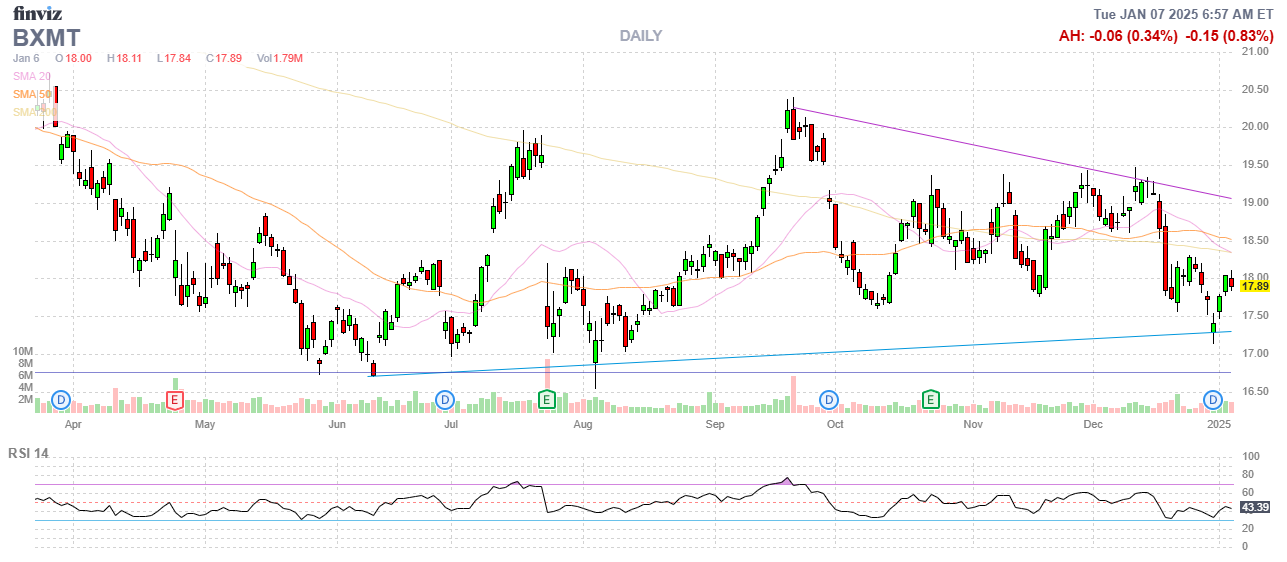
- BXMT – As noted, they just paid us an 0.47 ($94) dividend on the 31st and we’re on track to be called away at $3,600 against the current net of $2,293 so there’s $1,307 (56.9%) upside potential AND we’ll collect $376 (16.4%) of additional dividends over the year as well.
-
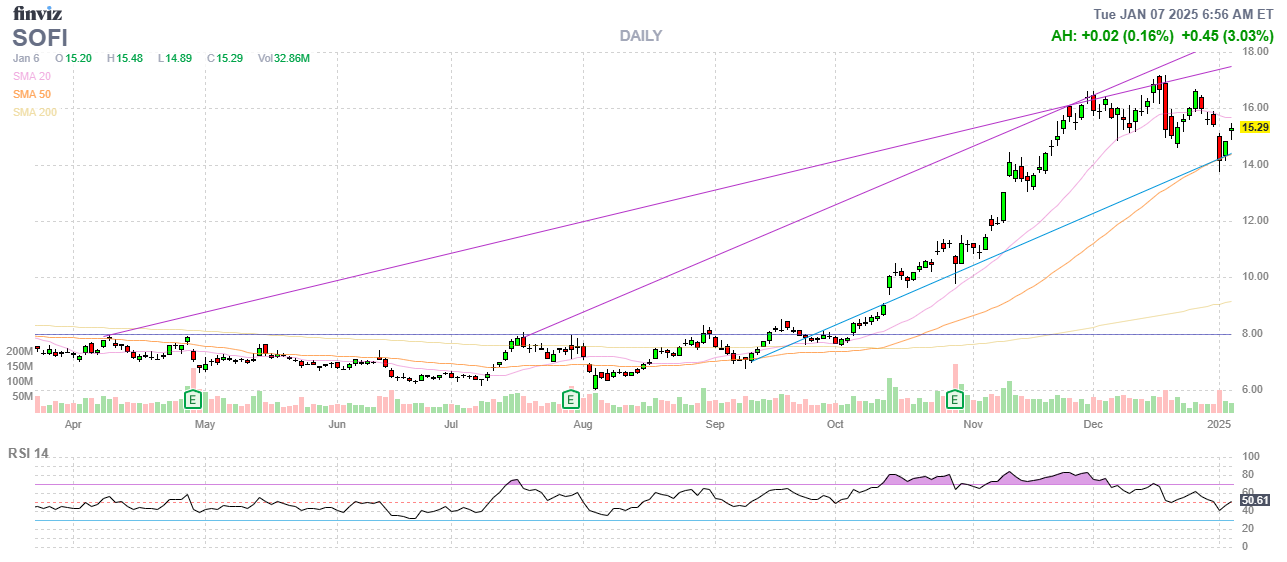
- SOFI – Over our goal already at net $1,167 on the $3,500+ (not fully covered) spread but let’s call it just $1,633 (139%) upside potential.
-
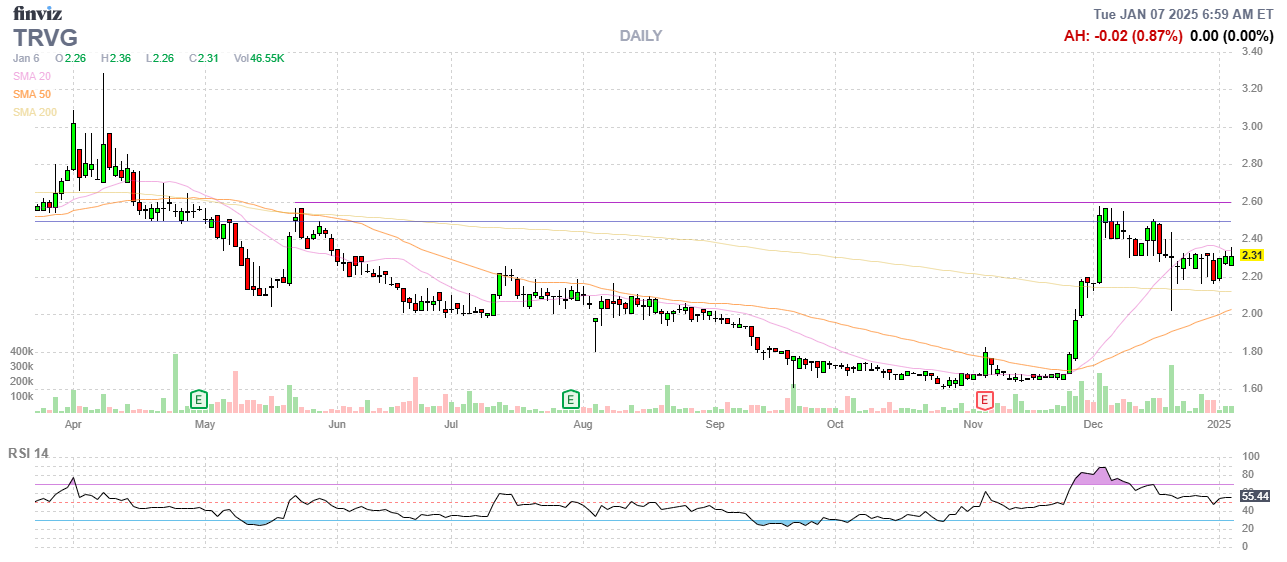
- TRVG – No dividend here but the stock has popped nicely and we may as well sell 5 July $2.50 calls for 0.50 ($500), which leaves us at net $430 to be called away at $1,250 with an $820 (190%) profit.
-
- VALE – Really been underperforming but stupidly cheap at $8.62 so let’s add 10 more 2027 $8 calls at $1.76 ($1,760) and see how earnings go. Not even going to count on this for upside at the moment…

So we spent $4,560, or about half our cash, on adjustments and we are left with $22,627 (62.9%) upside potential over the next two years, which keeps us on track with our current rate of gain so we’re in very good shape and anything new we do over the next 24 months will just be bonus money!
Sign Up for Updates
Get the latest stock market news from Phil by signing up for our newsletter!
By submitting this form, you are consenting to receive marketing emails from: . You can revoke your consent to receive emails at any time by using the SafeUnsubscribe® link, found at the bottom of every email. Emails are serviced by Constant Contact


