
 $39,542.
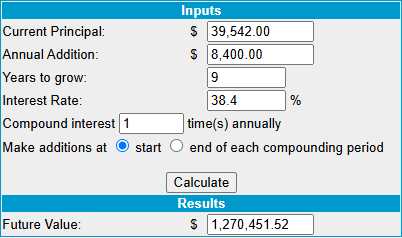
That’s up $3,684 since our Jan 7th review but that includes our monthly $700 contribution so the positions gained a healthy $2,984 (8.3%) for the month and, in 30 months, we’re up 88.3% or 2.9% per month on the average, which puts us on pace to be over $1M in less than 9 years.
That’s right, if you start now with $39,542 and contribute $700/month for the next 9 years ($75,600), at the end of year 9 we are on track to have $1,270,451 – that’s pretty good! Actually, it’s better than that as I forgot to log Blackstone’s 0.47 dividend on Dec 31st – that’s another $94!
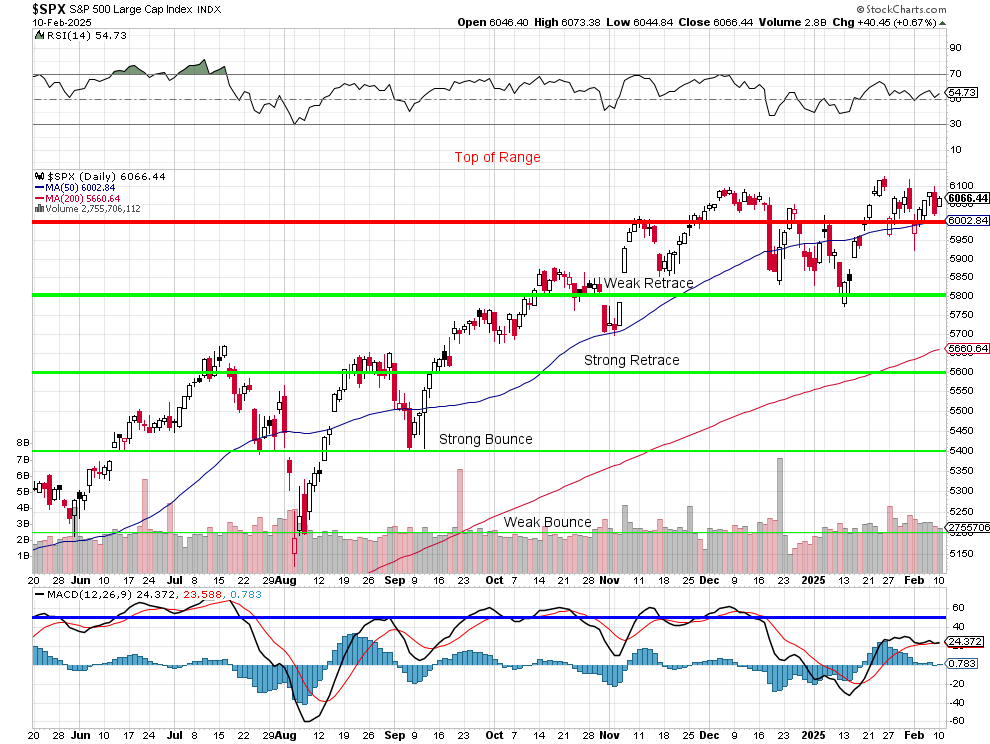
The S&P 500 is up about 3.4% for the month and, as long as it’s over 6,000 – our positions will continue to be in very good shape. Earnings season has been strong and the 200 dma has crossed over our Strong Retrace line so it’s less and less likely we will get a big pullback. These are great conditions for this portfolio.
As it stands, we’re 20 years ahead of schedule so there’s nothing to complain about but we shouldn’t be complacent either. Let’s see if we can make a few improvements as we do have $5,731 in CASH!!! on the sidelines:
-
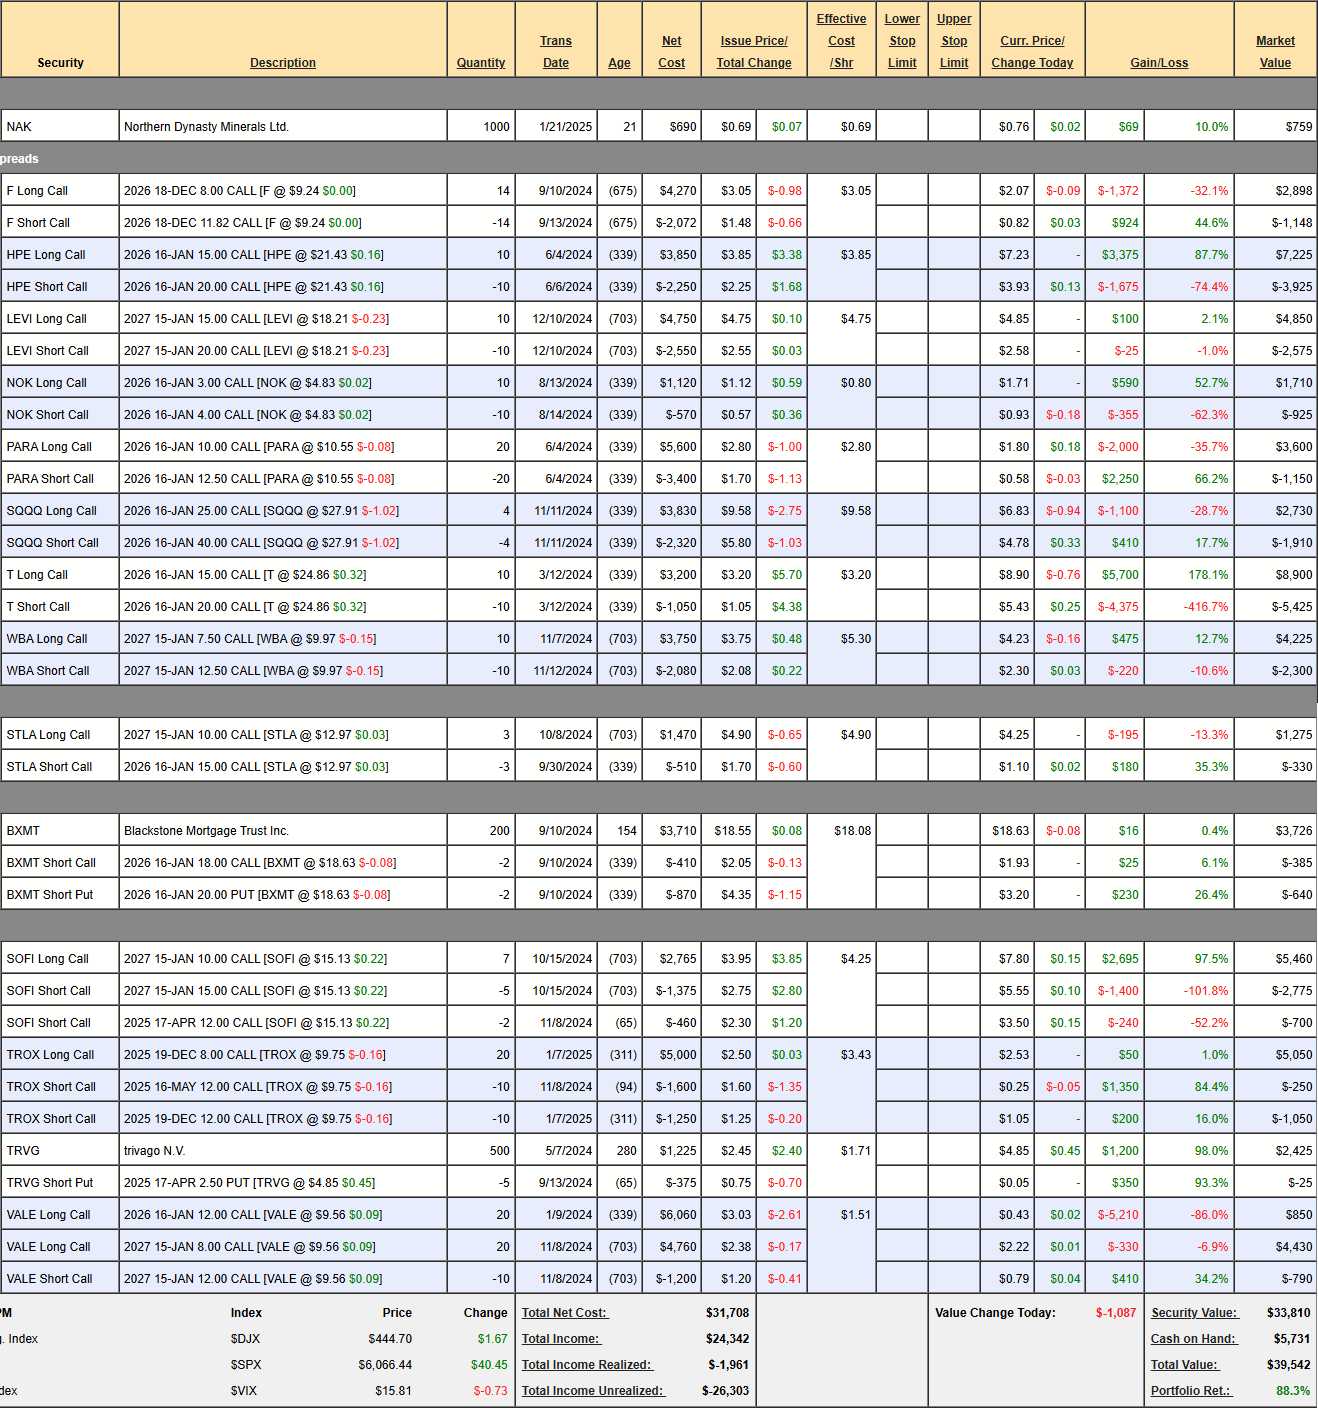
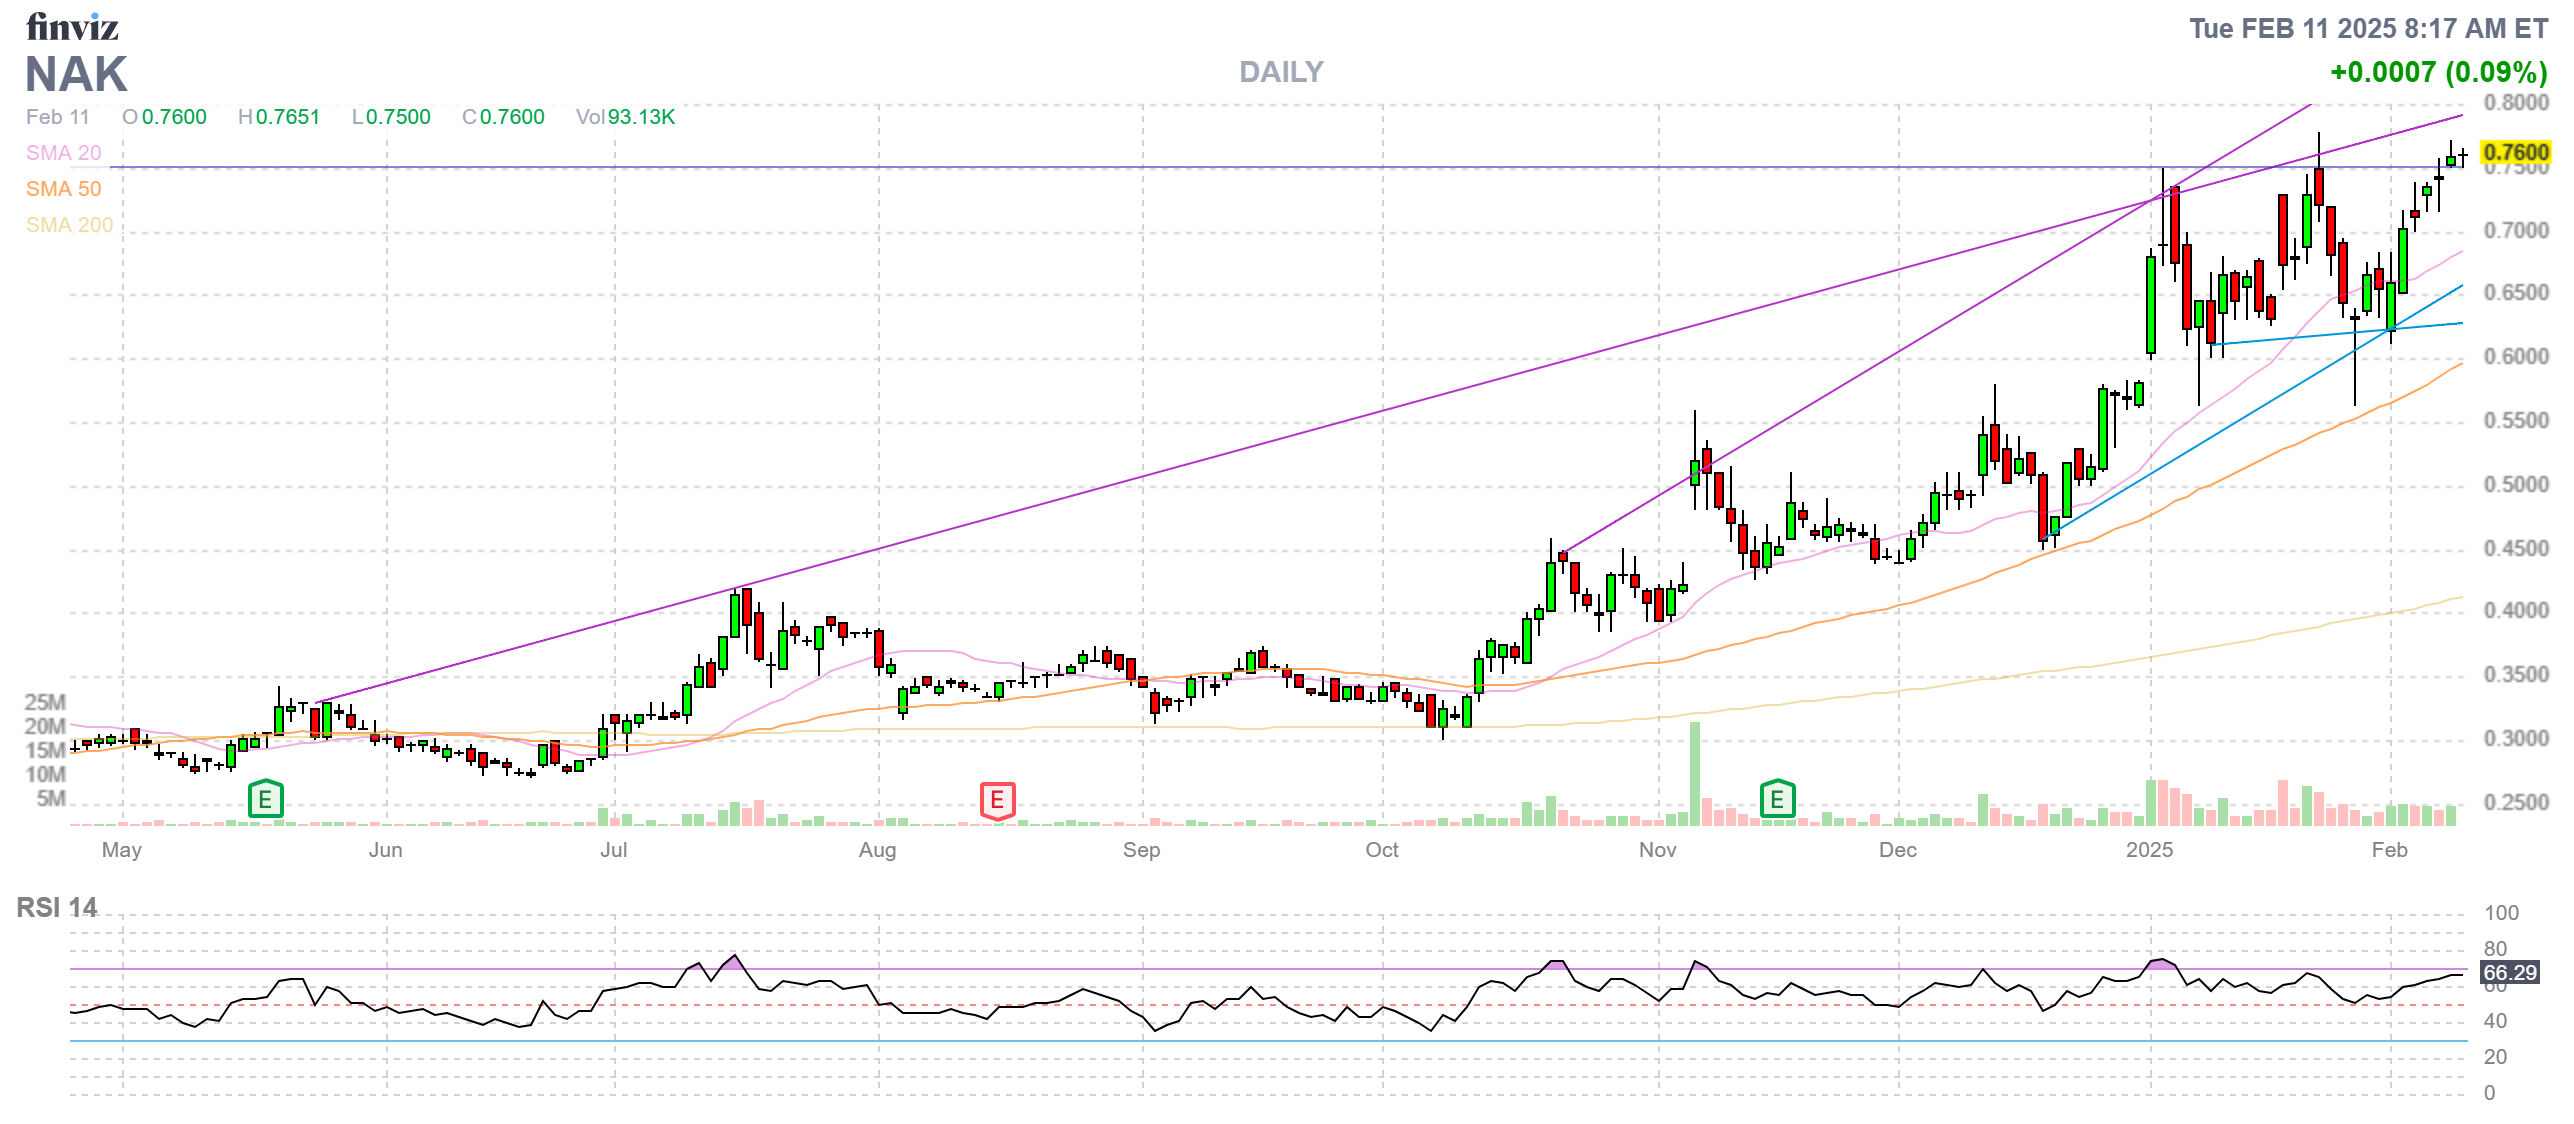
- NAK – Brand new play on this miner that has been held up by the EPA for a decade. What EPA?
-
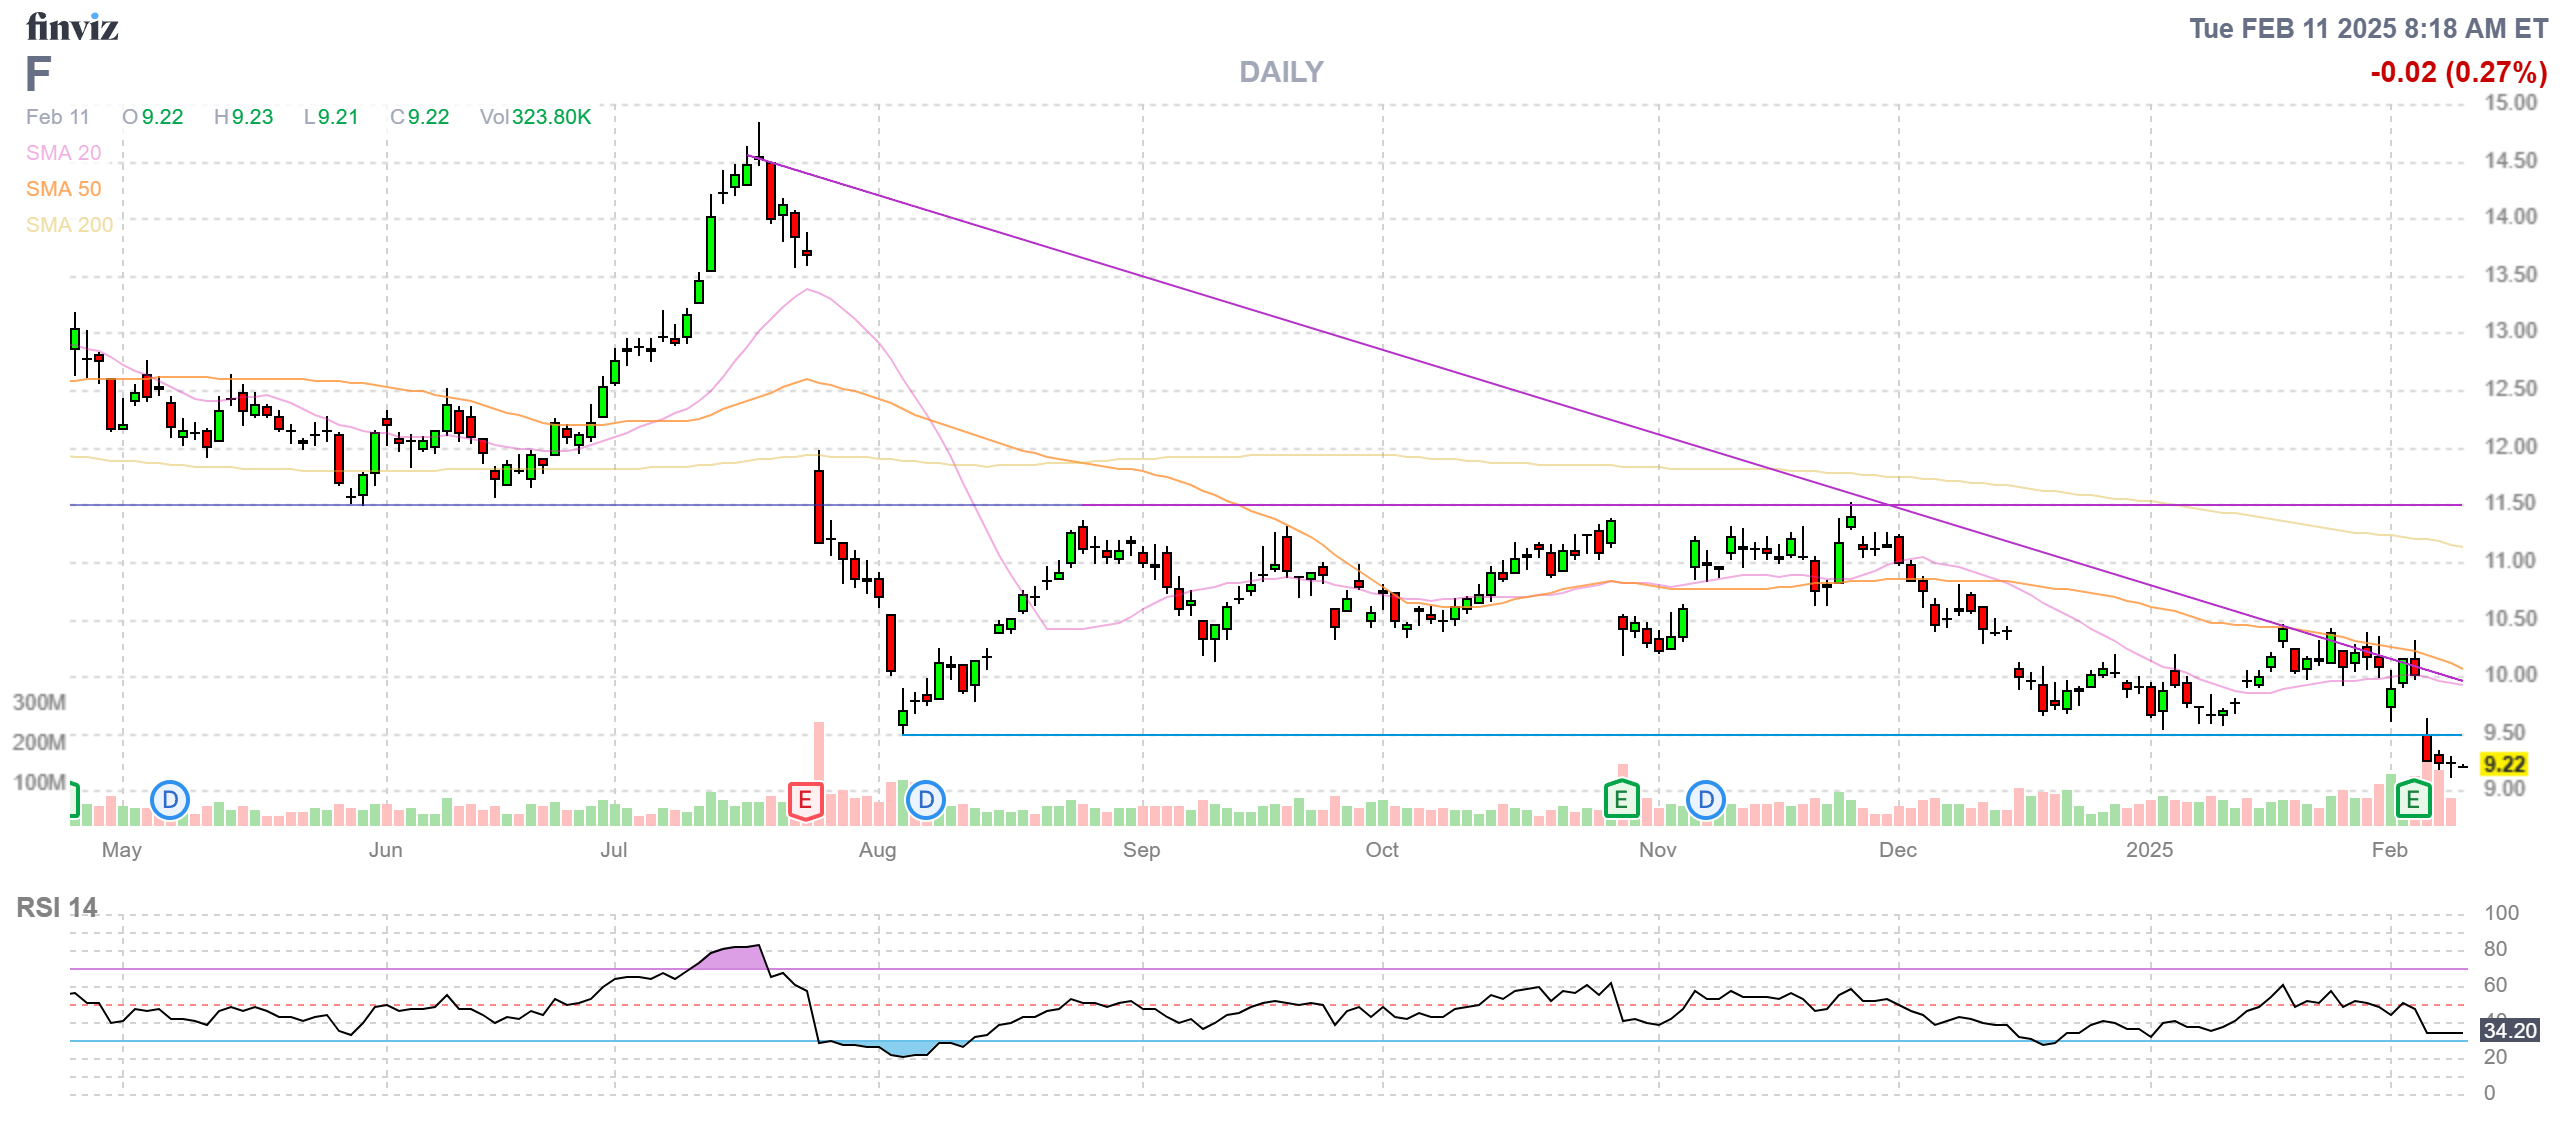
- F – Not going well so far but I still believe in our target.
-
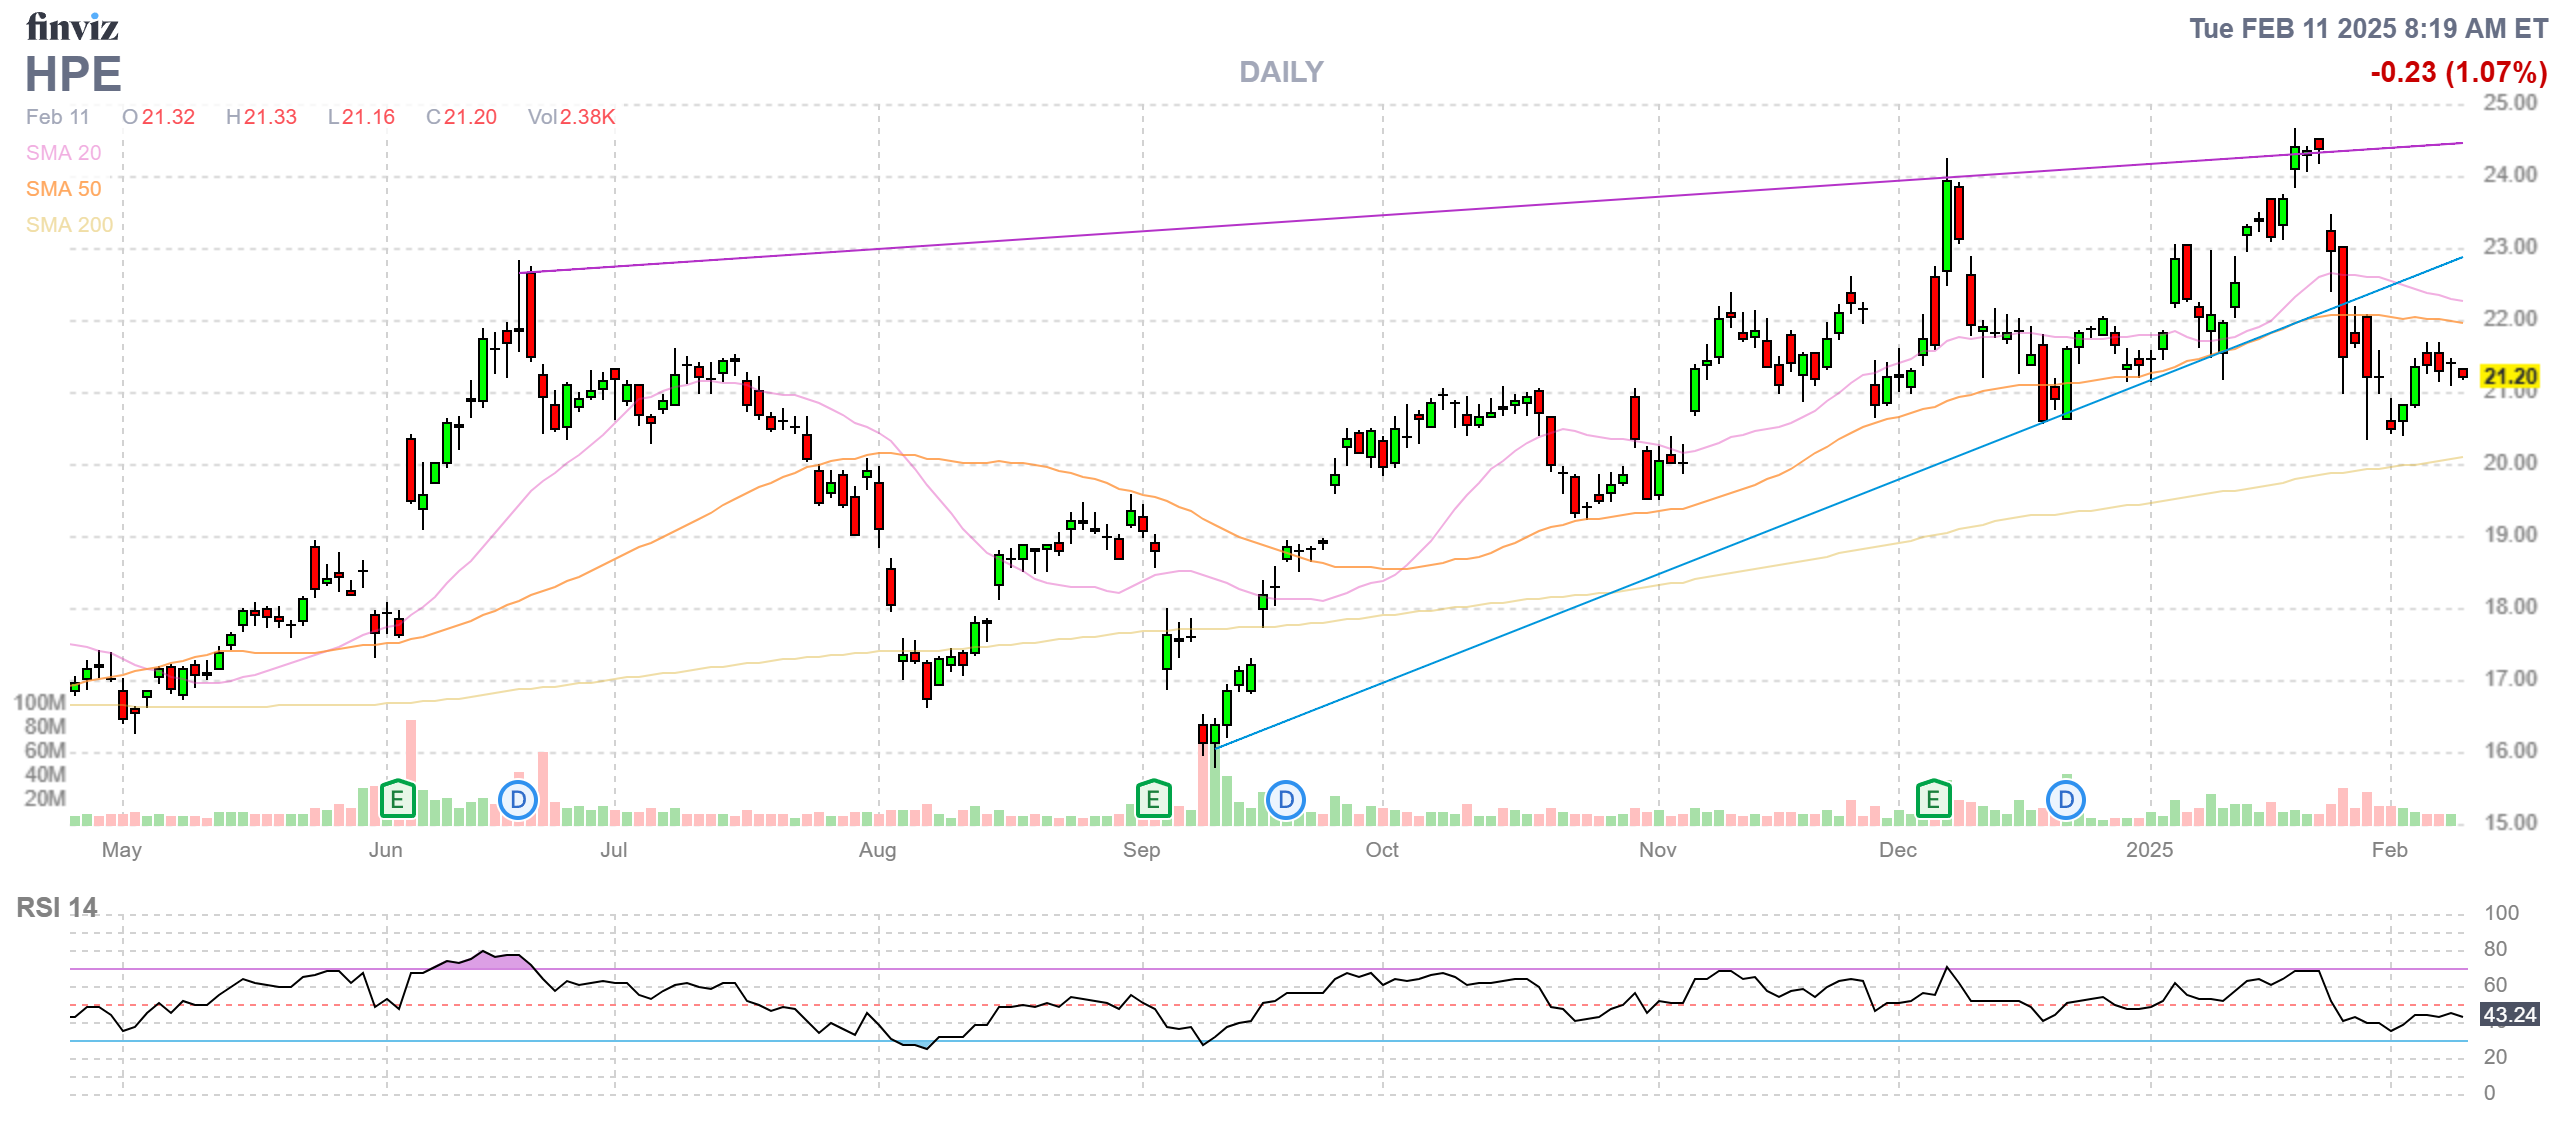
- HPE – Stupidly cheap down here and we’re already over our goal but the spread is only net $3,300 on the $5,000 spread so we still have $1,700 (51.5%) upside potential if they hold $20 into January.
-
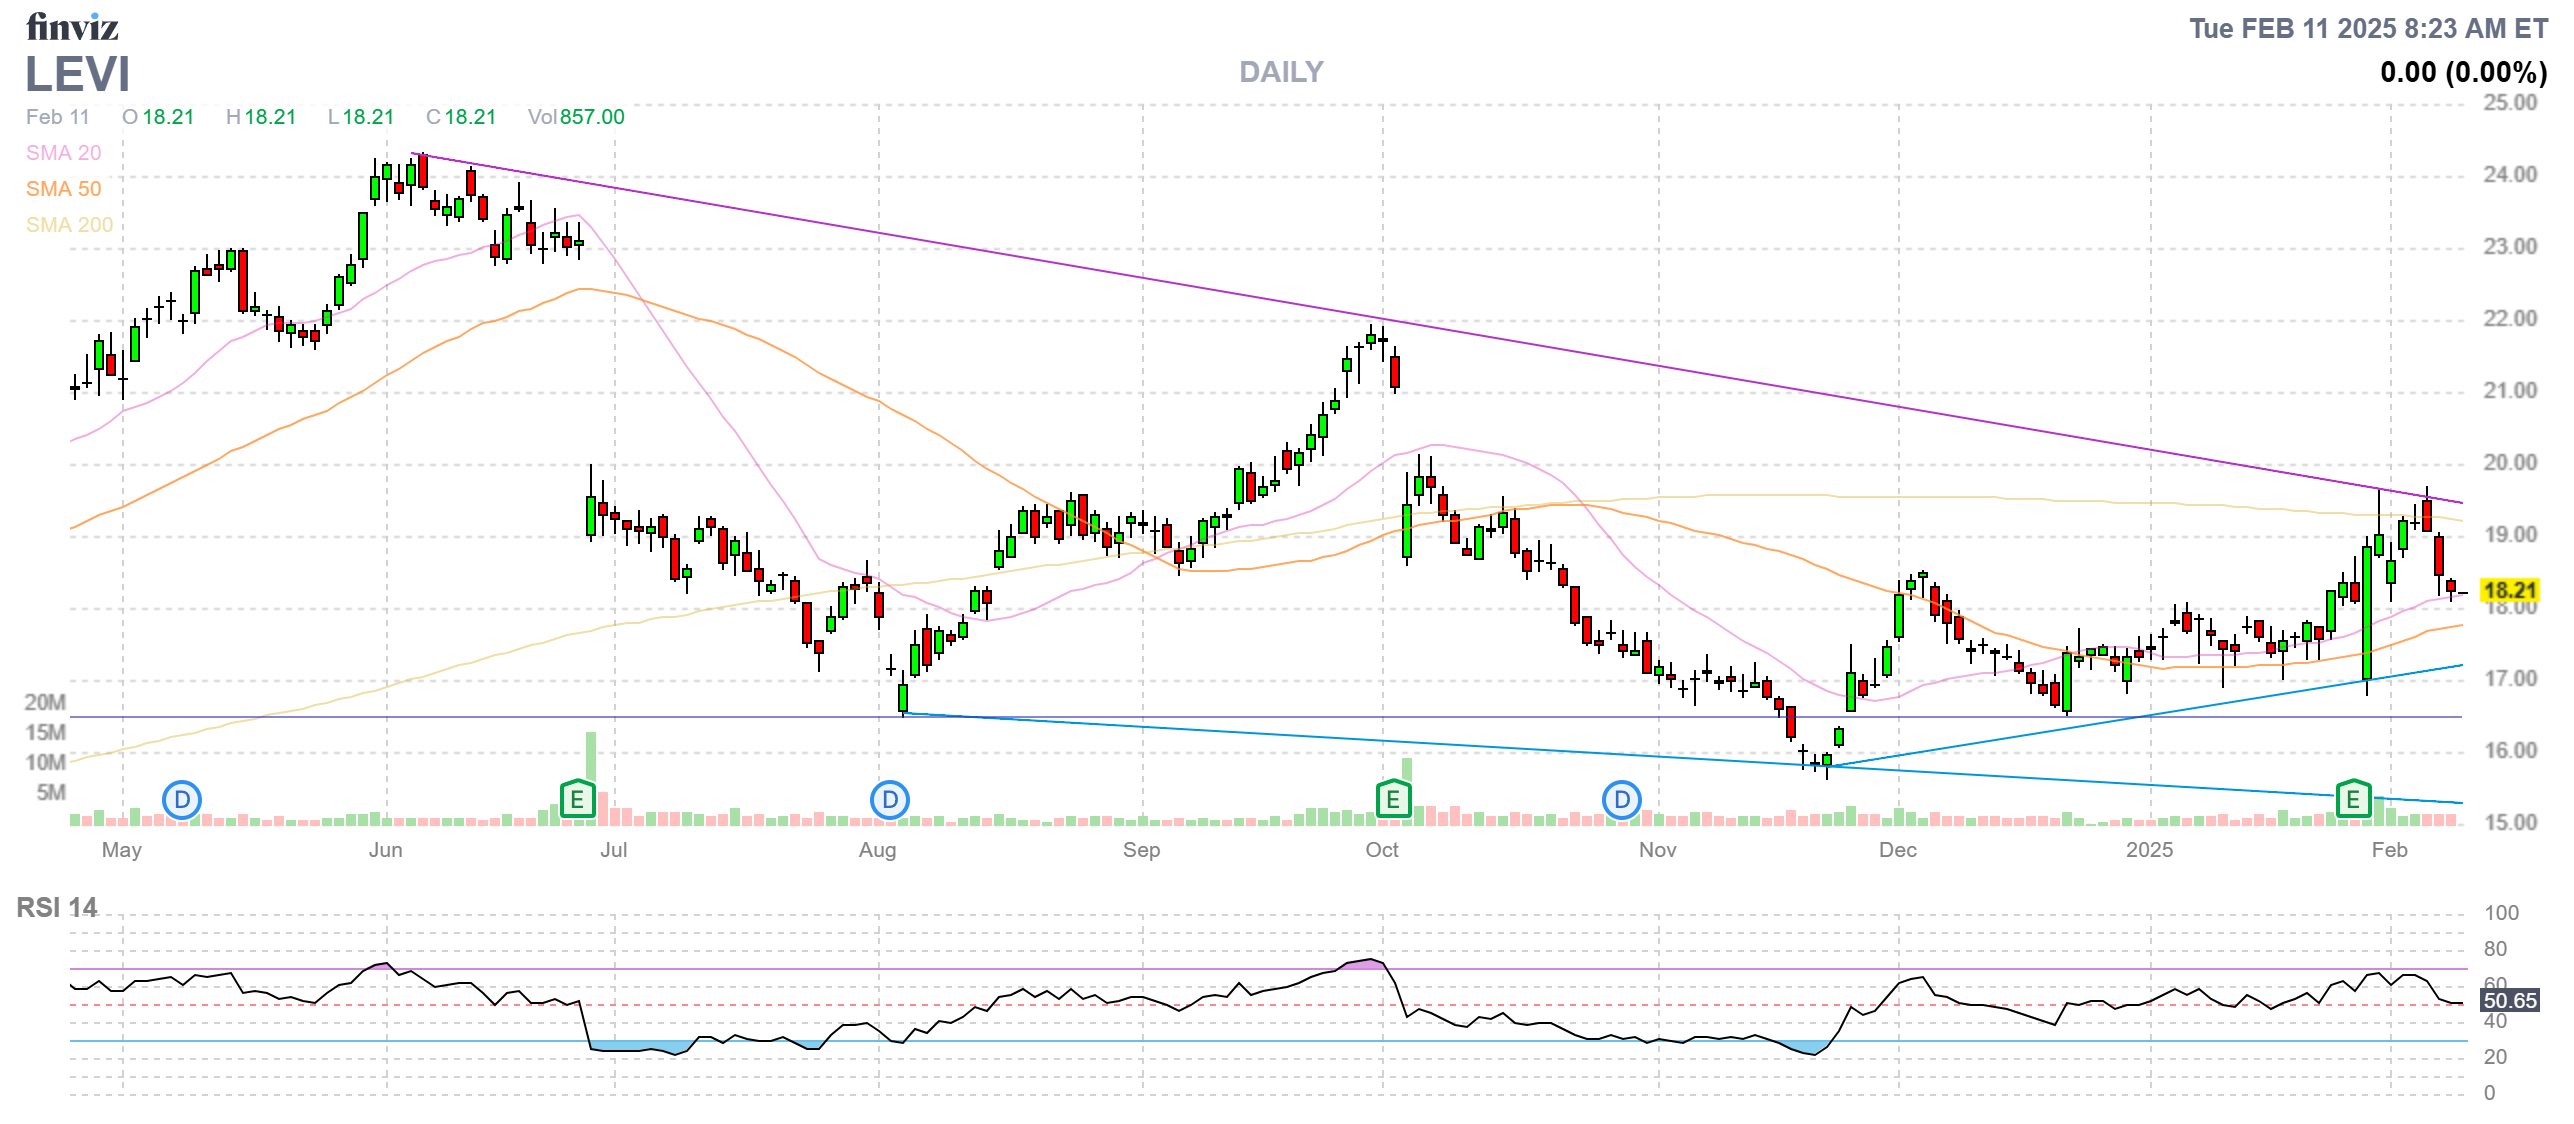
- LEVI – Also way too cheap and right on track at net $2,275 on thee $5,000 spread with $2,725 (119%) upside potential in two years.
-
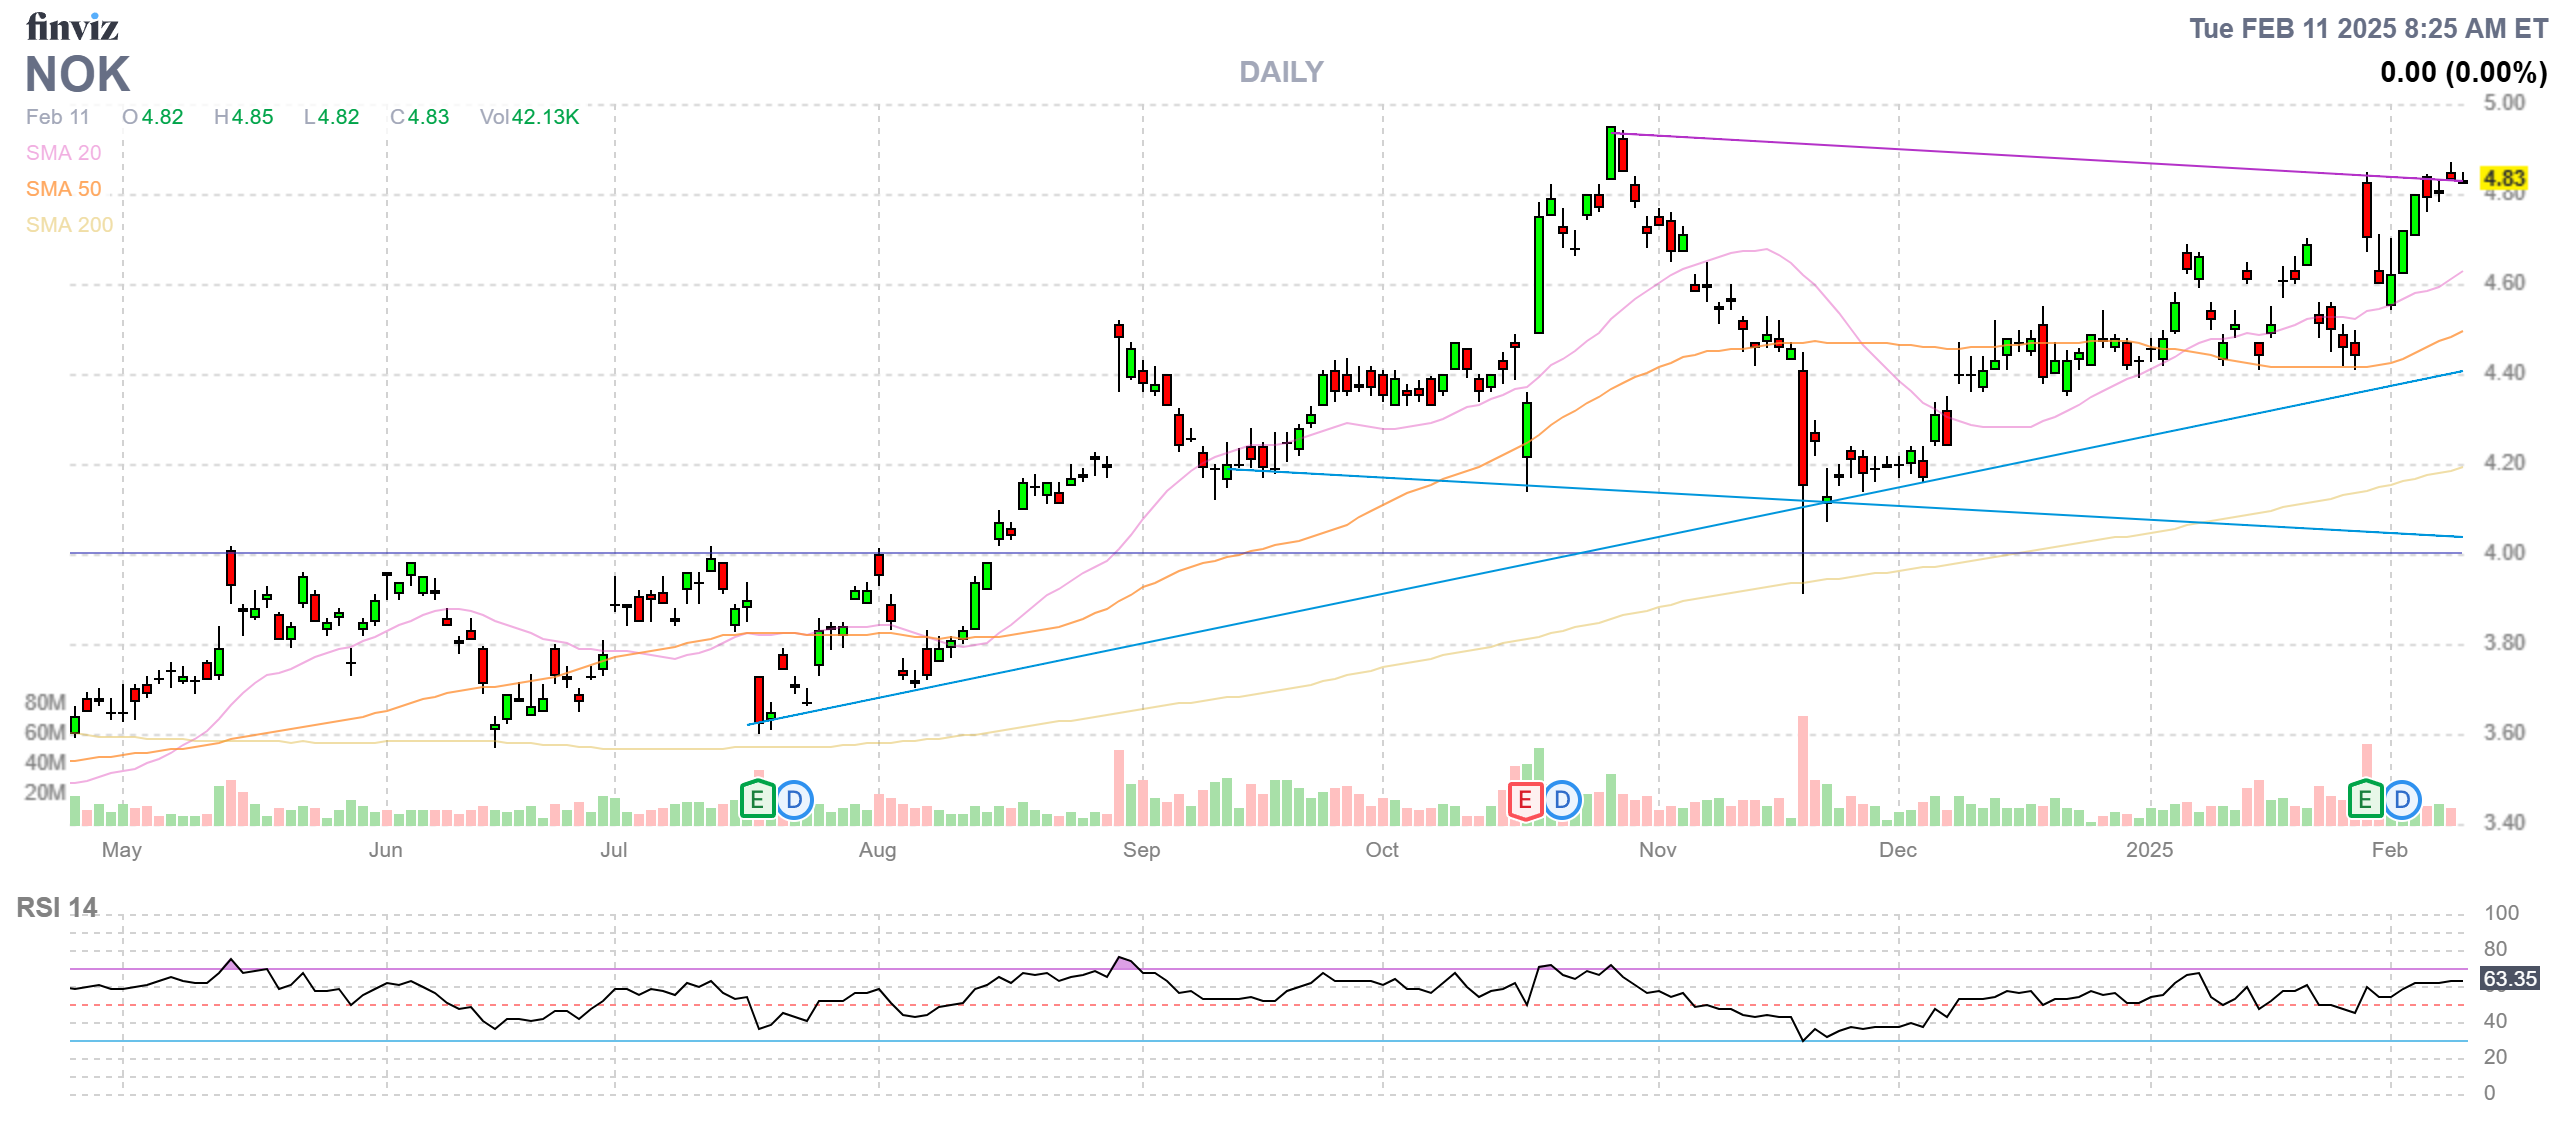
- NOK – Already past our goal at net $785 on the $1,000 spread.
-
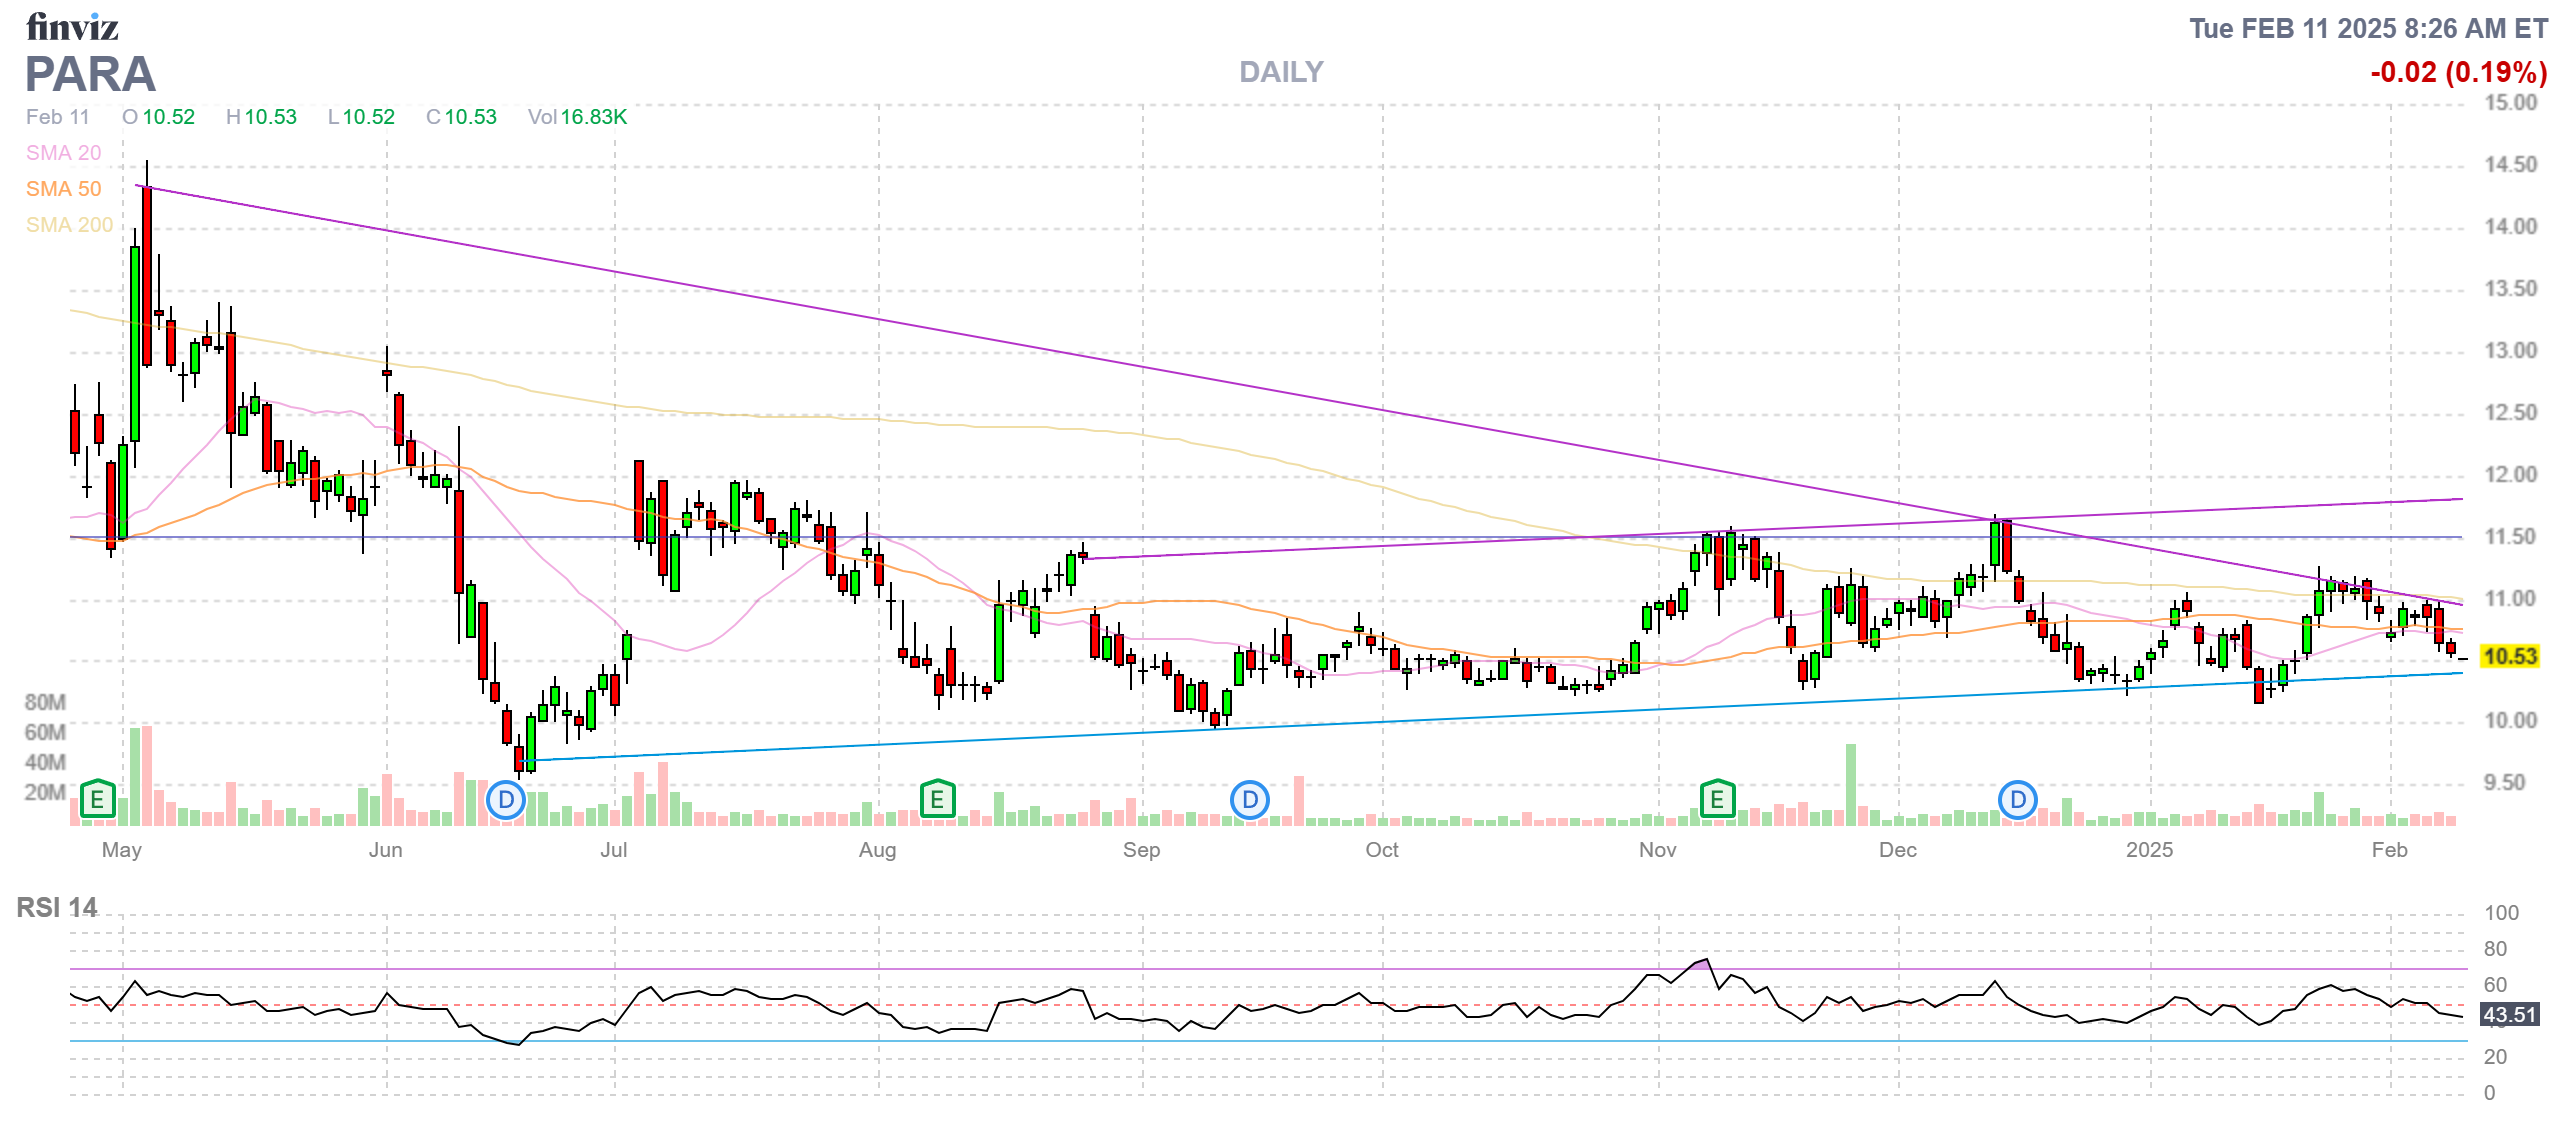
- PARA – So frustrating! We’re up a little but we have to keep up with the Trump lawsuit against PARA as it could make this too risky to keep.
-
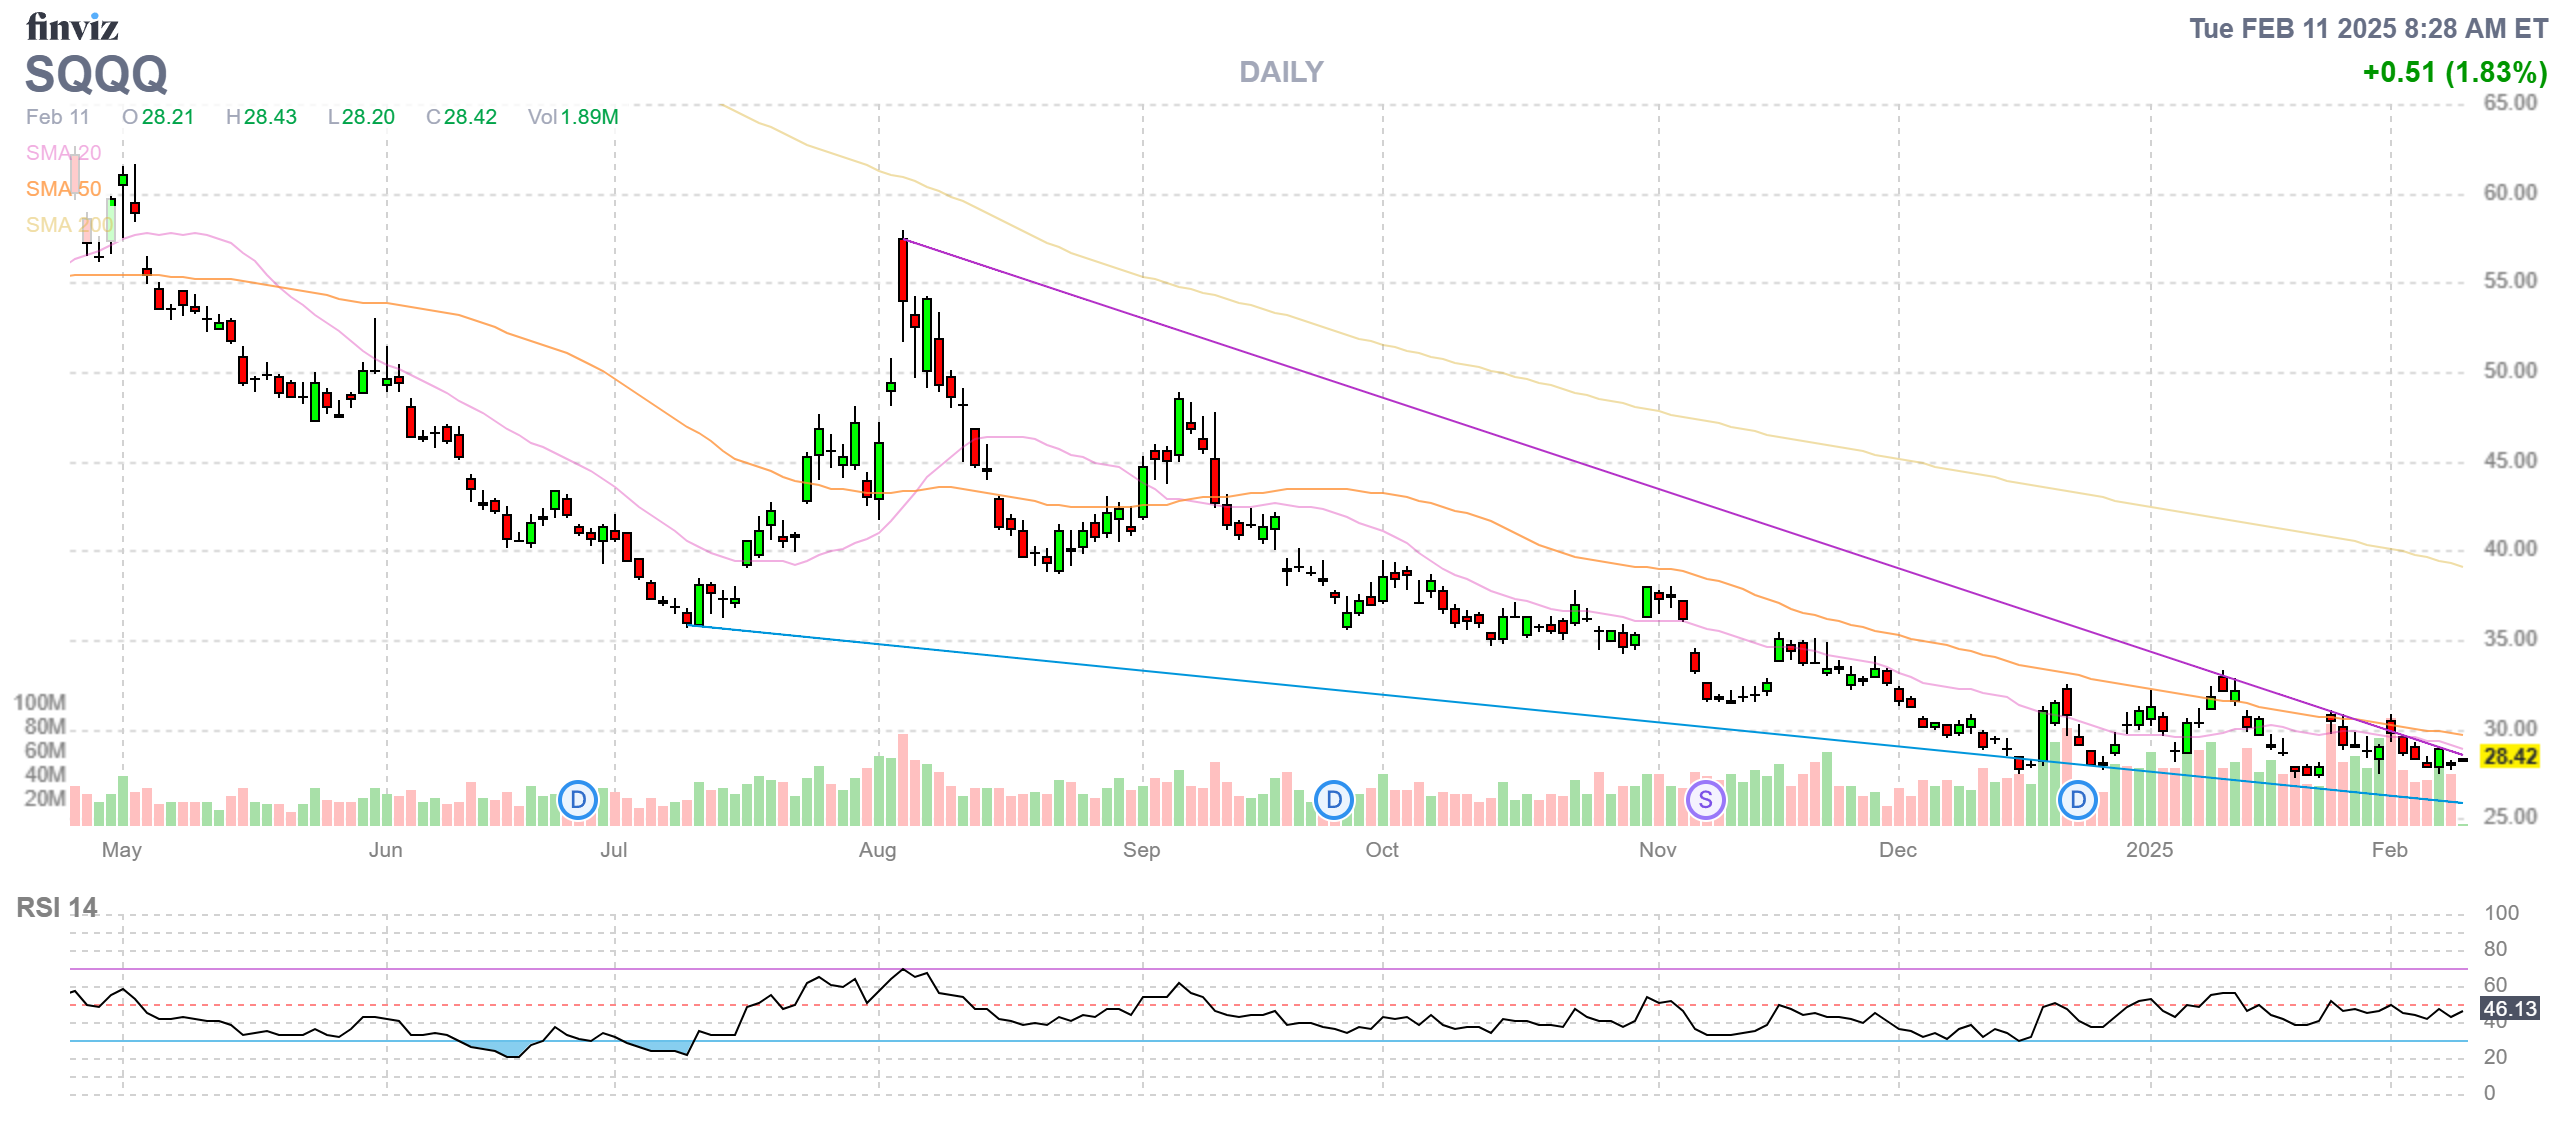
- SQQQ – Our hedge at net $820 gives us $5,180 of downside protection.
-
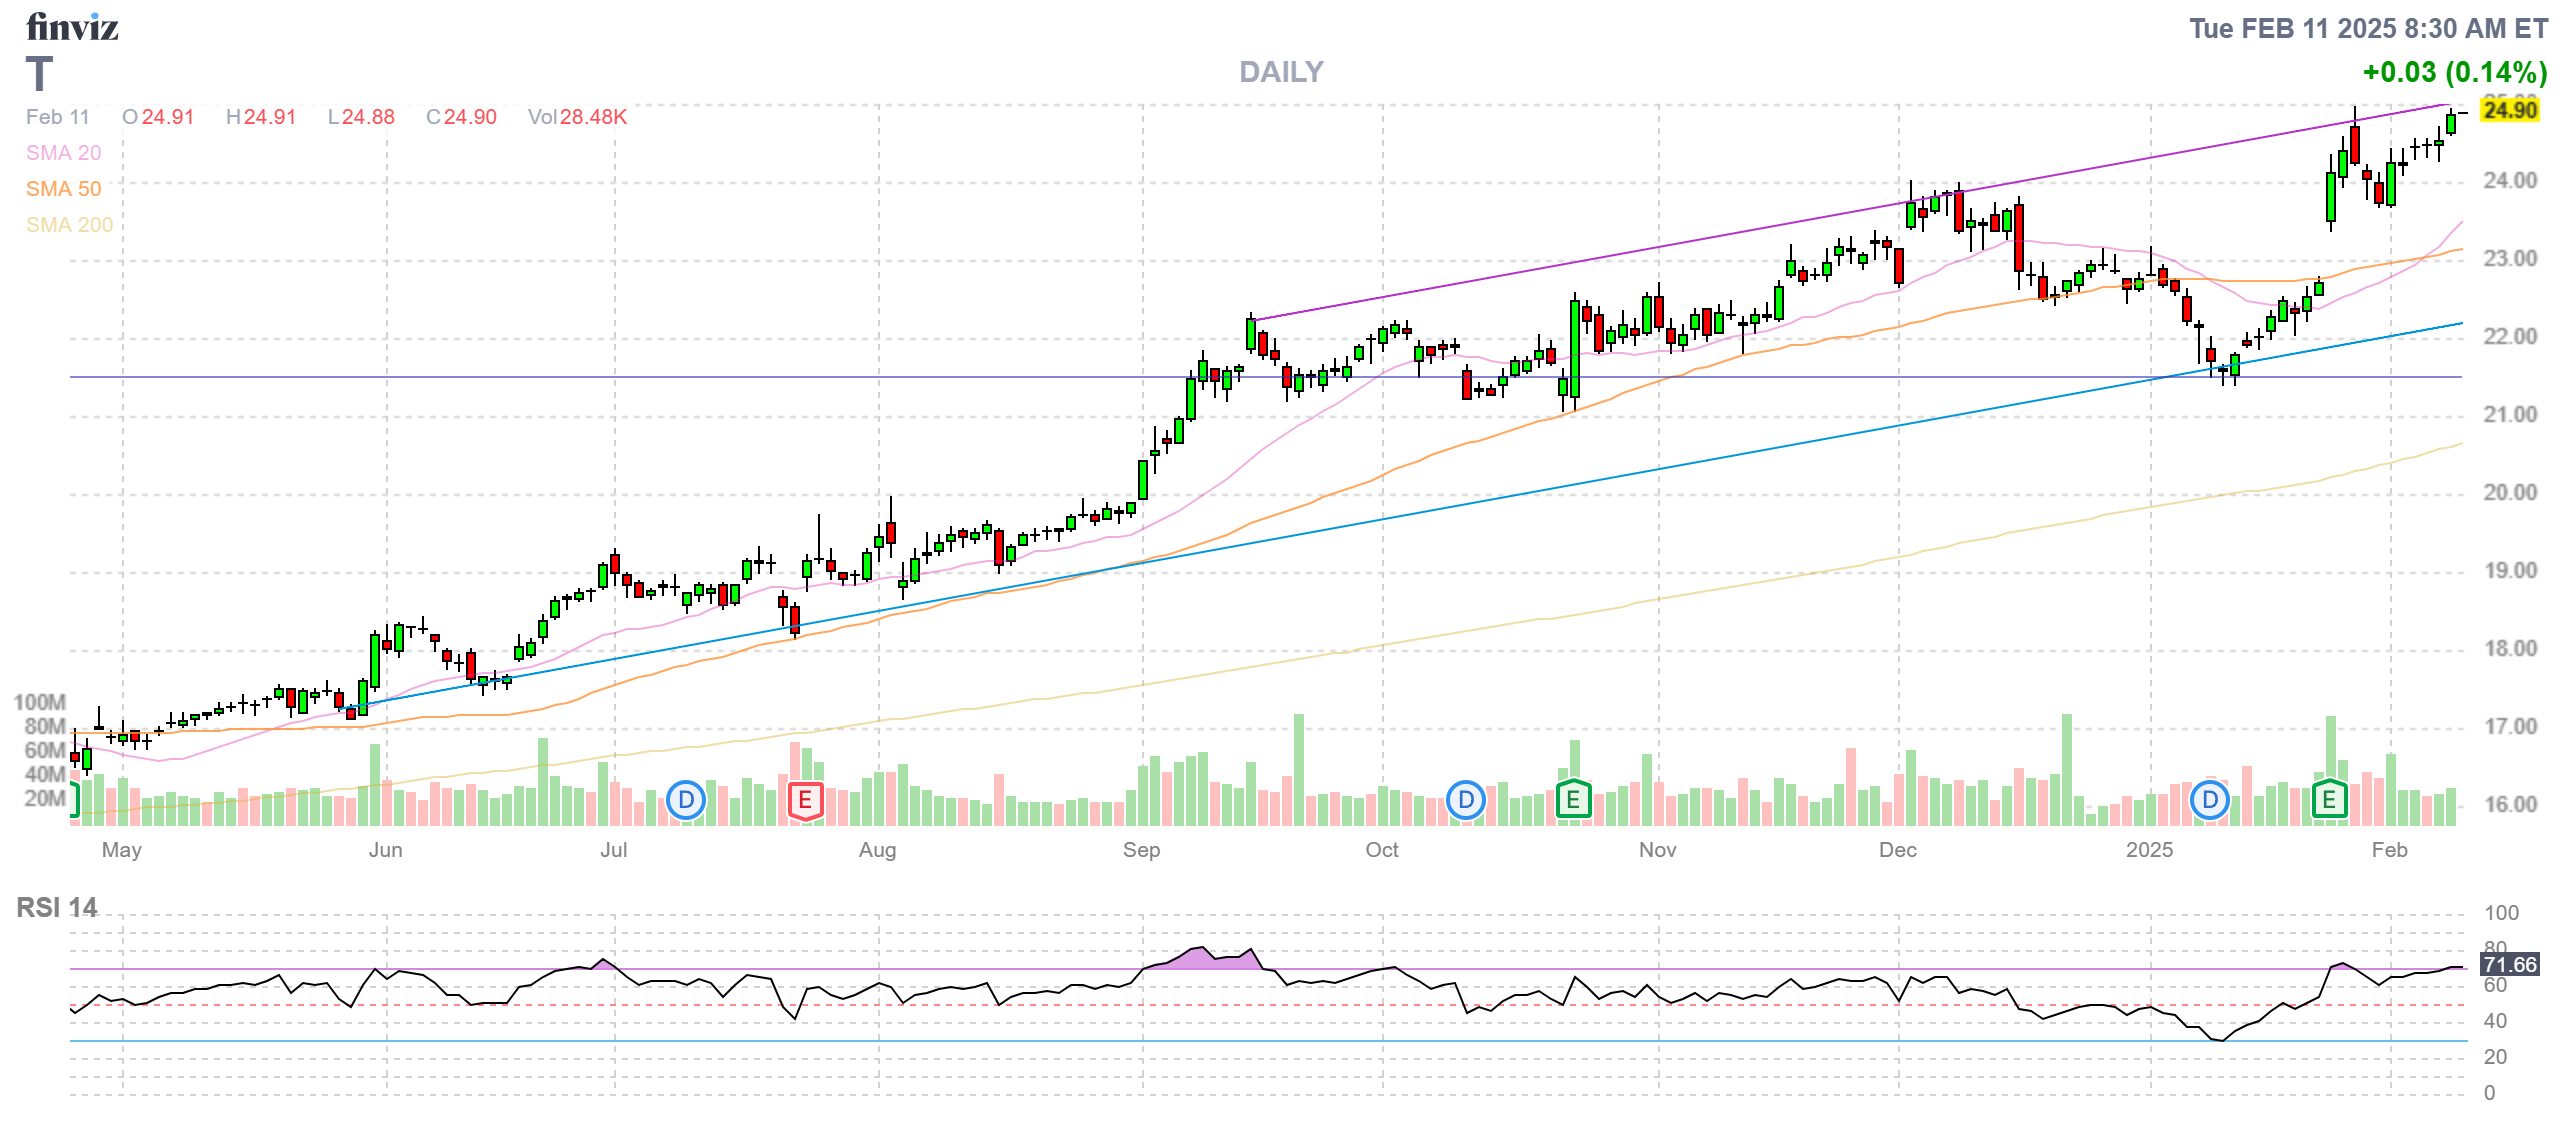
- T – Way over our target at net $3,475 on the $5,000 spread with $1,525 (43.8%) upside potential by January.
-
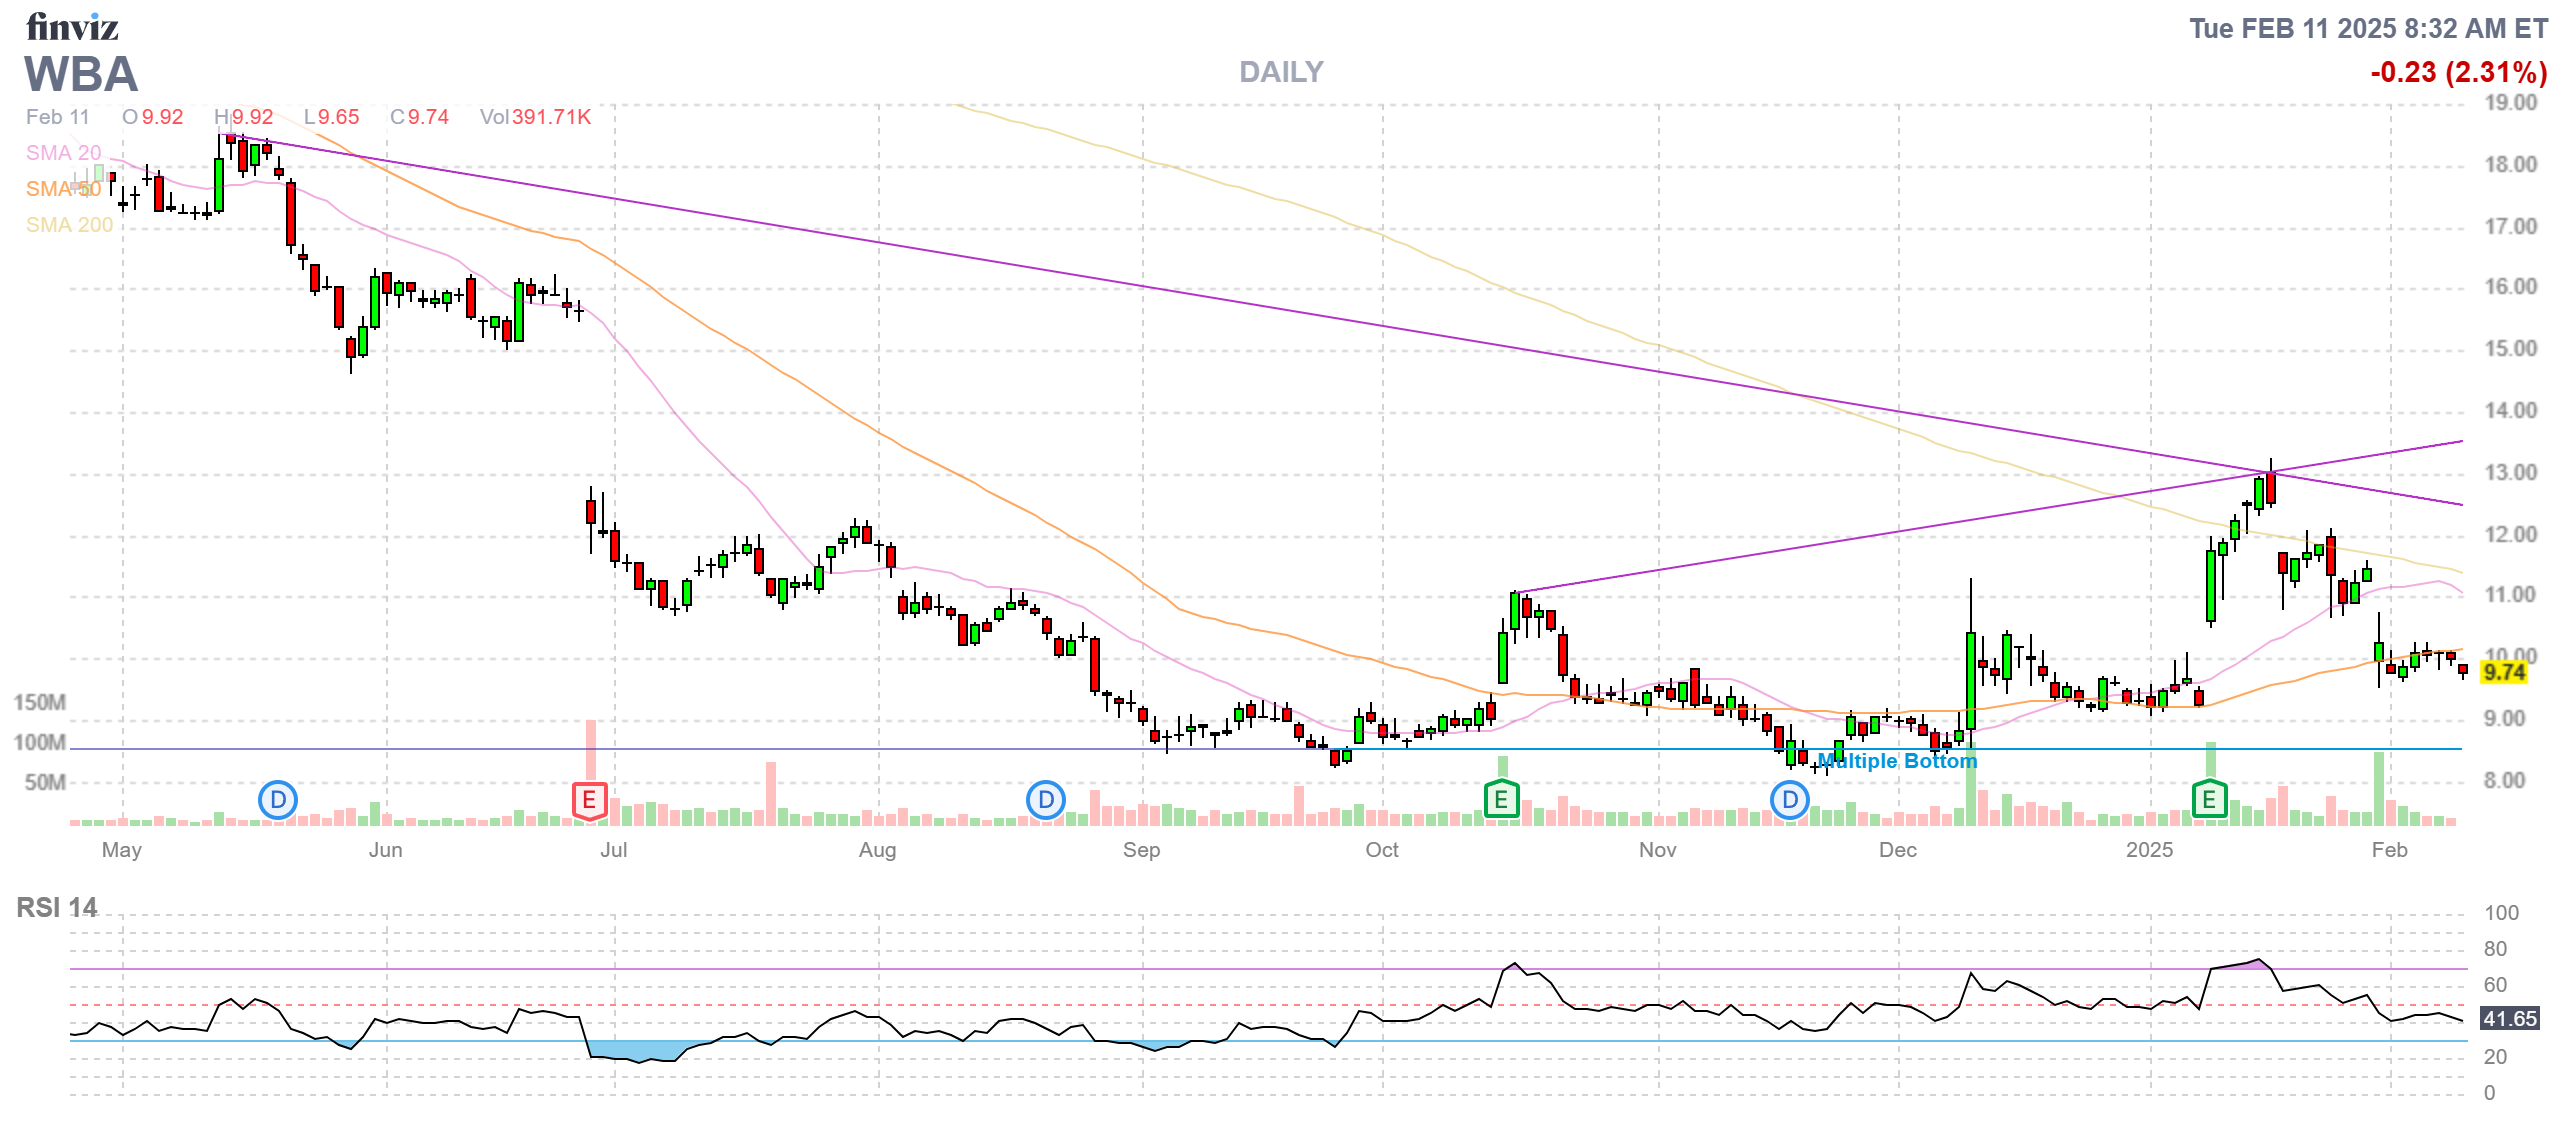
- WBA – On track at net $1,925 on the $5,000 spread with $3,075 (159%) upside potential.
-
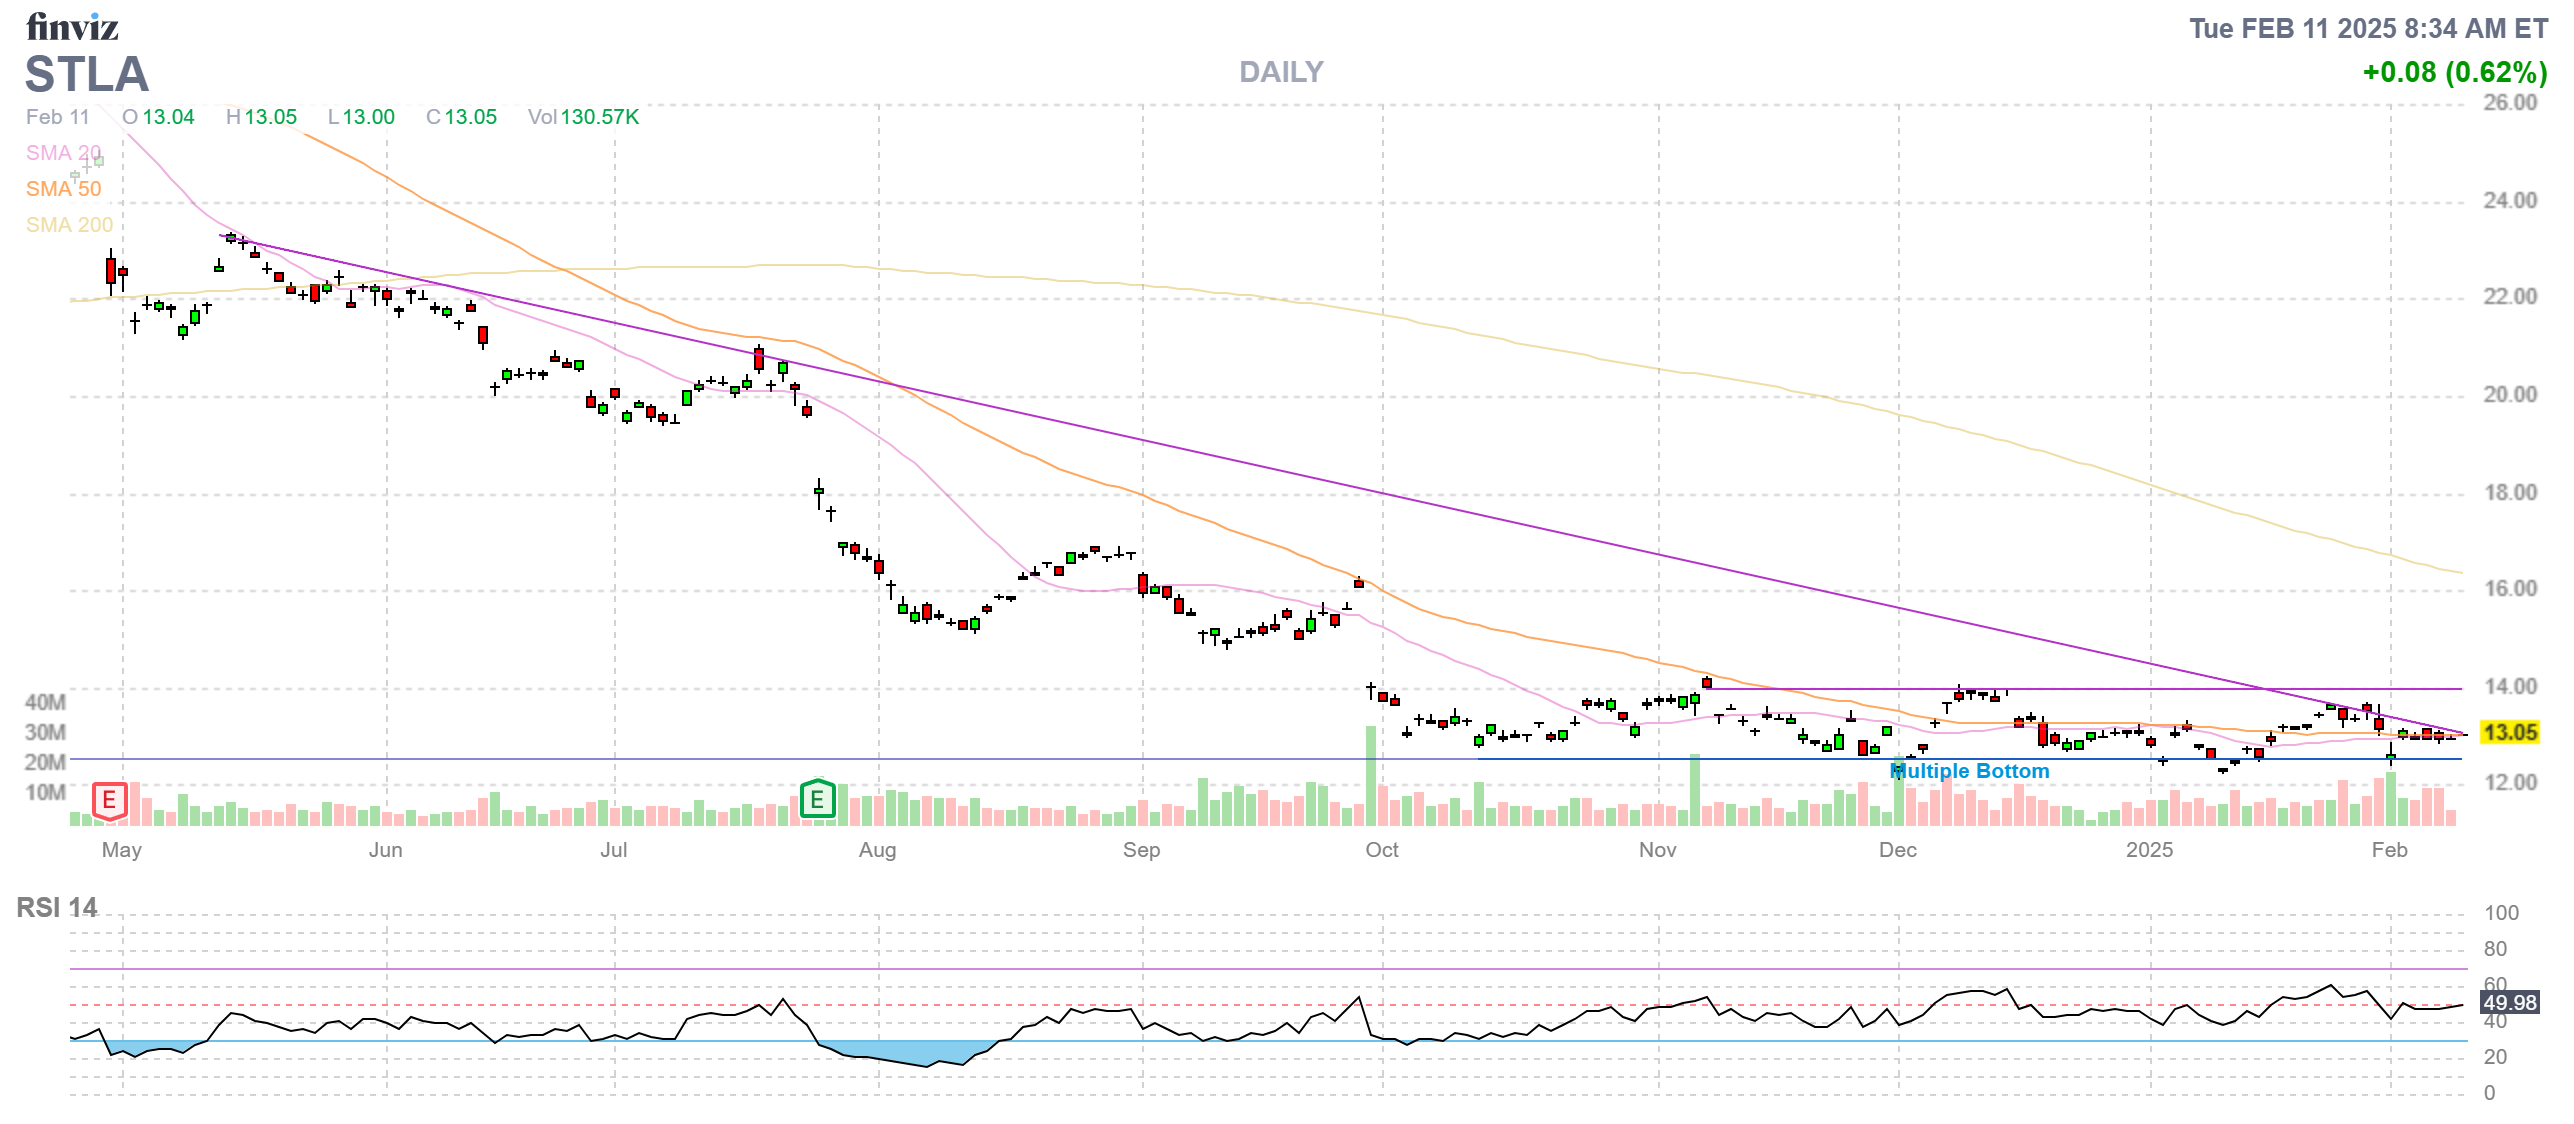
- STLA – Going nowhere so far but stupidly cheap at net $945 in the $1,500 spread with $555 (58.7%) upside potential.
-
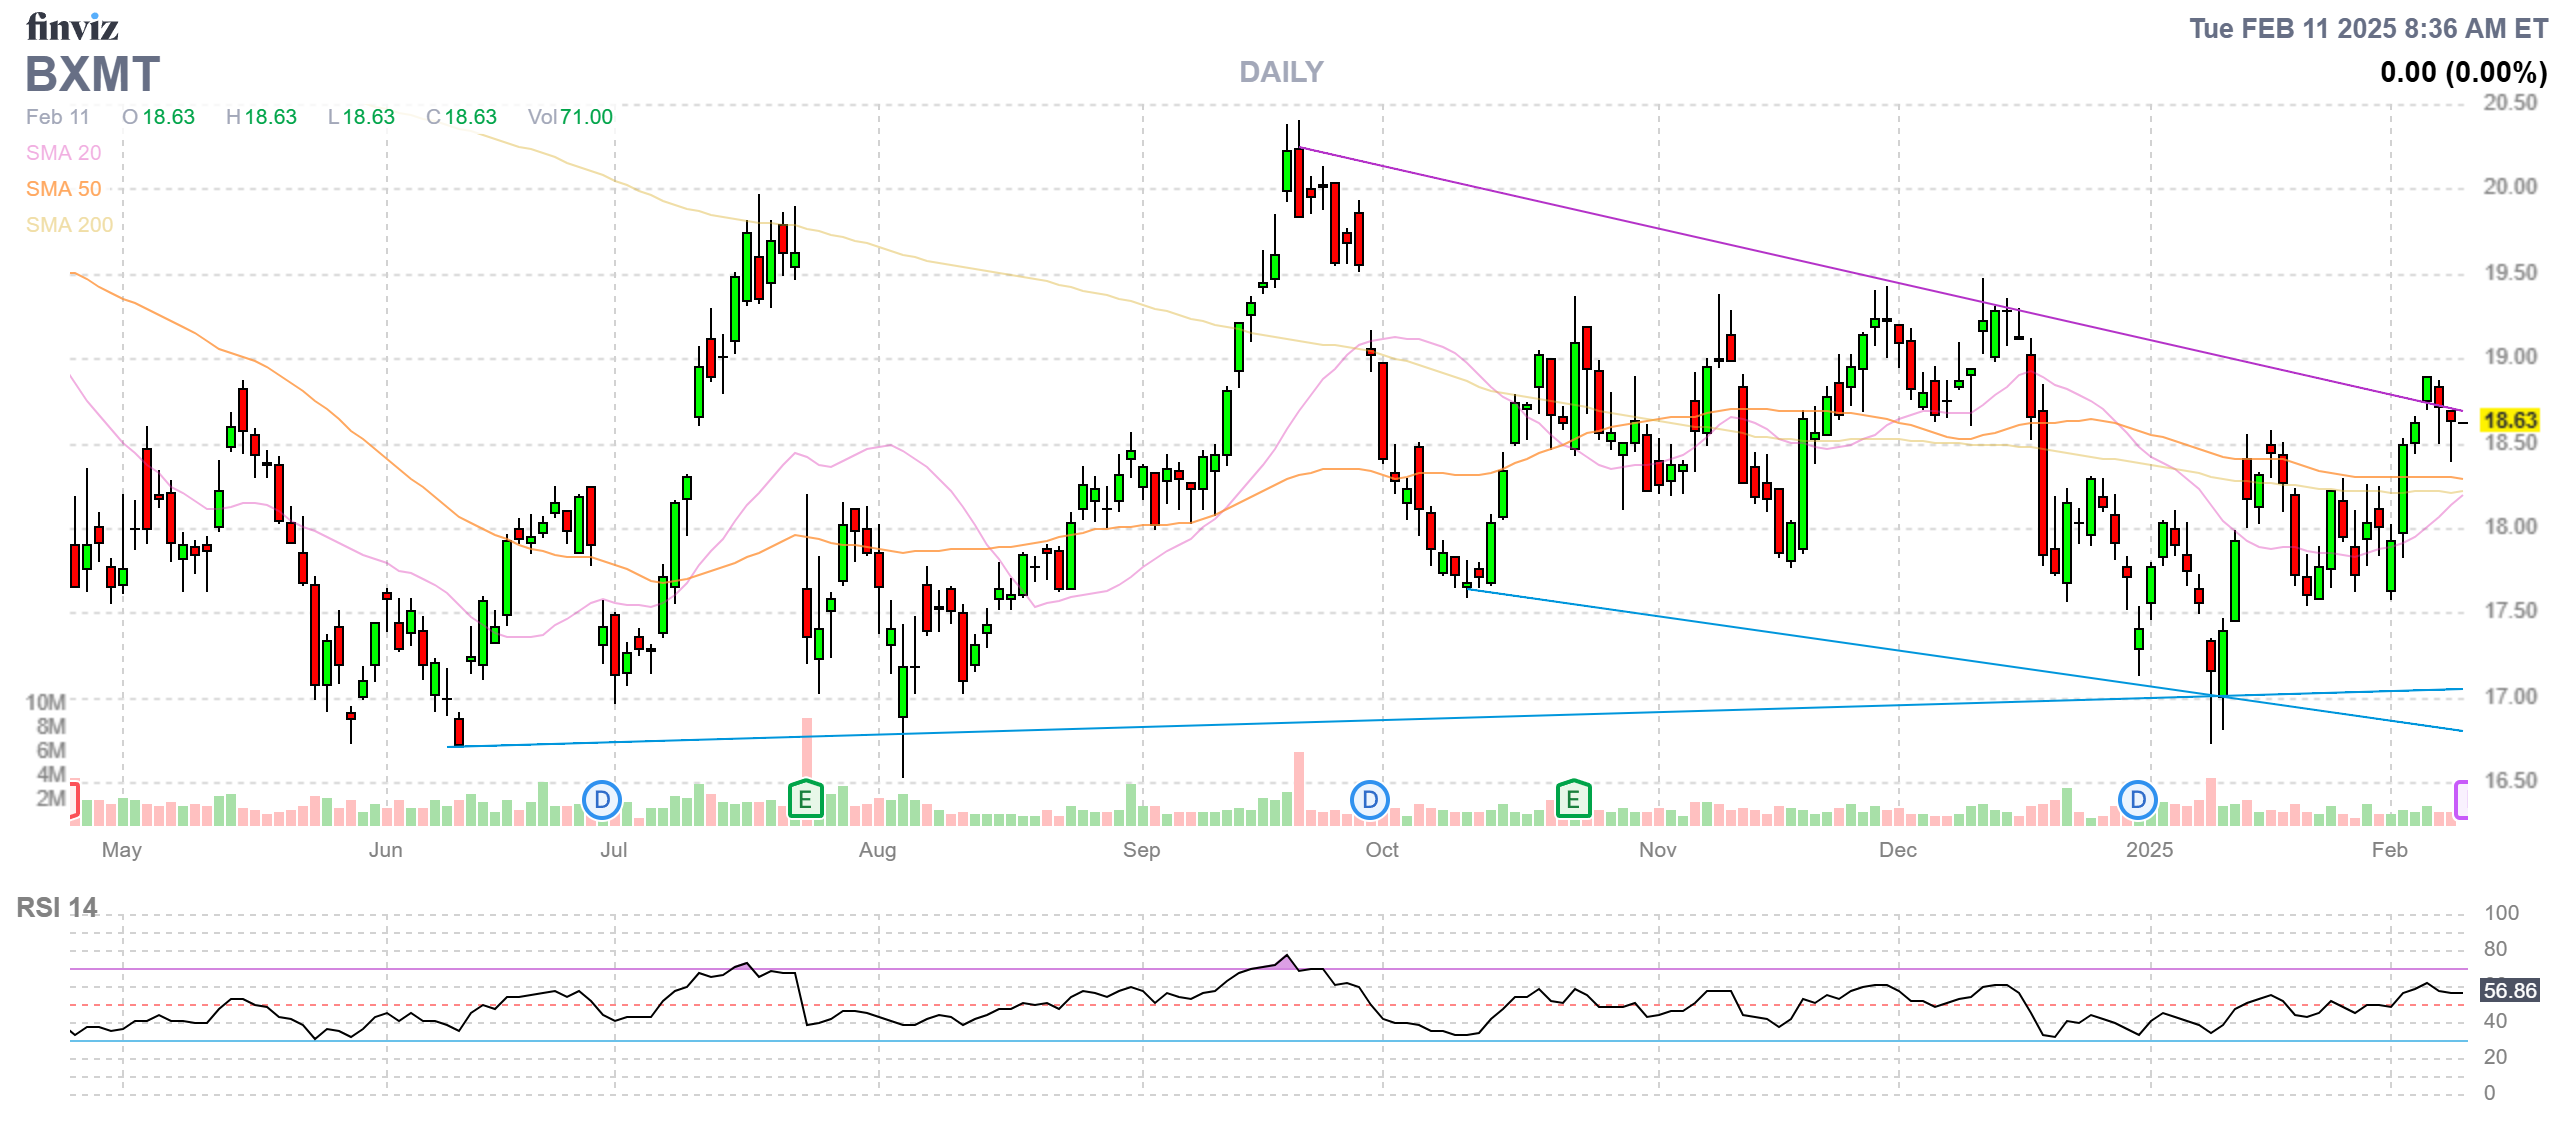
- BXMT – On track and just paid us $94 (3.4%) for the Q against our net $2,701 position – nice money while we wait. Our net entry was $2,430 and, at $18, we get called away for $3,600 for a $1,170 (48%) profit in January. Nice and boring!
-
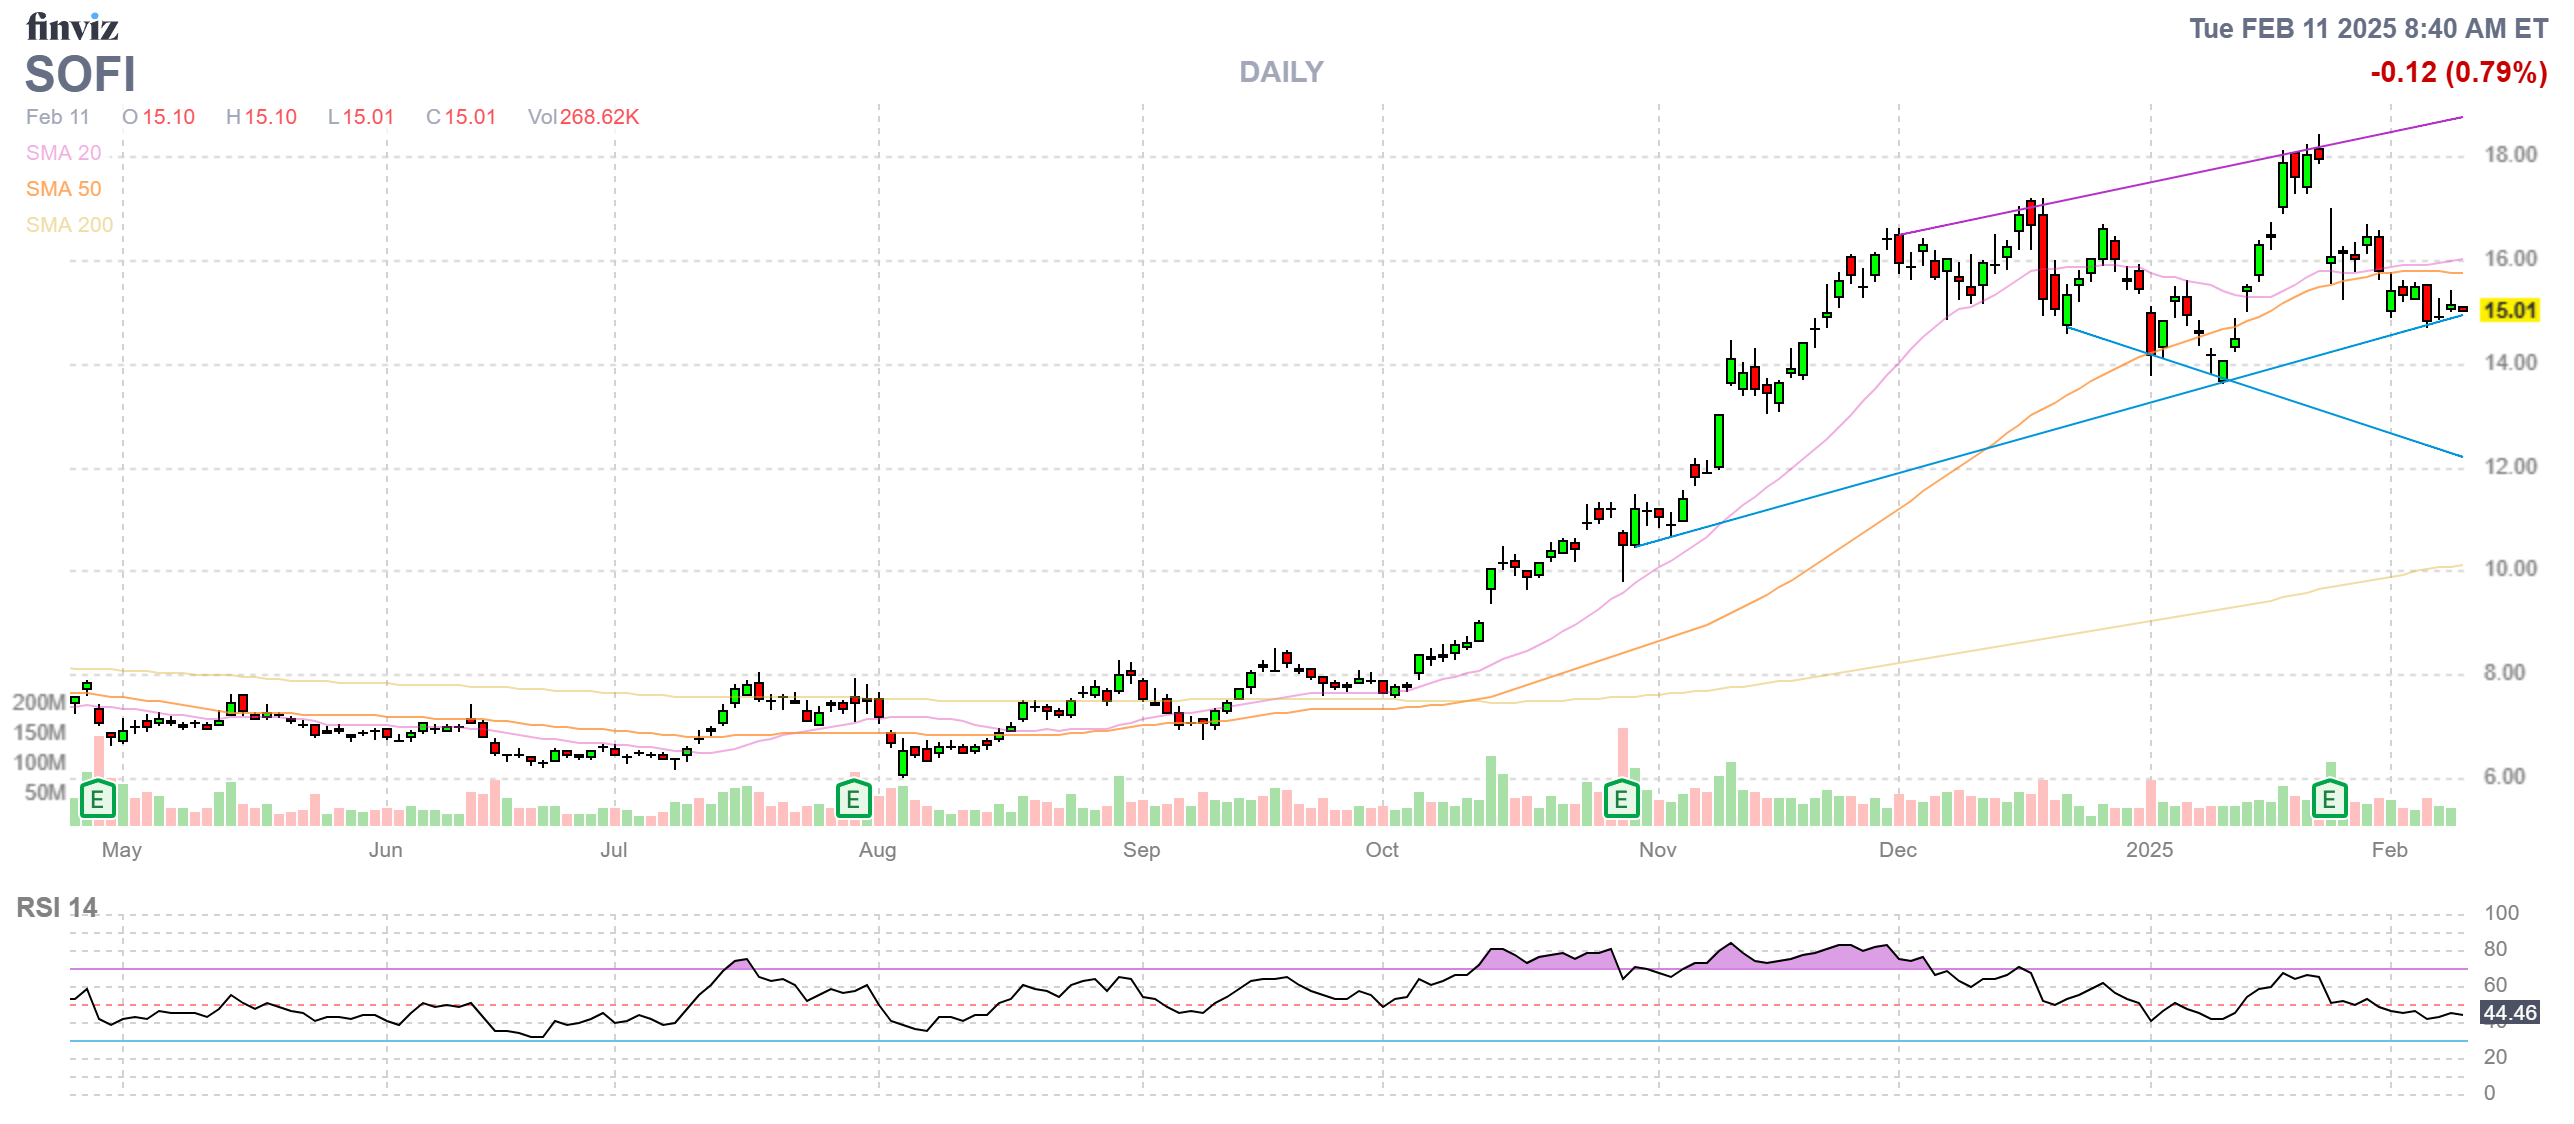
- SOFI – Already at our goal at net $1,985 on the $3,500 spread with $1,515 (76.3%) upside potential.
-
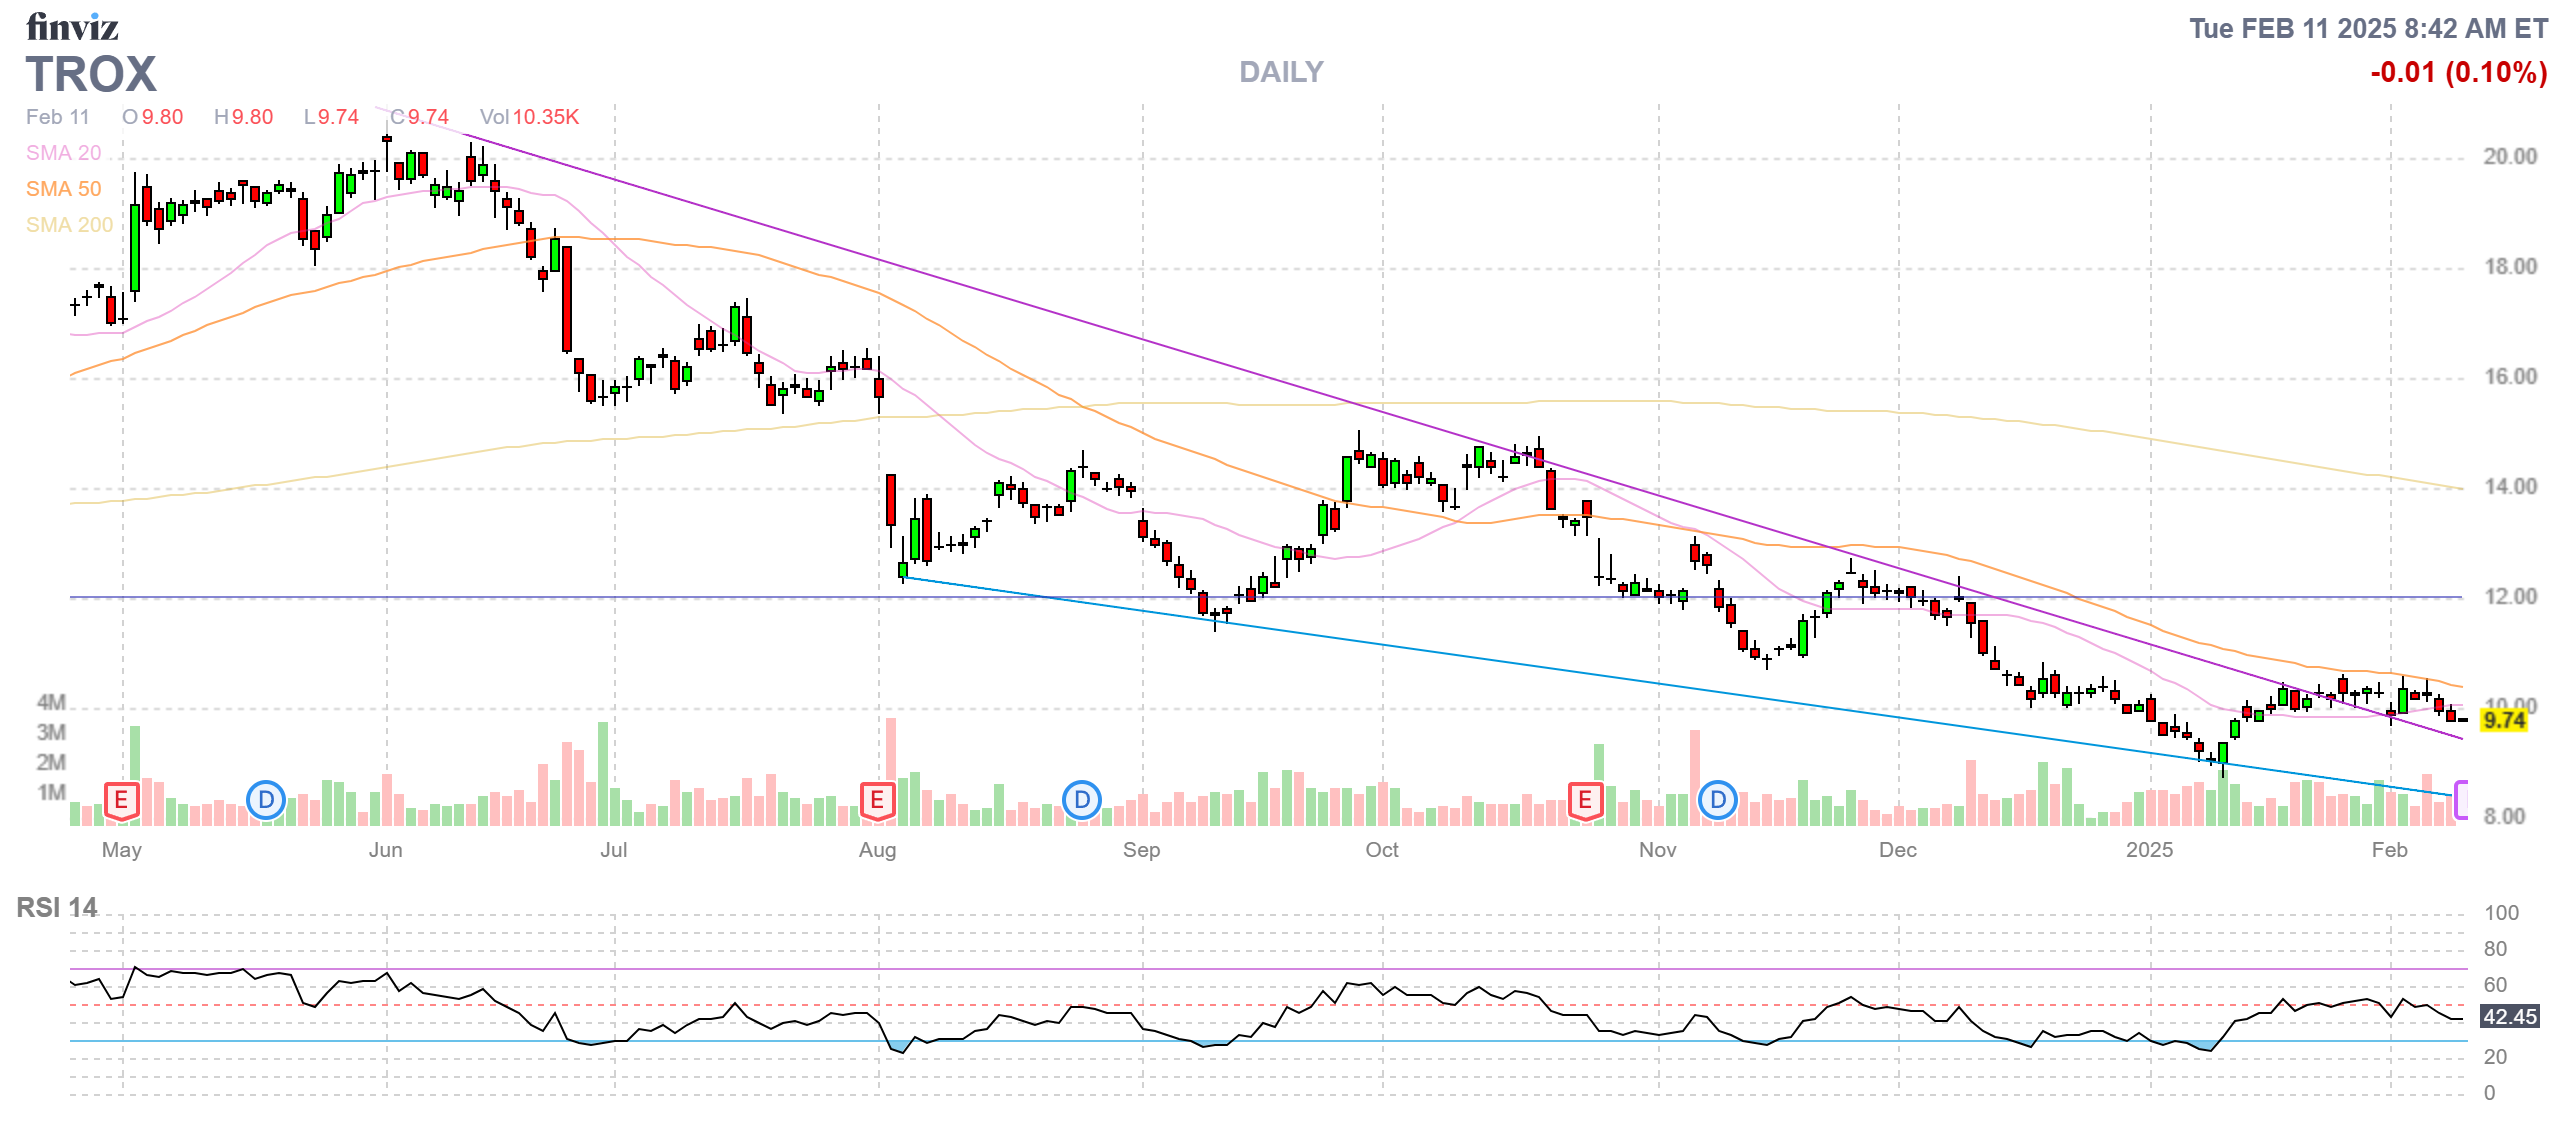
- TROX – Waiting for them to make a move. Net $3,750 has $4,250 (113%) of upside potential.
-
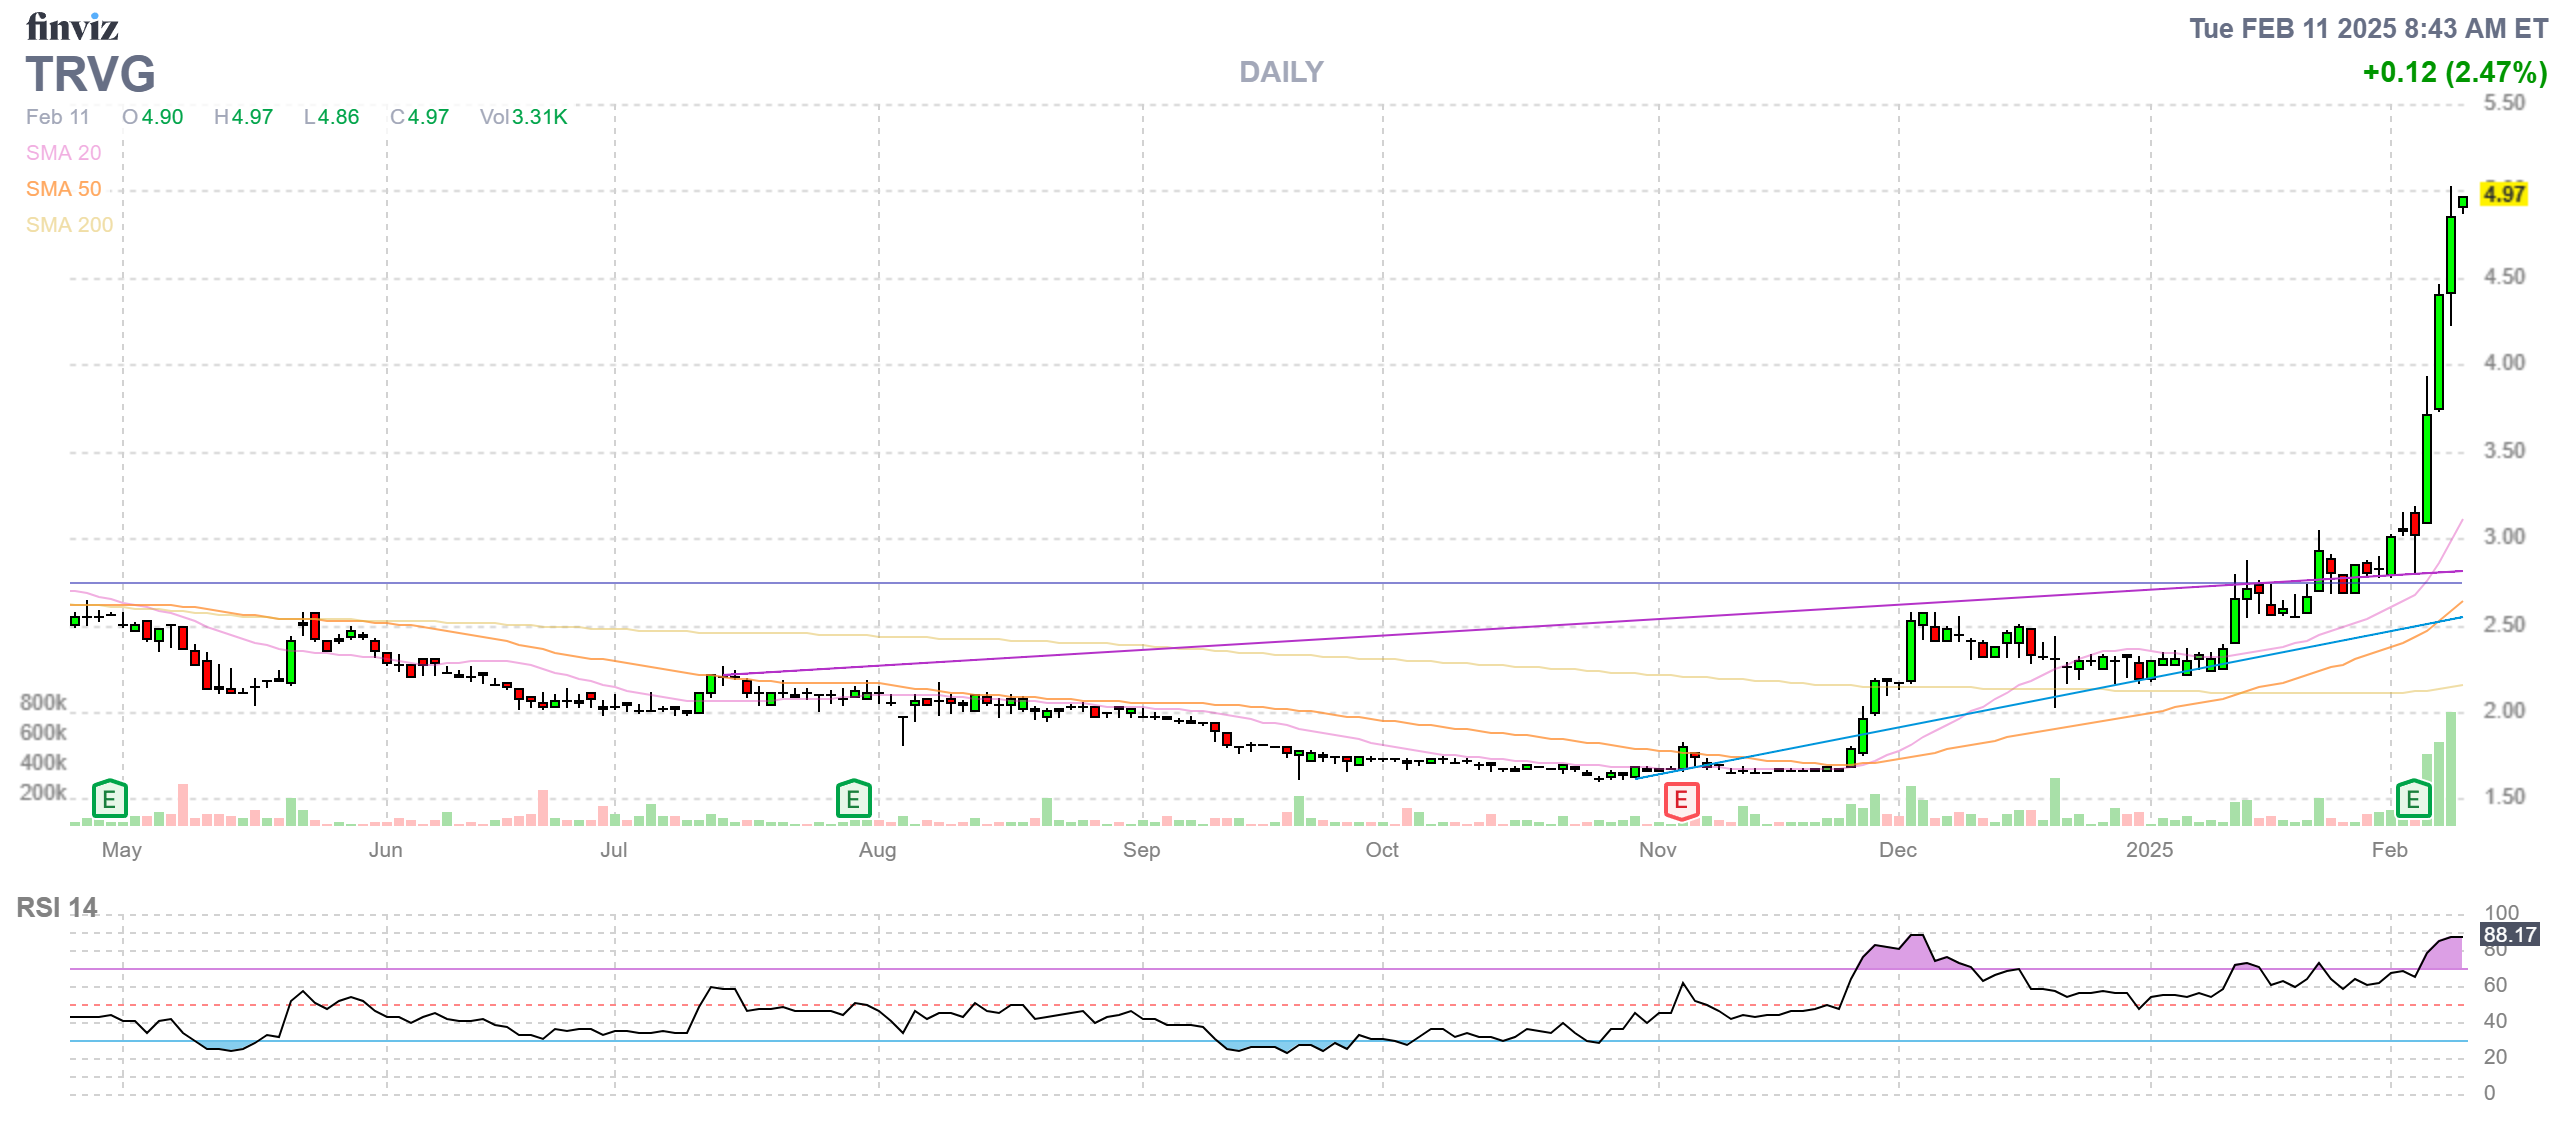
- TRVG – Exploded off earnings and we were very bullish so aa nice win. Let’s sell 5 July $5 calls for $1 ($500) to lock in the gains.
-
- VALE – Well, we are off the lows but a long way to go to get our original call money back.

So, on the whole, the positions are too good and we had nothing really to adjust. I guess that will then shift our focus to adding a couple of new ones – so stay tuned.
")
")


